Free Statistics
of Irreproducible Research!
Description of Statistical Computation | |||||||||||||||||||||||||||||||||||||||||
|---|---|---|---|---|---|---|---|---|---|---|---|---|---|---|---|---|---|---|---|---|---|---|---|---|---|---|---|---|---|---|---|---|---|---|---|---|---|---|---|---|---|
| Author's title | |||||||||||||||||||||||||||||||||||||||||
| Author | *Unverified author* | ||||||||||||||||||||||||||||||||||||||||
| R Software Module | rwasp_univariatedataseries.wasp | ||||||||||||||||||||||||||||||||||||||||
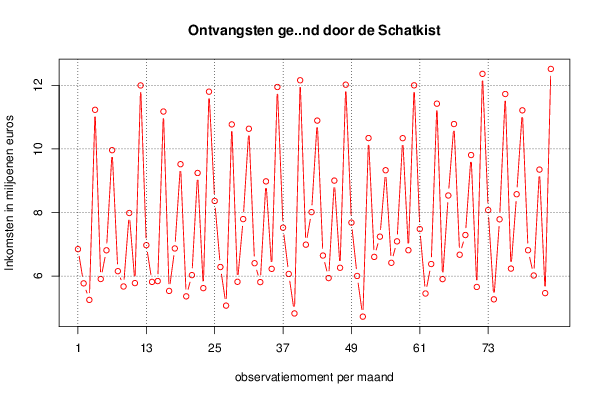
| Title produced by software | Univariate Data Series | ||||||||||||||||||||||||||||||||||||||||
| Date of computation | Sun, 07 Oct 2012 13:57:08 -0400 | ||||||||||||||||||||||||||||||||||||||||
| Cite this page as follows | Statistical Computations at FreeStatistics.org, Office for Research Development and Education, URL https://freestatistics.org/blog/index.php?v=date/2012/Oct/07/t13496327171oihyppuhfywc4o.htm/, Retrieved Sat, 30 May 2026 05:41:31 +0000 | ||||||||||||||||||||||||||||||||||||||||
| Statistical Computations at FreeStatistics.org, Office for Research Development and Education, URL https://freestatistics.org/blog/index.php?pk=173069, Retrieved Sat, 30 May 2026 05:41:31 +0000 | |||||||||||||||||||||||||||||||||||||||||
| QR Codes: | |||||||||||||||||||||||||||||||||||||||||
|
| |||||||||||||||||||||||||||||||||||||||||
| Original text written by user: | |||||||||||||||||||||||||||||||||||||||||
| IsPrivate? | No (this computation is public) | ||||||||||||||||||||||||||||||||||||||||
| User-defined keywords | |||||||||||||||||||||||||||||||||||||||||
| Estimated Impact | 424 | ||||||||||||||||||||||||||||||||||||||||
Tree of Dependent Computations | |||||||||||||||||||||||||||||||||||||||||
| Family? (F = Feedback message, R = changed R code, M = changed R Module, P = changed Parameters, D = changed Data) | |||||||||||||||||||||||||||||||||||||||||
| - [Univariate Data Series] [Ontvangsten ge�nd...] [2012-10-07 17:57:08] [1fc6f30e88849aa85fd62e34f240f44c] [Current] - RMP [Central Tendency] [Centrummaten ontv...] [2012-10-11 15:49:27] [7e0b1fc7e94581fb4f84255f8aa2fbc5] - R D [Central Tendency] [Centrummaten ontv...] [2012-10-11 15:56:24] [7e0b1fc7e94581fb4f84255f8aa2fbc5] - RMP [Mean Plot] [Ontvangsten schat...] [2012-10-18 14:12:08] [7e0b1fc7e94581fb4f84255f8aa2fbc5] - RMP [(Partial) Autocorrelation Function] [schatkist autocor...] [2012-11-12 11:07:31] [7e0b1fc7e94581fb4f84255f8aa2fbc5] - R P [(Partial) Autocorrelation Function] [schatkist autocor...] [2012-11-12 11:09:46] [7e0b1fc7e94581fb4f84255f8aa2fbc5] - RMP [Blocked Bootstrap Plot - Central Tendency] [density plot rek ...] [2012-11-22 19:31:20] [7e0b1fc7e94581fb4f84255f8aa2fbc5] - R P [Blocked Bootstrap Plot - Central Tendency] [density plot rek ...] [2012-11-22 19:33:45] [7e0b1fc7e94581fb4f84255f8aa2fbc5] - P [Blocked Bootstrap Plot - Central Tendency] [density plot rek ...] [2012-11-22 19:35:27] [7e0b1fc7e94581fb4f84255f8aa2fbc5] - RMP [Classical Decomposition] [Classical Deompos...] [2012-12-06 18:42:10] [74be16979710d4c4e7c6647856088456] - R P [Classical Decomposition] [Classical Deompos...] [2012-12-06 18:44:34] [74be16979710d4c4e7c6647856088456] - RMP [Exponential Smoothing] [Exponential Smoot...] [2013-01-11 16:16:59] [7e0b1fc7e94581fb4f84255f8aa2fbc5] - RMP [Variability] [spreidingsmaten s...] [2012-11-30 11:19:52] [7e0b1fc7e94581fb4f84255f8aa2fbc5] - RMP [Standard Deviation Plot] [spreidingsgrafiek...] [2012-11-30 11:20:44] [7e0b1fc7e94581fb4f84255f8aa2fbc5] - RMP [Standard Deviation-Mean Plot] [spreidings- en ge...] [2012-11-30 11:21:47] [7e0b1fc7e94581fb4f84255f8aa2fbc5] - RM D [Mean versus Median] [Gemiddelde versus...] [2012-10-11 16:06:05] [7e0b1fc7e94581fb4f84255f8aa2fbc5] - RMP [Histogram] [inkomsten schatki...] [2012-10-11 16:42:04] [7e0b1fc7e94581fb4f84255f8aa2fbc5] - R P [Histogram] [frequentietabel s...] [2012-10-11 16:48:19] [7e0b1fc7e94581fb4f84255f8aa2fbc5] - R [Histogram] [inkomsten schatki...] [2012-10-11 16:53:13] [7e0b1fc7e94581fb4f84255f8aa2fbc5] - RM [Kernel Density Estimation] [Dichtheidsgrafiek...] [2012-10-11 16:57:20] [7e0b1fc7e94581fb4f84255f8aa2fbc5] - RMPD [Quartiles] [Kwartielen ontvan...] [2012-10-18 14:57:20] [7e0b1fc7e94581fb4f84255f8aa2fbc5] - RMPD [Notched Boxplots] [Box-Plot inkomste...] [2012-10-18 15:08:21] [7e0b1fc7e94581fb4f84255f8aa2fbc5] - RMPD [Harrell-Davis Quantiles] [HD Ontvangsten sc...] [2012-10-18 15:17:40] [7e0b1fc7e94581fb4f84255f8aa2fbc5] - RMPD [Harrell-Davis Quantiles] [percentielen inko...] [2012-10-18 15:23:27] [7e0b1fc7e94581fb4f84255f8aa2fbc5] | |||||||||||||||||||||||||||||||||||||||||
| Feedback Forum | |||||||||||||||||||||||||||||||||||||||||
Post a new message | |||||||||||||||||||||||||||||||||||||||||
Dataset | |||||||||||||||||||||||||||||||||||||||||
| Dataseries X: | |||||||||||||||||||||||||||||||||||||||||
6.848 5.772 5.251 11.232 5.908 6.812 9.962 6.155 5.673 7.985 5.780 11.999 6.973 5.817 5.844 11.178 5.533 6.870 9.521 5.363 6.031 9.245 5.621 11.802 8.364 6.286 5.071 10.773 5.821 7.794 10.636 6.405 5.811 8.981 6.228 11.950 7.523 6.067 4.825 12.162 6.989 8.012 10.893 6.647 5.938 9.005 6.262 12.022 7.683 6.004 4.724 10.343 6.604 7.241 9.331 6.418 7.094 10.340 6.814 12.003 7.481 5.452 6.380 11.425 5.905 8.536 10.785 6.672 7.293 9.809 5.658 12.364 8.078 5.269 7.787 11.729 6.236 8.576 11.216 6.814 6.019 9.351 5.464 12.518 | |||||||||||||||||||||||||||||||||||||||||
Tables (Output of Computation) | |||||||||||||||||||||||||||||||||||||||||
| |||||||||||||||||||||||||||||||||||||||||
Figures (Output of Computation) | |||||||||||||||||||||||||||||||||||||||||
Input Parameters & R Code | |||||||||||||||||||||||||||||||||||||||||
| Parameters (Session): | |||||||||||||||||||||||||||||||||||||||||
| par1 = ontvangsten geïnd door de Schatkist ; par2 = Belgostat ; par3 = De ontvangsten die geïnd zijn door de Schatkist ( = totaal van de geldmiddelen van België), per maand. ; par4 = 12 ; | |||||||||||||||||||||||||||||||||||||||||
| Parameters (R input): | |||||||||||||||||||||||||||||||||||||||||
| par1 = ontvangsten geïnd door de Schatkist ; par2 = Belgostat ; par3 = De ontvangsten die geïnd zijn door de Schatkist ( = totaal van de geldmiddelen van België), per maand. ; par4 = 12 ; | |||||||||||||||||||||||||||||||||||||||||
| R code (references can be found in the software module): | |||||||||||||||||||||||||||||||||||||||||
par4 <- '12' | |||||||||||||||||||||||||||||||||||||||||