Free Statistics
of Irreproducible Research!
Description of Statistical Computation | |||||||||||||||||||||||||||||||||||||||||||||||||||||||||||||||||||||||||||||||||
|---|---|---|---|---|---|---|---|---|---|---|---|---|---|---|---|---|---|---|---|---|---|---|---|---|---|---|---|---|---|---|---|---|---|---|---|---|---|---|---|---|---|---|---|---|---|---|---|---|---|---|---|---|---|---|---|---|---|---|---|---|---|---|---|---|---|---|---|---|---|---|---|---|---|---|---|---|---|---|---|---|---|
| Author's title | |||||||||||||||||||||||||||||||||||||||||||||||||||||||||||||||||||||||||||||||||
| Author | *Unverified author* | ||||||||||||||||||||||||||||||||||||||||||||||||||||||||||||||||||||||||||||||||
| R Software Module | rwasp_bootstrapplot.wasp | ||||||||||||||||||||||||||||||||||||||||||||||||||||||||||||||||||||||||||||||||
| Title produced by software | Blocked Bootstrap Plot - Central Tendency | ||||||||||||||||||||||||||||||||||||||||||||||||||||||||||||||||||||||||||||||||
| Date of computation | Thu, 22 Nov 2012 14:33:45 -0500 | ||||||||||||||||||||||||||||||||||||||||||||||||||||||||||||||||||||||||||||||||
| Cite this page as follows | Statistical Computations at FreeStatistics.org, Office for Research Development and Education, URL https://freestatistics.org/blog/index.php?v=date/2012/Nov/22/t1353612859az26yqi3um8y86a.htm/, Retrieved Fri, 09 Jan 2026 22:15:47 +0000 | ||||||||||||||||||||||||||||||||||||||||||||||||||||||||||||||||||||||||||||||||
| Statistical Computations at FreeStatistics.org, Office for Research Development and Education, URL https://freestatistics.org/blog/index.php?pk=191904, Retrieved Fri, 09 Jan 2026 22:15:47 +0000 | |||||||||||||||||||||||||||||||||||||||||||||||||||||||||||||||||||||||||||||||||
| QR Codes: | |||||||||||||||||||||||||||||||||||||||||||||||||||||||||||||||||||||||||||||||||
|
| |||||||||||||||||||||||||||||||||||||||||||||||||||||||||||||||||||||||||||||||||
| Original text written by user: | |||||||||||||||||||||||||||||||||||||||||||||||||||||||||||||||||||||||||||||||||
| IsPrivate? | No (this computation is public) | ||||||||||||||||||||||||||||||||||||||||||||||||||||||||||||||||||||||||||||||||
| User-defined keywords | |||||||||||||||||||||||||||||||||||||||||||||||||||||||||||||||||||||||||||||||||
| Estimated Impact | 423 | ||||||||||||||||||||||||||||||||||||||||||||||||||||||||||||||||||||||||||||||||
Tree of Dependent Computations | |||||||||||||||||||||||||||||||||||||||||||||||||||||||||||||||||||||||||||||||||
| Family? (F = Feedback message, R = changed R code, M = changed R Module, P = changed Parameters, D = changed Data) | |||||||||||||||||||||||||||||||||||||||||||||||||||||||||||||||||||||||||||||||||
| - [Univariate Data Series] [Ontvangsten geïnd...] [2012-10-07 17:57:08] [7e0b1fc7e94581fb4f84255f8aa2fbc5] - RMP [Central Tendency] [Centrummaten ontv...] [2012-10-11 15:49:27] [7e0b1fc7e94581fb4f84255f8aa2fbc5] - R D [Central Tendency] [Centrummaten ontv...] [2012-10-11 15:56:24] [7e0b1fc7e94581fb4f84255f8aa2fbc5] - RMP [Mean Plot] [Ontvangsten schat...] [2012-10-18 14:12:08] [7e0b1fc7e94581fb4f84255f8aa2fbc5] - RMP [(Partial) Autocorrelation Function] [schatkist autocor...] [2012-11-12 11:07:31] [7e0b1fc7e94581fb4f84255f8aa2fbc5] - RMP [Blocked Bootstrap Plot - Central Tendency] [density plot rek ...] [2012-11-22 19:31:20] [7e0b1fc7e94581fb4f84255f8aa2fbc5] - R P [Blocked Bootstrap Plot - Central Tendency] [density plot rek ...] [2012-11-22 19:33:45] [1fc6f30e88849aa85fd62e34f240f44c] [Current] - P [Blocked Bootstrap Plot - Central Tendency] [density plot rek ...] [2012-11-22 19:35:27] [7e0b1fc7e94581fb4f84255f8aa2fbc5] - RMP [Classical Decomposition] [Classical Deompos...] [2012-12-06 18:42:10] [74be16979710d4c4e7c6647856088456] - R P [Classical Decomposition] [Classical Deompos...] [2012-12-06 18:44:34] [74be16979710d4c4e7c6647856088456] - RMP [Exponential Smoothing] [Exponential Smoot...] [2013-01-11 16:16:59] [7e0b1fc7e94581fb4f84255f8aa2fbc5] - RMP [Variability] [spreidingsmaten s...] [2012-11-30 11:19:52] [7e0b1fc7e94581fb4f84255f8aa2fbc5] - RMP [Standard Deviation Plot] [spreidingsgrafiek...] [2012-11-30 11:20:44] [7e0b1fc7e94581fb4f84255f8aa2fbc5] - RMP [Standard Deviation-Mean Plot] [spreidings- en ge...] [2012-11-30 11:21:47] [7e0b1fc7e94581fb4f84255f8aa2fbc5] | |||||||||||||||||||||||||||||||||||||||||||||||||||||||||||||||||||||||||||||||||
| Feedback Forum | |||||||||||||||||||||||||||||||||||||||||||||||||||||||||||||||||||||||||||||||||
Post a new message | |||||||||||||||||||||||||||||||||||||||||||||||||||||||||||||||||||||||||||||||||
Dataset | |||||||||||||||||||||||||||||||||||||||||||||||||||||||||||||||||||||||||||||||||
| Dataseries X: | |||||||||||||||||||||||||||||||||||||||||||||||||||||||||||||||||||||||||||||||||
6848 5772 5251 11232 5908 6812 9962 6155 5673 7985 5780 11999 6973 5817 5844 11178 5533 6870 9521 5363 6031 9245 5621 11802 8364 6286 5071 10773 5821 7794 10636 6405 5811 8981 6228 11950 7523 6067 4825 12162 6989 8012 10893 6647 5938 9005 6262 12022 7683 6004 4724 10343 6604 7241 9331 6418 7094 10340 6814 12003 7481 5452 6380 11425 5905 8536 10785 6672 7293 9809 5658 12364 8078 5269 7787 11729 6236 8576 11216 6814 6019 9351 5464 12518 | |||||||||||||||||||||||||||||||||||||||||||||||||||||||||||||||||||||||||||||||||
Tables (Output of Computation) | |||||||||||||||||||||||||||||||||||||||||||||||||||||||||||||||||||||||||||||||||
| |||||||||||||||||||||||||||||||||||||||||||||||||||||||||||||||||||||||||||||||||
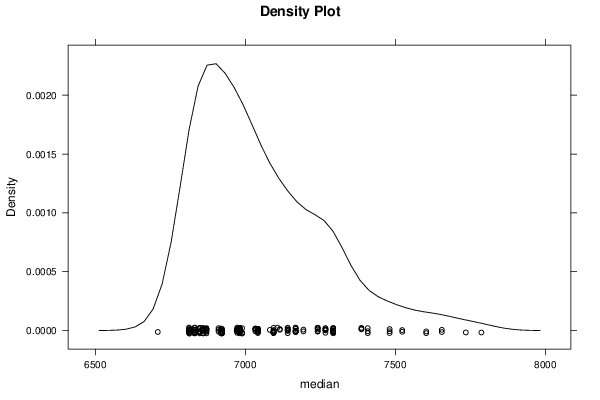
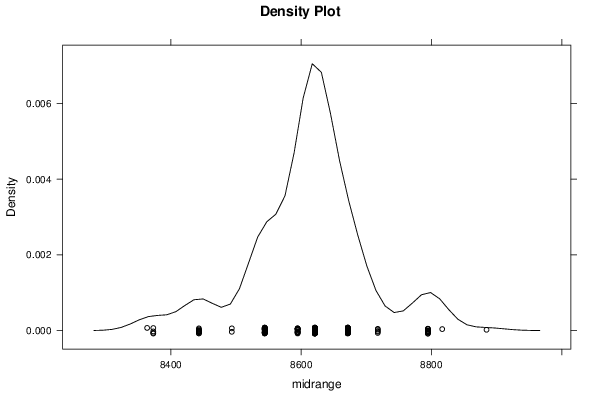
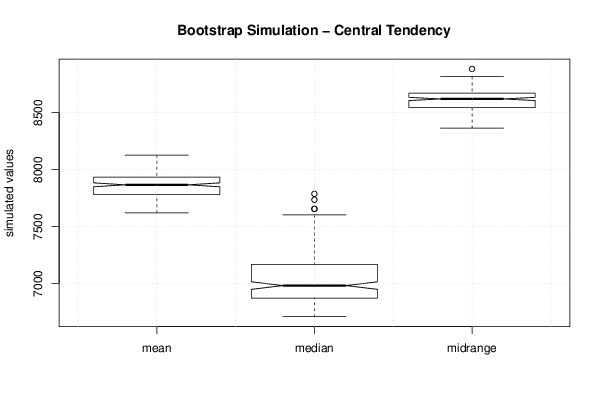
Figures (Output of Computation) | |||||||||||||||||||||||||||||||||||||||||||||||||||||||||||||||||||||||||||||||||
Input Parameters & R Code | |||||||||||||||||||||||||||||||||||||||||||||||||||||||||||||||||||||||||||||||||
| Parameters (Session): | |||||||||||||||||||||||||||||||||||||||||||||||||||||||||||||||||||||||||||||||||
| par1 = 200 ; par2 = 12 ; | |||||||||||||||||||||||||||||||||||||||||||||||||||||||||||||||||||||||||||||||||
| Parameters (R input): | |||||||||||||||||||||||||||||||||||||||||||||||||||||||||||||||||||||||||||||||||
| par1 = 200 ; par2 = 12 ; | |||||||||||||||||||||||||||||||||||||||||||||||||||||||||||||||||||||||||||||||||
| R code (references can be found in the software module): | |||||||||||||||||||||||||||||||||||||||||||||||||||||||||||||||||||||||||||||||||
par1 <- as.numeric(par1) | |||||||||||||||||||||||||||||||||||||||||||||||||||||||||||||||||||||||||||||||||
