Free Statistics
of Irreproducible Research!
Description of Statistical Computation | ||||||||||||||||||||||||||||||
|---|---|---|---|---|---|---|---|---|---|---|---|---|---|---|---|---|---|---|---|---|---|---|---|---|---|---|---|---|---|---|
| Author's title | ||||||||||||||||||||||||||||||
| Author | *The author of this computation has been verified* | |||||||||||||||||||||||||||||
| R Software Module | rwasp_Distributional Plots.wasp | |||||||||||||||||||||||||||||
| Title produced by software | Histogram, QQplot and Density | |||||||||||||||||||||||||||||
| Date of computation | Thu, 08 Nov 2012 07:43:00 -0500 | |||||||||||||||||||||||||||||
| Cite this page as follows | Statistical Computations at FreeStatistics.org, Office for Research Development and Education, URL https://freestatistics.org/blog/index.php?v=date/2012/Nov/08/t1352378598bp6rftdslq24pul.htm/, Retrieved Sat, 01 Aug 2026 08:39:42 +0000 | |||||||||||||||||||||||||||||
| Statistical Computations at FreeStatistics.org, Office for Research Development and Education, URL https://freestatistics.org/blog/index.php?pk=186607, Retrieved Sat, 01 Aug 2026 08:39:42 +0000 | ||||||||||||||||||||||||||||||
| QR Codes: | ||||||||||||||||||||||||||||||
|
| ||||||||||||||||||||||||||||||
| Original text written by user: | ||||||||||||||||||||||||||||||
| IsPrivate? | No (this computation is public) | |||||||||||||||||||||||||||||
| User-defined keywords | ||||||||||||||||||||||||||||||
| Estimated Impact | 471 | |||||||||||||||||||||||||||||
Tree of Dependent Computations | ||||||||||||||||||||||||||||||
| Family? (F = Feedback message, R = changed R code, M = changed R Module, P = changed Parameters, D = changed Data) | ||||||||||||||||||||||||||||||
| - [Variability] [Two-Way ANOVA] [2010-11-30 21:42:30] [74be16979710d4c4e7c6647856088456] - RM [Two-Way ANOVA] [Two-Way ANOVA - C...] [2011-11-28 17:22:56] [98fd0e87c3eb04e0cc2efde01dbafab6] - RMPD [Histogram, QQplot and Density] [Smokers curry rat...] [2011-12-02 13:55:45] [5ab72825a06ca2a73c828d10c85d14d8] - R D [Histogram, QQplot and Density] [SMK MILD] [2012-11-08 12:43:00] [d719889f2d22390bdadf7099c1498125] [Current] - D [Histogram, QQplot and Density] [SMK HOT] [2012-11-08 12:45:55] [d348de2867ebac67b202b75ed3686d34] - D [Histogram, QQplot and Density] [NS HOT] [2012-11-08 12:48:46] [d348de2867ebac67b202b75ed3686d34] - D [Histogram, QQplot and Density] [NS MILD] [2012-11-08 12:50:18] [d348de2867ebac67b202b75ed3686d34] - D [Histogram, QQplot and Density] [compmemomean] [2012-11-15 12:38:52] [d348de2867ebac67b202b75ed3686d34] - D [Histogram, QQplot and Density] [compattenmean] [2012-11-15 12:40:11] [d348de2867ebac67b202b75ed3686d34] - D [Histogram, QQplot and Density] [compappliedmean] [2012-11-15 12:41:19] [d348de2867ebac67b202b75ed3686d34] - D [Histogram, QQplot and Density] [Specmemmean] [2012-11-15 12:44:15] [d348de2867ebac67b202b75ed3686d34] - D [Histogram, QQplot and Density] [specattenmean] [2012-11-15 12:45:17] [d348de2867ebac67b202b75ed3686d34] - D [Histogram, QQplot and Density] [specappliedmean] [2012-11-15 12:46:24] [d348de2867ebac67b202b75ed3686d34] - RMPD [CARE Data - Boxplots and Scatterplot Matrix] [Scatter] [2012-11-15 13:15:37] [d348de2867ebac67b202b75ed3686d34] | ||||||||||||||||||||||||||||||
| Feedback Forum | ||||||||||||||||||||||||||||||
Post a new message | ||||||||||||||||||||||||||||||
Dataset | ||||||||||||||||||||||||||||||
| Dataseries X: | ||||||||||||||||||||||||||||||
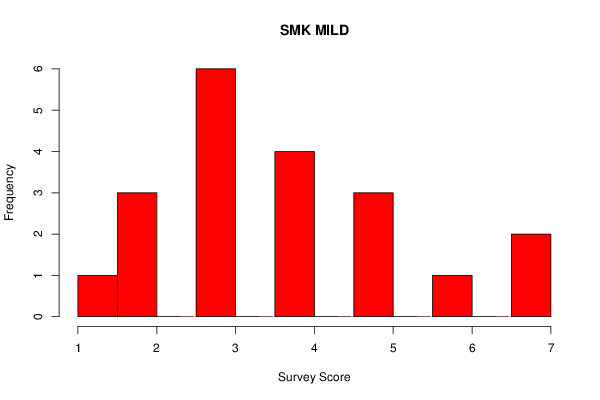
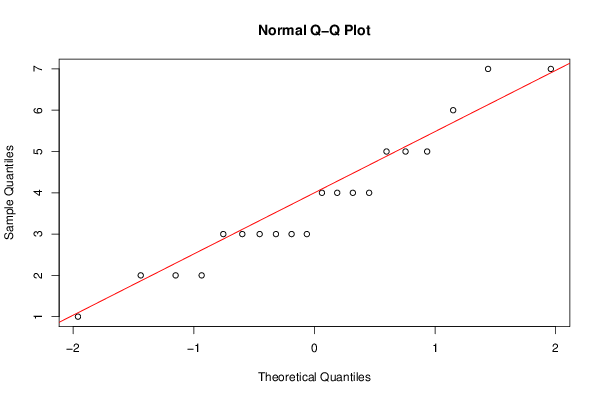
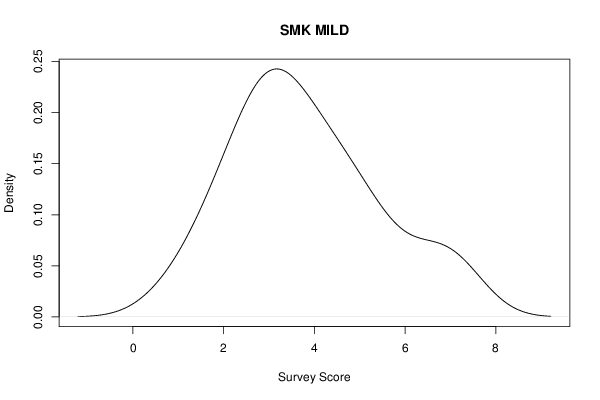
3 5 4 2 7 1 4 4 7 4 3 3 3 3 2 5 5 3 6 2 | ||||||||||||||||||||||||||||||
Tables (Output of Computation) | ||||||||||||||||||||||||||||||
| ||||||||||||||||||||||||||||||
Figures (Output of Computation) | ||||||||||||||||||||||||||||||
Input Parameters & R Code | ||||||||||||||||||||||||||||||
| Parameters (Session): | ||||||||||||||||||||||||||||||
| par1 = 10 ; | ||||||||||||||||||||||||||||||
| Parameters (R input): | ||||||||||||||||||||||||||||||
| par1 = 10 ; | ||||||||||||||||||||||||||||||
| R code (references can be found in the software module): | ||||||||||||||||||||||||||||||
bitmap(file='test1.png') | ||||||||||||||||||||||||||||||