Free Statistics
of Irreproducible Research!
Description of Statistical Computation | ||||||||||||||||||||||||||||||||||
|---|---|---|---|---|---|---|---|---|---|---|---|---|---|---|---|---|---|---|---|---|---|---|---|---|---|---|---|---|---|---|---|---|---|---|
| Author's title | ||||||||||||||||||||||||||||||||||
| Author | *The author of this computation has been verified* | |||||||||||||||||||||||||||||||||
| R Software Module | rwasp_Distributional Plots.wasp | |||||||||||||||||||||||||||||||||
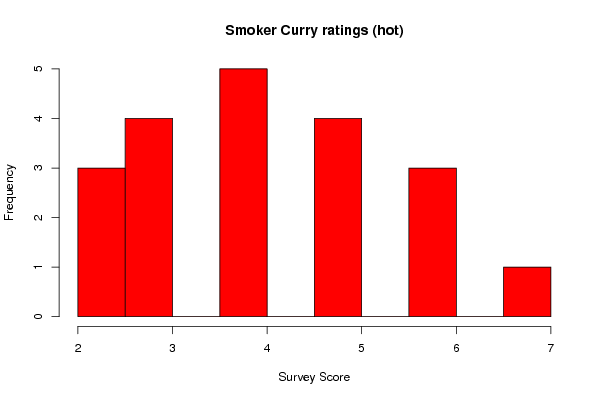
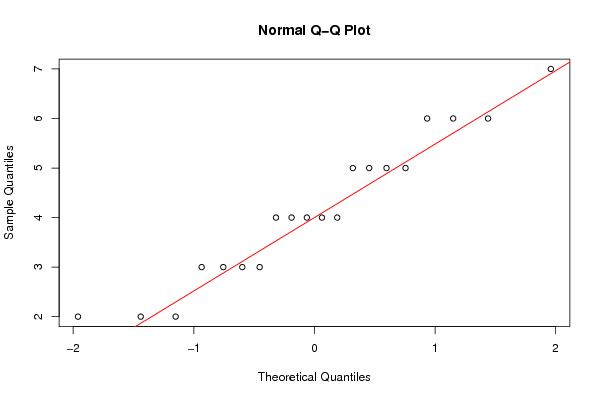
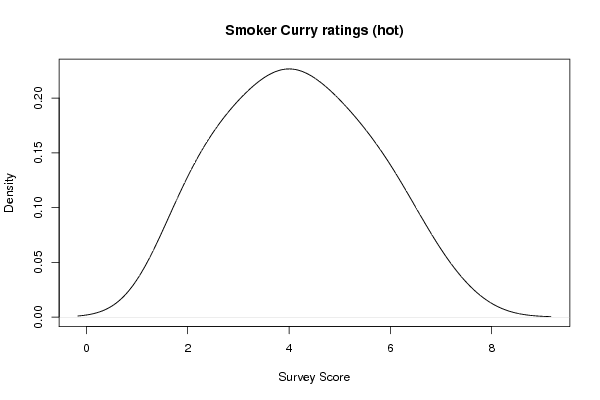
| Title produced by software | Histogram, QQplot and Density | |||||||||||||||||||||||||||||||||
| Date of computation | Fri, 02 Dec 2011 08:55:45 -0500 | |||||||||||||||||||||||||||||||||
| Cite this page as follows | Statistical Computations at FreeStatistics.org, Office for Research Development and Education, URL https://freestatistics.org/blog/index.php?v=date/2011/Dec/02/t1322834245qx40c3posmjnhsu.htm/, Retrieved Thu, 28 May 2026 04:54:16 +0000 | |||||||||||||||||||||||||||||||||
| Statistical Computations at FreeStatistics.org, Office for Research Development and Education, URL https://freestatistics.org/blog/index.php?pk=150202, Retrieved Thu, 28 May 2026 04:54:16 +0000 | ||||||||||||||||||||||||||||||||||
| QR Codes: | ||||||||||||||||||||||||||||||||||
|
| ||||||||||||||||||||||||||||||||||
| Original text written by user: | ||||||||||||||||||||||||||||||||||
| IsPrivate? | No (this computation is public) | |||||||||||||||||||||||||||||||||
| User-defined keywords | ||||||||||||||||||||||||||||||||||
| Estimated Impact | 623 | |||||||||||||||||||||||||||||||||
Tree of Dependent Computations | ||||||||||||||||||||||||||||||||||
| Family? (F = Feedback message, R = changed R code, M = changed R Module, P = changed Parameters, D = changed Data) | ||||||||||||||||||||||||||||||||||
| - [Variability] [Two-Way ANOVA] [2010-11-30 21:42:30] [74be16979710d4c4e7c6647856088456] - RM [Two-Way ANOVA] [Two-Way ANOVA - C...] [2011-11-28 17:22:56] [98fd0e87c3eb04e0cc2efde01dbafab6] - RMPD [Histogram, QQplot and Density] [Smokers curry rat...] [2011-12-02 13:55:45] [0489193fb66908b36c67583df692362d] [Current] - R PD [Histogram, QQplot and Density] [Week 9 Compendium] [2011-12-04 16:28:13] [ed537d185cce52b1ebf7e35bc2be238e] - R [Histogram, QQplot and Density] [Week 9 Compendium] [2011-12-04 16:30:53] [ed537d185cce52b1ebf7e35bc2be238e] - D [Histogram, QQplot and Density] [Week 9 Compendium] [2011-12-04 16:31:45] [ed537d185cce52b1ebf7e35bc2be238e] - D [Histogram, QQplot and Density] [Week 9 Compendium] [2011-12-04 16:32:49] [ed537d185cce52b1ebf7e35bc2be238e] - D [Histogram, QQplot and Density] [Week 9 Compendium] [2011-12-04 16:33:49] [ed537d185cce52b1ebf7e35bc2be238e] - R D [Histogram, QQplot and Density] [Smokers & Hot Vin...] [2011-12-04 17:36:23] [a39d1b5e6e38f353b78ab5534f616c60] - D [Histogram, QQplot and Density] [Smokers & Mild Ko...] [2011-12-04 17:37:56] [a39d1b5e6e38f353b78ab5534f616c60] - D [Histogram, QQplot and Density] [Non-smokers' Rati...] [2011-12-04 17:39:39] [a39d1b5e6e38f353b78ab5534f616c60] - D [Histogram, QQplot and Density] [Non-smokers' Rati...] [2011-12-04 17:40:40] [a39d1b5e6e38f353b78ab5534f616c60] - R D [Histogram, QQplot and Density] [Smokers rating on...] [2011-12-05 21:28:03] [a4caa626434360c3dd87349f301be56d] - [Histogram, QQplot and Density] [Smokers and Korma] [2011-12-06 00:06:14] [a4caa626434360c3dd87349f301be56d] - D [Histogram, QQplot and Density] [] [2013-11-14 11:16:50] [b13e9c596812cd07dfc230f1f052ed59] - D [Histogram, QQplot and Density] [] [2013-11-14 11:18:29] [b13e9c596812cd07dfc230f1f052ed59] - D [Histogram, QQplot and Density] [] [2013-11-14 11:20:32] [b13e9c596812cd07dfc230f1f052ed59] - [Histogram, QQplot and Density] [] [2013-11-14 11:21:44] [b13e9c596812cd07dfc230f1f052ed59] - R D [Histogram, QQplot and Density] [Smokers rating on...] [2011-12-05 21:31:21] [a4caa626434360c3dd87349f301be56d] - D [Histogram, QQplot and Density] [Non- smokers rati...] [2011-12-05 21:33:18] [a4caa626434360c3dd87349f301be56d] - D [Histogram, QQplot and Density] [Non- smokers rati...] [2011-12-05 21:35:36] [a4caa626434360c3dd87349f301be56d] - R D [Histogram, QQplot and Density] [SMKmild] [2011-12-06 10:43:24] [1f171d1ca9c2c46c2a686cab36883fde] - D [Histogram, QQplot and Density] [NShot] [2011-12-06 10:45:37] [1f171d1ca9c2c46c2a686cab36883fde] - D [Histogram, QQplot and Density] [NSmild] [2011-12-06 10:47:23] [1f171d1ca9c2c46c2a686cab36883fde] - D [Histogram, QQplot and Density] [SMKhot] [2011-12-06 10:48:32] [1f171d1ca9c2c46c2a686cab36883fde] - PD [Histogram, QQplot and Density] [blabla] [2011-12-13 08:48:51] [1f171d1ca9c2c46c2a686cab36883fde] - R D [Histogram, QQplot and Density] [Smokers and Vindaloo] [2012-11-08 12:32:26] [2fa93cea200e9bacb3877c86c9d0fffb] - D [Histogram, QQplot and Density] [Smokers and Korma ] [2012-11-08 12:35:27] [2fa93cea200e9bacb3877c86c9d0fffb] - [Histogram, QQplot and Density] [Smokers and Korma] [2012-11-08 19:17:42] [74be16979710d4c4e7c6647856088456] - P [Histogram, QQplot and Density] [Smokers and Korma] [2012-11-08 22:04:36] [74be16979710d4c4e7c6647856088456] - D [Histogram, QQplot and Density] [Non-smokers and V...] [2012-11-08 19:21:36] [74be16979710d4c4e7c6647856088456] - D [Histogram, QQplot and Density] [Non smoker and Korma] [2012-11-08 19:44:01] [74be16979710d4c4e7c6647856088456] - P [Histogram, QQplot and Density] [Non smokers and K...] [2012-11-08 22:07:18] [74be16979710d4c4e7c6647856088456] - P [Histogram, QQplot and Density] [Non smokers and V...] [2012-11-08 22:05:59] [74be16979710d4c4e7c6647856088456] - D [Histogram, QQplot and Density] [Non-smoker and Vi...] [2012-11-08 12:37:27] [2fa93cea200e9bacb3877c86c9d0fffb] - [Histogram, QQplot and Density] [Smokers and Vindaloo] [2012-11-08 12:40:08] [2fa93cea200e9bacb3877c86c9d0fffb] - P [Histogram, QQplot and Density] [Smokers and Vindaloo] [2012-11-08 22:02:47] [74be16979710d4c4e7c6647856088456] - R D [Histogram, QQplot and Density] [Smokers hot] [2012-11-08 12:36:58] [277ccd89405b750edc72f6adfe0fa1ad] - D [Histogram, QQplot and Density] [Smokers mild] [2012-11-08 12:40:09] [277ccd89405b750edc72f6adfe0fa1ad] - D [Histogram, QQplot and Density] [Non smokers] [2012-11-08 12:43:39] [277ccd89405b750edc72f6adfe0fa1ad] - D [Histogram, QQplot and Density] [Non smokers hot] [2012-11-08 12:45:46] [277ccd89405b750edc72f6adfe0fa1ad] - R PD [Histogram, QQplot and Density] [smokers vs. vindaloo] [2012-11-08 12:42:12] [36ef3cf54f2f777c3fca95b182c81ceb] - M [Histogram, QQplot and Density] [Smokers vs. Vindaloo] [2012-11-08 12:43:34] [36ef3cf54f2f777c3fca95b182c81ceb] - D [Histogram, QQplot and Density] [Smokers vs. Korma] [2012-11-08 12:46:35] [36ef3cf54f2f777c3fca95b182c81ceb] - D [Histogram, QQplot and Density] [non-smokers vs. V...] [2012-11-08 12:48:42] [36ef3cf54f2f777c3fca95b182c81ceb] - D [Histogram, QQplot and Density] [non-smokers vs korma] [2012-11-08 12:50:31] [36ef3cf54f2f777c3fca95b182c81ceb] - D [Histogram, QQplot and Density] [non-smokers vs. v...] [2012-11-08 18:53:41] [36ef3cf54f2f777c3fca95b182c81ceb] - R D [Histogram, QQplot and Density] [SMK MILD] [2012-11-08 12:43:00] [d348de2867ebac67b202b75ed3686d34] - D [Histogram, QQplot and Density] [SMK HOT] [2012-11-08 12:45:55] [d348de2867ebac67b202b75ed3686d34] - D [Histogram, QQplot and Density] [NS HOT] [2012-11-08 12:48:46] [d348de2867ebac67b202b75ed3686d34] - D [Histogram, QQplot and Density] [NS MILD] [2012-11-08 12:50:18] [d348de2867ebac67b202b75ed3686d34] [Truncated] | ||||||||||||||||||||||||||||||||||
| Feedback Forum | ||||||||||||||||||||||||||||||||||
Post a new message | ||||||||||||||||||||||||||||||||||
Dataset | ||||||||||||||||||||||||||||||||||
| Dataseries X: | ||||||||||||||||||||||||||||||||||
4 5 3 4 5 3 7 5 6 3 2 4 5 2 3 6 4 4 6 2 | ||||||||||||||||||||||||||||||||||
Tables (Output of Computation) | ||||||||||||||||||||||||||||||||||
| ||||||||||||||||||||||||||||||||||
Figures (Output of Computation) | ||||||||||||||||||||||||||||||||||
Input Parameters & R Code | ||||||||||||||||||||||||||||||||||
| Parameters (Session): | ||||||||||||||||||||||||||||||||||
| par1 = 10 ; | ||||||||||||||||||||||||||||||||||
| Parameters (R input): | ||||||||||||||||||||||||||||||||||
| par1 = 10 ; | ||||||||||||||||||||||||||||||||||
| R code (references can be found in the software module): | ||||||||||||||||||||||||||||||||||
bitmap(file='test1.png') | ||||||||||||||||||||||||||||||||||