Free Statistics
of Irreproducible Research!
Description of Statistical Computation | |||||||||||||||||||||||||||||||||||||||||||||||||||||||||||||||||||||||||||||||||||||||||||||||||||||||||||||||||||||||||||||||||||||||||||||||||||||||||||||||||||||||||||||||||||||||||||||||||||||||||||||||||||||||||||||||||||||||||||||||||||||||||||||||||||||||||||||||||||||
|---|---|---|---|---|---|---|---|---|---|---|---|---|---|---|---|---|---|---|---|---|---|---|---|---|---|---|---|---|---|---|---|---|---|---|---|---|---|---|---|---|---|---|---|---|---|---|---|---|---|---|---|---|---|---|---|---|---|---|---|---|---|---|---|---|---|---|---|---|---|---|---|---|---|---|---|---|---|---|---|---|---|---|---|---|---|---|---|---|---|---|---|---|---|---|---|---|---|---|---|---|---|---|---|---|---|---|---|---|---|---|---|---|---|---|---|---|---|---|---|---|---|---|---|---|---|---|---|---|---|---|---|---|---|---|---|---|---|---|---|---|---|---|---|---|---|---|---|---|---|---|---|---|---|---|---|---|---|---|---|---|---|---|---|---|---|---|---|---|---|---|---|---|---|---|---|---|---|---|---|---|---|---|---|---|---|---|---|---|---|---|---|---|---|---|---|---|---|---|---|---|---|---|---|---|---|---|---|---|---|---|---|---|---|---|---|---|---|---|---|---|---|---|---|---|---|---|---|---|---|---|---|---|---|---|---|---|---|---|---|---|---|---|---|---|---|---|---|---|---|---|---|---|---|---|---|---|---|---|---|---|---|---|---|---|---|---|---|---|---|---|---|---|---|---|---|---|---|
| Author's title | |||||||||||||||||||||||||||||||||||||||||||||||||||||||||||||||||||||||||||||||||||||||||||||||||||||||||||||||||||||||||||||||||||||||||||||||||||||||||||||||||||||||||||||||||||||||||||||||||||||||||||||||||||||||||||||||||||||||||||||||||||||||||||||||||||||||||||||||||||||
| Author | *Unverified author* | ||||||||||||||||||||||||||||||||||||||||||||||||||||||||||||||||||||||||||||||||||||||||||||||||||||||||||||||||||||||||||||||||||||||||||||||||||||||||||||||||||||||||||||||||||||||||||||||||||||||||||||||||||||||||||||||||||||||||||||||||||||||||||||||||||||||||||||||||||||
| R Software Module | Ian.Hollidayrwasp_Two Factor ANOVA -V4.wasp | ||||||||||||||||||||||||||||||||||||||||||||||||||||||||||||||||||||||||||||||||||||||||||||||||||||||||||||||||||||||||||||||||||||||||||||||||||||||||||||||||||||||||||||||||||||||||||||||||||||||||||||||||||||||||||||||||||||||||||||||||||||||||||||||||||||||||||||||||||||
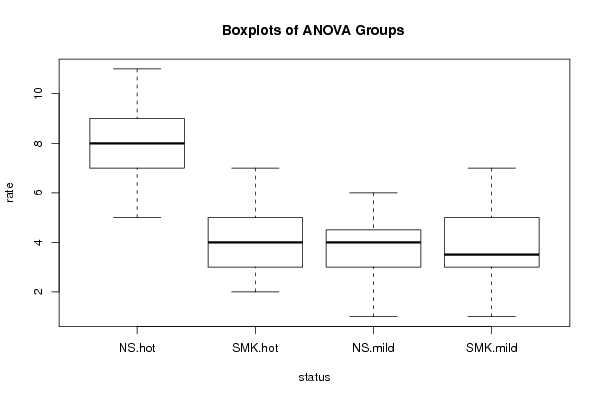
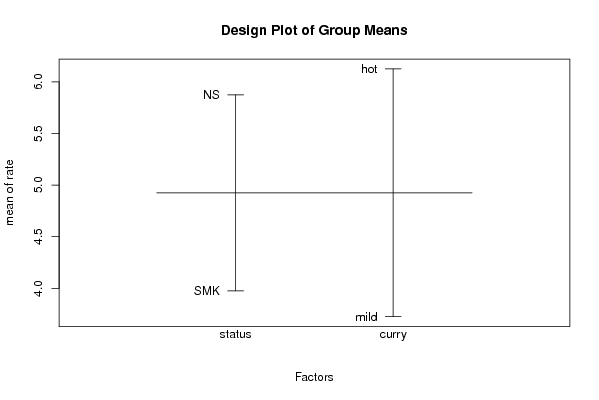
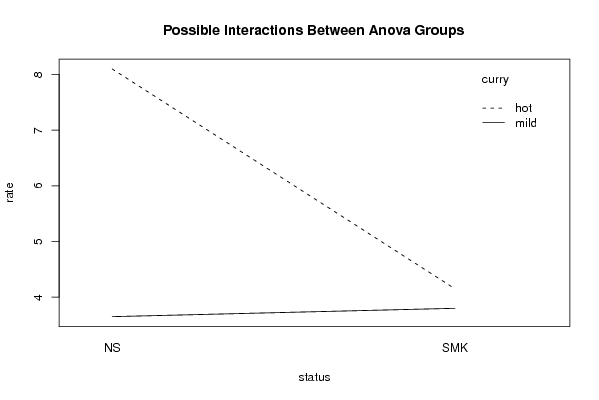
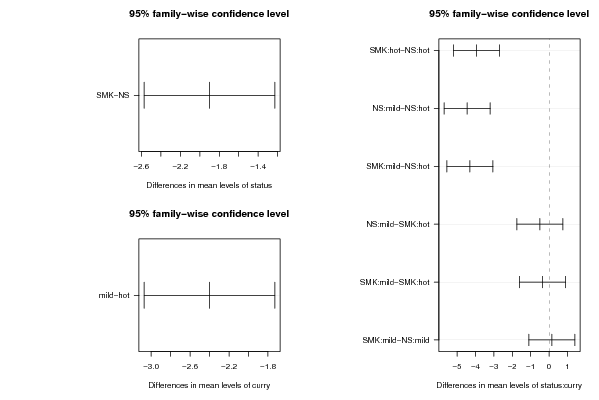
| Title produced by software | Variability | ||||||||||||||||||||||||||||||||||||||||||||||||||||||||||||||||||||||||||||||||||||||||||||||||||||||||||||||||||||||||||||||||||||||||||||||||||||||||||||||||||||||||||||||||||||||||||||||||||||||||||||||||||||||||||||||||||||||||||||||||||||||||||||||||||||||||||||||||||||
| Date of computation | Tue, 30 Nov 2010 21:42:30 +0000 | ||||||||||||||||||||||||||||||||||||||||||||||||||||||||||||||||||||||||||||||||||||||||||||||||||||||||||||||||||||||||||||||||||||||||||||||||||||||||||||||||||||||||||||||||||||||||||||||||||||||||||||||||||||||||||||||||||||||||||||||||||||||||||||||||||||||||||||||||||||
| Cite this page as follows | Statistical Computations at FreeStatistics.org, Office for Research Development and Education, URL https://freestatistics.org/blog/index.php?v=date/2010/Nov/30/t12911536679ryudt026ruityc.htm/, Retrieved Sun, 02 Aug 2026 19:34:58 +0000 | ||||||||||||||||||||||||||||||||||||||||||||||||||||||||||||||||||||||||||||||||||||||||||||||||||||||||||||||||||||||||||||||||||||||||||||||||||||||||||||||||||||||||||||||||||||||||||||||||||||||||||||||||||||||||||||||||||||||||||||||||||||||||||||||||||||||||||||||||||||
| Statistical Computations at FreeStatistics.org, Office for Research Development and Education, URL https://freestatistics.org/blog/index.php?pk=103831, Retrieved Sun, 02 Aug 2026 19:34:58 +0000 | |||||||||||||||||||||||||||||||||||||||||||||||||||||||||||||||||||||||||||||||||||||||||||||||||||||||||||||||||||||||||||||||||||||||||||||||||||||||||||||||||||||||||||||||||||||||||||||||||||||||||||||||||||||||||||||||||||||||||||||||||||||||||||||||||||||||||||||||||||||
| QR Codes: | |||||||||||||||||||||||||||||||||||||||||||||||||||||||||||||||||||||||||||||||||||||||||||||||||||||||||||||||||||||||||||||||||||||||||||||||||||||||||||||||||||||||||||||||||||||||||||||||||||||||||||||||||||||||||||||||||||||||||||||||||||||||||||||||||||||||||||||||||||||
|
| |||||||||||||||||||||||||||||||||||||||||||||||||||||||||||||||||||||||||||||||||||||||||||||||||||||||||||||||||||||||||||||||||||||||||||||||||||||||||||||||||||||||||||||||||||||||||||||||||||||||||||||||||||||||||||||||||||||||||||||||||||||||||||||||||||||||||||||||||||||
| Original text written by user: | |||||||||||||||||||||||||||||||||||||||||||||||||||||||||||||||||||||||||||||||||||||||||||||||||||||||||||||||||||||||||||||||||||||||||||||||||||||||||||||||||||||||||||||||||||||||||||||||||||||||||||||||||||||||||||||||||||||||||||||||||||||||||||||||||||||||||||||||||||||
| IsPrivate? | No (this computation is public) | ||||||||||||||||||||||||||||||||||||||||||||||||||||||||||||||||||||||||||||||||||||||||||||||||||||||||||||||||||||||||||||||||||||||||||||||||||||||||||||||||||||||||||||||||||||||||||||||||||||||||||||||||||||||||||||||||||||||||||||||||||||||||||||||||||||||||||||||||||||
| User-defined keywords | ANOVA, levene's test, Tukey's HSD | ||||||||||||||||||||||||||||||||||||||||||||||||||||||||||||||||||||||||||||||||||||||||||||||||||||||||||||||||||||||||||||||||||||||||||||||||||||||||||||||||||||||||||||||||||||||||||||||||||||||||||||||||||||||||||||||||||||||||||||||||||||||||||||||||||||||||||||||||||||
| Estimated Impact | 956 | ||||||||||||||||||||||||||||||||||||||||||||||||||||||||||||||||||||||||||||||||||||||||||||||||||||||||||||||||||||||||||||||||||||||||||||||||||||||||||||||||||||||||||||||||||||||||||||||||||||||||||||||||||||||||||||||||||||||||||||||||||||||||||||||||||||||||||||||||||||
Tree of Dependent Computations | |||||||||||||||||||||||||||||||||||||||||||||||||||||||||||||||||||||||||||||||||||||||||||||||||||||||||||||||||||||||||||||||||||||||||||||||||||||||||||||||||||||||||||||||||||||||||||||||||||||||||||||||||||||||||||||||||||||||||||||||||||||||||||||||||||||||||||||||||||||
| Family? (F = Feedback message, R = changed R code, M = changed R Module, P = changed Parameters, D = changed Data) | |||||||||||||||||||||||||||||||||||||||||||||||||||||||||||||||||||||||||||||||||||||||||||||||||||||||||||||||||||||||||||||||||||||||||||||||||||||||||||||||||||||||||||||||||||||||||||||||||||||||||||||||||||||||||||||||||||||||||||||||||||||||||||||||||||||||||||||||||||||
| - [Variability] [Two-Way ANOVA] [2010-11-30 21:42:30] [d41d8cd98f00b204e9800998ecf8427e] [Current] - P [Variability] [anova] [2010-12-01 18:26:17] [0f001550dea2fc4fb5273b1f5a571e75] - [Variability] [Anova Boxplot ] [2010-12-02 11:37:34] [3bda7d0113b56426af4979274b798dbe] - [Variability] [original box and ...] [2010-12-02 11:40:37] [404b7cc4dc7a1aee40b74eb017dcd509] - [Variability] [anova test week 9] [2010-12-02 12:27:40] [a88d4f8d31dfea292b0820825eeec6b4] - [Variability] [anova test week 9] [2010-12-02 12:27:40] [a88d4f8d31dfea292b0820825eeec6b4] - [Variability] [anova test week 9] [2010-12-02 12:27:40] [a88d4f8d31dfea292b0820825eeec6b4] - [Variability] [COMPENDIUM 9] [2010-12-02 12:38:22] [2736edfd04acceff7ef750b1b52381c2] - [Variability] [COMPENDIUM 9] [2010-12-02 12:38:22] [2736edfd04acceff7ef750b1b52381c2] - [Variability] [] [2010-12-02 12:42:52] [e41d04f9b27258a4b30e5e5545051fd7] - [Variability] [] [2010-12-02 13:01:42] [74be16979710d4c4e7c6647856088456] - [Variability] [compendium] [2010-12-02 13:20:46] [bbe2ba08a2e1004d231616e60eeea4d7] - [Variability] [anova test of curry] [2010-12-02 13:24:46] [2265fa04dc9037ffed1746190cb362a2] - [Variability] [Week 9 Anova 2] [2010-12-02 13:31:21] [dddf47df3158f3415096d83fcbb31970] - [Variability] [] [2010-12-07 15:57:12] [19600d31edce75009224fbecf9086a65] - [Variability] [] [2010-12-02 14:16:04] [2c73ce1a871fd05a9ff8be670c4acb3a] - [Variability] [9] [2010-12-02 18:42:16] [1a8e34d31778cea87d7e7a201d42c24e] - P [Variability] [2 way anova] [2010-12-02 19:38:44] [74be16979710d4c4e7c6647856088456] - P [Variability] [compendium 9] [2010-12-06 01:33:17] [ea66f500a1c7f64f8e44100d9ad7d0a4] - P [Variability] [] [2010-12-07 12:04:13] [deecdb41704fb2bc07b9b59abf667938] - [Variability] [] [2010-12-02 19:50:07] [5f3db3d90d126a95d54183950148004f] - D [Variability] [] [2010-12-02 21:33:30] [358781f0bd1d7f23f7c8aa2873c865a2] - [Variability] [two way ANOVA] [2010-12-03 09:25:20] [4ff27dd7c583dd02fd8841b940d8c8a4] - RMPD [] [] [-0001-11-30 00:00:00] [74be16979710d4c4e7c6647856088456] - [Variability] [2 way ANOVA curry...] [2010-12-03 12:36:52] [0aad37657179c4ab6867a73eb1b2180e] - [Variability] [Comp 9 2-way ANOV...] [2010-12-03 13:02:33] [b3d3d2a4e3813ea6c4a04808e1fc1271] - [Variability] [Part 2] [2010-12-03 13:33:50] [15d95c9569f1ac5858317a9687e82457] - [Variability] [] [2010-12-03 13:33:52] [74be16979710d4c4e7c6647856088456] - [Variability] [two-way ANOVA spi...] [2010-12-03 14:58:21] [74be16979710d4c4e7c6647856088456] - D [Variability] [W9 Compendium EX 1B] [2010-12-03 16:51:43] [56deace5afbbe22352c3841e29b79134] - D [Variability] [W9 Compendium Ex 1B] [2010-12-03 17:13:14] [56deace5afbbe22352c3841e29b79134] - [Variability] [compendium 9 boxp...] [2010-12-03 17:47:37] [1592300573d920cdca8e2dce0d3bab21] - [Variability] [week 9 compendium...] [2010-12-03 19:13:20] [88bba52b01540967ecde38774018061d] - [Variability] [wek9] [2010-12-07 15:23:50] [74be16979710d4c4e7c6647856088456] - [Variability] [Smoker/Non Smoker...] [2010-12-03 19:16:49] [05f6bac91e3f566f17ccf54f910765b8] - [Variability] [spiciness VS type...] [2010-12-03 22:11:57] [cf42e4b21c34e98ab0a195af47af01df] - [Variability] [my compendium week 9] [2010-12-04 15:00:52] [abe244594d47c647168999d9ae7a699b] - [Variability] [] [2010-12-04 17:09:19] [ae8ba68bb93f8c963c36f4f8ef8e9f76] - [Variability] [Ratings of spicin...] [2010-12-07 15:14:17] [48b6bddf3e494a4ea4b8c9bd6bc25768] - [Variability] [curry anova] [2010-12-04 17:29:15] [05f6bac91e3f566f17ccf54f910765b8] - [Variability] [compendium 9 week ] [2010-12-04 18:43:30] [791b6e9b5b89a59caaa2a08b67d5f6f0] - [Variability] [Two-Way ANOVA] [2010-12-05 18:20:40] [a213e16b9aee3f49d2cb9e790c69a2a0] - R D [Variability] [BPVT & RAD Analysis] [2011-05-27 09:44:51] [f15c1d3d71c6e2d29ae45c04b0ae6886] - R D [Variability] [BPVT and RAD scores] [2011-05-31 09:20:50] [f15c1d3d71c6e2d29ae45c04b0ae6886] - RMPD [] [anova wk09] [-0001-11-30 00:00:00] [920d86197c99e892f7cfc71aadebcde0] - [Variability] [compendium 9] [2010-12-05 23:00:36] [ad05cf1a8cbb8345f8bf2af89f3d97f1] - [Variability] [anova wk09] [2010-12-05 23:37:52] [920d86197c99e892f7cfc71aadebcde0] - [Variability] [anova wk09] [2010-12-05 23:43:41] [920d86197c99e892f7cfc71aadebcde0] - D [Variability] [Smoker/non-smoker...] [2010-12-10 13:36:15] [920d86197c99e892f7cfc71aadebcde0] [Truncated] | |||||||||||||||||||||||||||||||||||||||||||||||||||||||||||||||||||||||||||||||||||||||||||||||||||||||||||||||||||||||||||||||||||||||||||||||||||||||||||||||||||||||||||||||||||||||||||||||||||||||||||||||||||||||||||||||||||||||||||||||||||||||||||||||||||||||||||||||||||||
| Feedback Forum | |||||||||||||||||||||||||||||||||||||||||||||||||||||||||||||||||||||||||||||||||||||||||||||||||||||||||||||||||||||||||||||||||||||||||||||||||||||||||||||||||||||||||||||||||||||||||||||||||||||||||||||||||||||||||||||||||||||||||||||||||||||||||||||||||||||||||||||||||||||
Post a new message | |||||||||||||||||||||||||||||||||||||||||||||||||||||||||||||||||||||||||||||||||||||||||||||||||||||||||||||||||||||||||||||||||||||||||||||||||||||||||||||||||||||||||||||||||||||||||||||||||||||||||||||||||||||||||||||||||||||||||||||||||||||||||||||||||||||||||||||||||||||
Dataset | |||||||||||||||||||||||||||||||||||||||||||||||||||||||||||||||||||||||||||||||||||||||||||||||||||||||||||||||||||||||||||||||||||||||||||||||||||||||||||||||||||||||||||||||||||||||||||||||||||||||||||||||||||||||||||||||||||||||||||||||||||||||||||||||||||||||||||||||||||||
| Dataseries X: | |||||||||||||||||||||||||||||||||||||||||||||||||||||||||||||||||||||||||||||||||||||||||||||||||||||||||||||||||||||||||||||||||||||||||||||||||||||||||||||||||||||||||||||||||||||||||||||||||||||||||||||||||||||||||||||||||||||||||||||||||||||||||||||||||||||||||||||||||||||
4 'SMK' 'hot' 5 'SMK' 'hot' 3 'SMK' 'hot' 4 'SMK' 'hot' 5 'SMK' 'hot' 3 'SMK' 'hot' 7 'SMK' 'hot' 5 'SMK' 'hot' 6 'SMK' 'hot' 3 'SMK' 'hot' 2 'SMK' 'hot' 4 'SMK' 'hot' 5 'SMK' 'hot' 2 'SMK' 'hot' 3 'SMK' 'hot' 6 'SMK' 'hot' 4 'SMK' 'hot' 4 'SMK' 'hot' 6 'SMK' 'hot' 2 'SMK' 'hot' 3 'SMK' 'mild' 5 'SMK' 'mild' 4 'SMK' 'mild' 2 'SMK' 'mild' 7 'SMK' 'mild' 1 'SMK' 'mild' 4 'SMK' 'mild' 4 'SMK' 'mild' 7 'SMK' 'mild' 4 'SMK' 'mild' 3 'SMK' 'mild' 3 'SMK' 'mild' 3 'SMK' 'mild' 3 'SMK' 'mild' 2 'SMK' 'mild' 5 'SMK' 'mild' 5 'SMK' 'mild' 3 'SMK' 'mild' 6 'SMK' 'mild' 2 'SMK' 'mild' 8 'NS' 'hot' 9 'NS' 'hot' 10 'NS' 'hot' 7 'NS' 'hot' 8 'NS' 'hot' 9 'NS' 'hot' 10 'NS' 'hot' 6 'NS' 'hot' 6 'NS' 'hot' 7 'NS' 'hot' 8 'NS' 'hot' 9 'NS' 'hot' 8 'NS' 'hot' 7 'NS' 'hot' 5 'NS' 'hot' 11 'NS' 'hot' 7 'NS' 'hot' 8 'NS' 'hot' 10 'NS' 'hot' 9 'NS' 'hot' 3 'NS' 'mild' 5 'NS' 'mild' 4 'NS' 'mild' 2 'NS' 'mild' 6 'NS' 'mild' 1 'NS' 'mild' 4 'NS' 'mild' 4 'NS' 'mild' 5 'NS' 'mild' 4 'NS' 'mild' 3 'NS' 'mild' 3 'NS' 'mild' 4 'NS' 'mild' 3 'NS' 'mild' 2 'NS' 'mild' 5 'NS' 'mild' 4 'NS' 'mild' 3 'NS' 'mild' 6 'NS' 'mild' 2 'NS' 'mild' | |||||||||||||||||||||||||||||||||||||||||||||||||||||||||||||||||||||||||||||||||||||||||||||||||||||||||||||||||||||||||||||||||||||||||||||||||||||||||||||||||||||||||||||||||||||||||||||||||||||||||||||||||||||||||||||||||||||||||||||||||||||||||||||||||||||||||||||||||||||
Tables (Output of Computation) | |||||||||||||||||||||||||||||||||||||||||||||||||||||||||||||||||||||||||||||||||||||||||||||||||||||||||||||||||||||||||||||||||||||||||||||||||||||||||||||||||||||||||||||||||||||||||||||||||||||||||||||||||||||||||||||||||||||||||||||||||||||||||||||||||||||||||||||||||||||
| |||||||||||||||||||||||||||||||||||||||||||||||||||||||||||||||||||||||||||||||||||||||||||||||||||||||||||||||||||||||||||||||||||||||||||||||||||||||||||||||||||||||||||||||||||||||||||||||||||||||||||||||||||||||||||||||||||||||||||||||||||||||||||||||||||||||||||||||||||||
Figures (Output of Computation) | |||||||||||||||||||||||||||||||||||||||||||||||||||||||||||||||||||||||||||||||||||||||||||||||||||||||||||||||||||||||||||||||||||||||||||||||||||||||||||||||||||||||||||||||||||||||||||||||||||||||||||||||||||||||||||||||||||||||||||||||||||||||||||||||||||||||||||||||||||||
Input Parameters & R Code | |||||||||||||||||||||||||||||||||||||||||||||||||||||||||||||||||||||||||||||||||||||||||||||||||||||||||||||||||||||||||||||||||||||||||||||||||||||||||||||||||||||||||||||||||||||||||||||||||||||||||||||||||||||||||||||||||||||||||||||||||||||||||||||||||||||||||||||||||||||
| Parameters (Session): | |||||||||||||||||||||||||||||||||||||||||||||||||||||||||||||||||||||||||||||||||||||||||||||||||||||||||||||||||||||||||||||||||||||||||||||||||||||||||||||||||||||||||||||||||||||||||||||||||||||||||||||||||||||||||||||||||||||||||||||||||||||||||||||||||||||||||||||||||||||
| par1 = 1 ; par2 = 2 ; par3 = 3 ; par4 = TRUE ; | |||||||||||||||||||||||||||||||||||||||||||||||||||||||||||||||||||||||||||||||||||||||||||||||||||||||||||||||||||||||||||||||||||||||||||||||||||||||||||||||||||||||||||||||||||||||||||||||||||||||||||||||||||||||||||||||||||||||||||||||||||||||||||||||||||||||||||||||||||||
| Parameters (R input): | |||||||||||||||||||||||||||||||||||||||||||||||||||||||||||||||||||||||||||||||||||||||||||||||||||||||||||||||||||||||||||||||||||||||||||||||||||||||||||||||||||||||||||||||||||||||||||||||||||||||||||||||||||||||||||||||||||||||||||||||||||||||||||||||||||||||||||||||||||||
| par1 = 1 ; par2 = 2 ; par3 = 3 ; par4 = TRUE ; | |||||||||||||||||||||||||||||||||||||||||||||||||||||||||||||||||||||||||||||||||||||||||||||||||||||||||||||||||||||||||||||||||||||||||||||||||||||||||||||||||||||||||||||||||||||||||||||||||||||||||||||||||||||||||||||||||||||||||||||||||||||||||||||||||||||||||||||||||||||
| R code (references can be found in the software module): | |||||||||||||||||||||||||||||||||||||||||||||||||||||||||||||||||||||||||||||||||||||||||||||||||||||||||||||||||||||||||||||||||||||||||||||||||||||||||||||||||||||||||||||||||||||||||||||||||||||||||||||||||||||||||||||||||||||||||||||||||||||||||||||||||||||||||||||||||||||
cat1 <- as.numeric(par1) # | |||||||||||||||||||||||||||||||||||||||||||||||||||||||||||||||||||||||||||||||||||||||||||||||||||||||||||||||||||||||||||||||||||||||||||||||||||||||||||||||||||||||||||||||||||||||||||||||||||||||||||||||||||||||||||||||||||||||||||||||||||||||||||||||||||||||||||||||||||||