Free Statistics

of Irreproducible Research!

Author's title

Author*The author of this computation has been verified*
R Software Modulerwasp_multipleregression.wasp
Title produced by softwareMultiple Regression
Date of computationWed, 18 Nov 2009 08:17:01 -0700
Cite this page as followsStatistical Computations at FreeStatistics.org, Office for Research Development and Education, URL https://freestatistics.org/blog/index.php?v=date/2009/Nov/18/t1258557610zrxliislimrjr4j.htm/, Retrieved Wed, 01 May 2024 19:29:11 +0000
Statistical Computations at FreeStatistics.org, Office for Research Development and Education, URL https://freestatistics.org/blog/index.php?pk=57476, Retrieved Wed, 01 May 2024 19:29:11 +0000
QR Codes:

Original text written by user:
IsPrivate?No (this computation is public)
User-defined keywords
Estimated Impact213
Family? (F = Feedback message, R = changed R code, M = changed R Module, P = changed Parameters, D = changed Data)
-     [Multiple Regression] [Q1 The Seatbeltlaw] [2007-11-14 19:27:43] [8cd6641b921d30ebe00b648d1481bba0]
- RM D  [Multiple Regression] [Seatbelt] [2009-11-12 14:10:54] [b98453cac15ba1066b407e146608df68]
-    D    [Multiple Regression] [] [2009-11-18 14:48:54] [ee35698a38947a6c6c039b1e3deafc05]
-    D      [Multiple Regression] [] [2009-11-18 15:05:53] [ee35698a38947a6c6c039b1e3deafc05]
-    D          [Multiple Regression] [] [2009-11-18 15:17:01] [791a4a78a0a7ca497fb8791b982a539e] [Current]
Feedback Forum

Post a new message
Dataseries X:
819.3	31.3	785.8
849.4	30	819.3
880.4	31.3	849.4
900.1	33	880.4
937.2	31.3	900.1
948.9	29	937.2
952.6	28.7	948.9
947.3	28	952.6
974.2	29.7	947.3
1000.8	30.7	974.2
1032.8	24	1000.8
1050.7	29	1032.8
1057.3	33	1050.7
1075.4	28	1057.3
1118.4	28.7	1075.4
1179.8	31.7	1118.4
1227	34	1179.8
1257.8	35.3	1227
1251.5	27	1257.8
1236.3	31.3	1251.5
1170.6	38.7	1236.3
1213.1	37.3	1170.6
1265.5	37.3	1213.1
1300.8	37.7	1265.5
1348.4	34.7	1300.8
1371.9	34.7	1348.4
1403.3	33.7	1371.9
1451.8	38.3	1403.3
1474.2	38	1451.8
1438.2	38.3	1474.2
1513.6	42.7	1438.2
1562.2	41.7	1513.6
1546.2	39.7	1562.2
1527.5	39.3	1546.2
1418.7	39.3	1527.5
1448.5	37.7	1418.7
1492.1	38.3	1448.5
1395.4	37.7	1492.1
1403.7	37	1395.4
1316.6	34.3	1403.7
1274.5	29.7	1316.6
1264.4	34.7	1274.5
1323.9	32	1264.4
1332.1	30.3	1323.9
1250.2	28.3	1332.1
1096.7	31.3	1250.2
1080.8	17.7	1096.7
1039.2	15.7	1080.8
792	14.3	1039.2
746.6	13.3	792
688.8	11	746.6
715.8	2.7	688.8
672.9	3.3	715.8
629.5	3.7	672.9
681.2	1.4	629.5
755.4	7.1	681.2
760.6	8.1	755.4
765.9	12.4	760.6
836.8	12.4	765.9
904.9	9.2	836.8


Summary of computational transaction
Raw Inputview raw input (R code)
Raw Outputview raw output of R engine
Computing time4 seconds
R Server'Gwilym Jenkins' @ 72.249.127.135

\begin{tabular}{lllllllll}
\hline
Summary of computational transaction \tabularnewline
Raw Input & view raw input (R code)  \tabularnewline
Raw Output & view raw output of R engine  \tabularnewline
Computing time & 4 seconds \tabularnewline
R Server & 'Gwilym Jenkins' @ 72.249.127.135 \tabularnewline
\hline
\end{tabular}
%Source: https://freestatistics.org/blog/index.php?pk=57476&T=0

[TABLE]
[ROW][C]Summary of computational transaction[/C][/ROW]
[ROW][C]Raw Input[/C][C]view raw input (R code) [/C][/ROW]
[ROW][C]Raw Output[/C][C]view raw output of R engine [/C][/ROW]
[ROW][C]Computing time[/C][C]4 seconds[/C][/ROW]
[ROW][C]R Server[/C][C]'Gwilym Jenkins' @ 72.249.127.135[/C][/ROW]
[/TABLE]
Source: https://freestatistics.org/blog/index.php?pk=57476&T=0

Globally Unique Identifier (entire table): ba.freestatistics.org/blog/index.php?pk=57476&T=0

As an alternative you can also use a QR Code:  

The GUIDs for individual cells are displayed in the table below:

Summary of computational transaction
Raw Inputview raw input (R code)
Raw Outputview raw output of R engine
Computing time4 seconds
R Server'Gwilym Jenkins' @ 72.249.127.135


Multiple Linear Regression - Estimated Regression Equation
Y[t] = + 92.4076230512834 + 5.41714696378699X[t] + 0.790454329335046Y1[t] -61.837030919492M1[t] -49.7448230196926M2[t] -25.9779829341109M3[t] -19.7830480253596M4[t] -23.1312901068847M5[t] -41.7635956991291M6[t] + 11.7246097530180M7[t] -3.12435921568095M8[t] -54.2119348467759M9[t] -60.7348926951578M10[t] -17.8696049973595M11[t] + 0.709615656970414t + e[t]

\begin{tabular}{lllllllll}
\hline
Multiple Linear Regression - Estimated Regression Equation \tabularnewline
Y[t] =  +  92.4076230512834 +  5.41714696378699X[t] +  0.790454329335046Y1[t] -61.837030919492M1[t] -49.7448230196926M2[t] -25.9779829341109M3[t] -19.7830480253596M4[t] -23.1312901068847M5[t] -41.7635956991291M6[t] +  11.7246097530180M7[t] -3.12435921568095M8[t] -54.2119348467759M9[t] -60.7348926951578M10[t] -17.8696049973595M11[t] +  0.709615656970414t  + e[t] \tabularnewline
\hline
\end{tabular}
%Source: https://freestatistics.org/blog/index.php?pk=57476&T=1

[TABLE]
[ROW][C]Multiple Linear Regression - Estimated Regression Equation[/C][/ROW]
[ROW][C]Y[t] =  +  92.4076230512834 +  5.41714696378699X[t] +  0.790454329335046Y1[t] -61.837030919492M1[t] -49.7448230196926M2[t] -25.9779829341109M3[t] -19.7830480253596M4[t] -23.1312901068847M5[t] -41.7635956991291M6[t] +  11.7246097530180M7[t] -3.12435921568095M8[t] -54.2119348467759M9[t] -60.7348926951578M10[t] -17.8696049973595M11[t] +  0.709615656970414t  + e[t][/C][/ROW]
[/TABLE]
Source: https://freestatistics.org/blog/index.php?pk=57476&T=1

Globally Unique Identifier (entire table): ba.freestatistics.org/blog/index.php?pk=57476&T=1

As an alternative you can also use a QR Code:  

The GUIDs for individual cells are displayed in the table below:

Multiple Linear Regression - Estimated Regression Equation
Y[t] = + 92.4076230512834 + 5.41714696378699X[t] + 0.790454329335046Y1[t] -61.837030919492M1[t] -49.7448230196926M2[t] -25.9779829341109M3[t] -19.7830480253596M4[t] -23.1312901068847M5[t] -41.7635956991291M6[t] + 11.7246097530180M7[t] -3.12435921568095M8[t] -54.2119348467759M9[t] -60.7348926951578M10[t] -17.8696049973595M11[t] + 0.709615656970414t + e[t]


Multiple Linear Regression - Ordinary Least Squares
VariableParameterS.D.T-STATH0: parameter = 02-tail p-value1-tail p-value
(Intercept)92.407623051283443.5388632.12240.039340.01967
X5.417146963786992.3557522.29950.0261680.013084
Y10.7904543293350460.0801689.859900
M1-61.83703091949235.591971-1.73740.089160.04458
M2-49.744823019692635.500603-1.40120.1680020.084001
M3-25.977982934110935.499696-0.73180.4680970.234048
M4-19.783048025359635.409876-0.55870.5791450.289572
M5-23.131290106884735.363891-0.65410.5163810.25819
M6-41.763595699129135.348805-1.18150.2436220.121811
M711.724609753018035.3101670.3320.7413960.370698
M8-3.1243592156809535.259175-0.08860.9297840.464892
M9-54.211934846775935.300485-1.53570.1316070.065804
M10-60.734892695157836.051694-1.68470.0989780.049489
M11-17.869604997359535.221736-0.50730.614390.307195
t0.7096156569704140.8833990.80330.4260360.213018

\begin{tabular}{lllllllll}
\hline
Multiple Linear Regression - Ordinary Least Squares \tabularnewline
Variable & Parameter & S.D. & T-STATH0: parameter = 0 & 2-tail p-value & 1-tail p-value \tabularnewline
(Intercept) & 92.4076230512834 & 43.538863 & 2.1224 & 0.03934 & 0.01967 \tabularnewline
X & 5.41714696378699 & 2.355752 & 2.2995 & 0.026168 & 0.013084 \tabularnewline
Y1 & 0.790454329335046 & 0.080168 & 9.8599 & 0 & 0 \tabularnewline
M1 & -61.837030919492 & 35.591971 & -1.7374 & 0.08916 & 0.04458 \tabularnewline
M2 & -49.7448230196926 & 35.500603 & -1.4012 & 0.168002 & 0.084001 \tabularnewline
M3 & -25.9779829341109 & 35.499696 & -0.7318 & 0.468097 & 0.234048 \tabularnewline
M4 & -19.7830480253596 & 35.409876 & -0.5587 & 0.579145 & 0.289572 \tabularnewline
M5 & -23.1312901068847 & 35.363891 & -0.6541 & 0.516381 & 0.25819 \tabularnewline
M6 & -41.7635956991291 & 35.348805 & -1.1815 & 0.243622 & 0.121811 \tabularnewline
M7 & 11.7246097530180 & 35.310167 & 0.332 & 0.741396 & 0.370698 \tabularnewline
M8 & -3.12435921568095 & 35.259175 & -0.0886 & 0.929784 & 0.464892 \tabularnewline
M9 & -54.2119348467759 & 35.300485 & -1.5357 & 0.131607 & 0.065804 \tabularnewline
M10 & -60.7348926951578 & 36.051694 & -1.6847 & 0.098978 & 0.049489 \tabularnewline
M11 & -17.8696049973595 & 35.221736 & -0.5073 & 0.61439 & 0.307195 \tabularnewline
t & 0.709615656970414 & 0.883399 & 0.8033 & 0.426036 & 0.213018 \tabularnewline
\hline
\end{tabular}
%Source: https://freestatistics.org/blog/index.php?pk=57476&T=2

[TABLE]
[ROW][C]Multiple Linear Regression - Ordinary Least Squares[/C][/ROW]
[ROW][C]Variable[/C][C]Parameter[/C][C]S.D.[/C][C]T-STATH0: parameter = 0[/C][C]2-tail p-value[/C][C]1-tail p-value[/C][/ROW]
[ROW][C](Intercept)[/C][C]92.4076230512834[/C][C]43.538863[/C][C]2.1224[/C][C]0.03934[/C][C]0.01967[/C][/ROW]
[ROW][C]X[/C][C]5.41714696378699[/C][C]2.355752[/C][C]2.2995[/C][C]0.026168[/C][C]0.013084[/C][/ROW]
[ROW][C]Y1[/C][C]0.790454329335046[/C][C]0.080168[/C][C]9.8599[/C][C]0[/C][C]0[/C][/ROW]
[ROW][C]M1[/C][C]-61.837030919492[/C][C]35.591971[/C][C]-1.7374[/C][C]0.08916[/C][C]0.04458[/C][/ROW]
[ROW][C]M2[/C][C]-49.7448230196926[/C][C]35.500603[/C][C]-1.4012[/C][C]0.168002[/C][C]0.084001[/C][/ROW]
[ROW][C]M3[/C][C]-25.9779829341109[/C][C]35.499696[/C][C]-0.7318[/C][C]0.468097[/C][C]0.234048[/C][/ROW]
[ROW][C]M4[/C][C]-19.7830480253596[/C][C]35.409876[/C][C]-0.5587[/C][C]0.579145[/C][C]0.289572[/C][/ROW]
[ROW][C]M5[/C][C]-23.1312901068847[/C][C]35.363891[/C][C]-0.6541[/C][C]0.516381[/C][C]0.25819[/C][/ROW]
[ROW][C]M6[/C][C]-41.7635956991291[/C][C]35.348805[/C][C]-1.1815[/C][C]0.243622[/C][C]0.121811[/C][/ROW]
[ROW][C]M7[/C][C]11.7246097530180[/C][C]35.310167[/C][C]0.332[/C][C]0.741396[/C][C]0.370698[/C][/ROW]
[ROW][C]M8[/C][C]-3.12435921568095[/C][C]35.259175[/C][C]-0.0886[/C][C]0.929784[/C][C]0.464892[/C][/ROW]
[ROW][C]M9[/C][C]-54.2119348467759[/C][C]35.300485[/C][C]-1.5357[/C][C]0.131607[/C][C]0.065804[/C][/ROW]
[ROW][C]M10[/C][C]-60.7348926951578[/C][C]36.051694[/C][C]-1.6847[/C][C]0.098978[/C][C]0.049489[/C][/ROW]
[ROW][C]M11[/C][C]-17.8696049973595[/C][C]35.221736[/C][C]-0.5073[/C][C]0.61439[/C][C]0.307195[/C][/ROW]
[ROW][C]t[/C][C]0.709615656970414[/C][C]0.883399[/C][C]0.8033[/C][C]0.426036[/C][C]0.213018[/C][/ROW]
[/TABLE]
Source: https://freestatistics.org/blog/index.php?pk=57476&T=2

Globally Unique Identifier (entire table): ba.freestatistics.org/blog/index.php?pk=57476&T=2

As an alternative you can also use a QR Code:  

The GUIDs for individual cells are displayed in the table below:

Multiple Linear Regression - Ordinary Least Squares
VariableParameterS.D.T-STATH0: parameter = 02-tail p-value1-tail p-value
(Intercept)92.407623051283443.5388632.12240.039340.01967
X5.417146963786992.3557522.29950.0261680.013084
Y10.7904543293350460.0801689.859900
M1-61.83703091949235.591971-1.73740.089160.04458
M2-49.744823019692635.500603-1.40120.1680020.084001
M3-25.977982934110935.499696-0.73180.4680970.234048
M4-19.783048025359635.409876-0.55870.5791450.289572
M5-23.131290106884735.363891-0.65410.5163810.25819
M6-41.763595699129135.348805-1.18150.2436220.121811
M711.724609753018035.3101670.3320.7413960.370698
M8-3.1243592156809535.259175-0.08860.9297840.464892
M9-54.211934846775935.300485-1.53570.1316070.065804
M10-60.734892695157836.051694-1.68470.0989780.049489
M11-17.869604997359535.221736-0.50730.614390.307195
t0.7096156569704140.8833990.80330.4260360.213018


Multiple Linear Regression - Regression Statistics
Multiple R0.983388137329576
R-squared0.967052228640533
Adjusted R-squared0.956801810884254
F-TEST (value)94.3427137931215
F-TEST (DF numerator)14
F-TEST (DF denominator)45
p-value0
Multiple Linear Regression - Residual Statistics
Residual Standard Deviation55.682735703824
Sum Squared Residuals139525.517495786

\begin{tabular}{lllllllll}
\hline
Multiple Linear Regression - Regression Statistics \tabularnewline
Multiple R & 0.983388137329576 \tabularnewline
R-squared & 0.967052228640533 \tabularnewline
Adjusted R-squared & 0.956801810884254 \tabularnewline
F-TEST (value) & 94.3427137931215 \tabularnewline
F-TEST (DF numerator) & 14 \tabularnewline
F-TEST (DF denominator) & 45 \tabularnewline
p-value & 0 \tabularnewline
Multiple Linear Regression - Residual Statistics \tabularnewline
Residual Standard Deviation & 55.682735703824 \tabularnewline
Sum Squared Residuals & 139525.517495786 \tabularnewline
\hline
\end{tabular}
%Source: https://freestatistics.org/blog/index.php?pk=57476&T=3

[TABLE]
[ROW][C]Multiple Linear Regression - Regression Statistics[/C][/ROW]
[ROW][C]Multiple R[/C][C]0.983388137329576[/C][/ROW]
[ROW][C]R-squared[/C][C]0.967052228640533[/C][/ROW]
[ROW][C]Adjusted R-squared[/C][C]0.956801810884254[/C][/ROW]
[ROW][C]F-TEST (value)[/C][C]94.3427137931215[/C][/ROW]
[ROW][C]F-TEST (DF numerator)[/C][C]14[/C][/ROW]
[ROW][C]F-TEST (DF denominator)[/C][C]45[/C][/ROW]
[ROW][C]p-value[/C][C]0[/C][/ROW]
[ROW][C]Multiple Linear Regression - Residual Statistics[/C][/ROW]
[ROW][C]Residual Standard Deviation[/C][C]55.682735703824[/C][/ROW]
[ROW][C]Sum Squared Residuals[/C][C]139525.517495786[/C][/ROW]
[/TABLE]
Source: https://freestatistics.org/blog/index.php?pk=57476&T=3

Globally Unique Identifier (entire table): ba.freestatistics.org/blog/index.php?pk=57476&T=3

As an alternative you can also use a QR Code:  

The GUIDs for individual cells are displayed in the table below:

Multiple Linear Regression - Regression Statistics
Multiple R0.983388137329576
R-squared0.967052228640533
Adjusted R-squared0.956801810884254
F-TEST (value)94.3427137931215
F-TEST (DF numerator)14
F-TEST (DF denominator)45
p-value0
Multiple Linear Regression - Residual Statistics
Residual Standard Deviation55.682735703824
Sum Squared Residuals139525.517495786


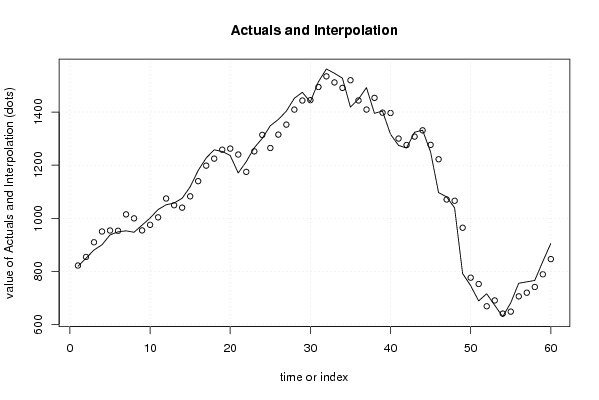
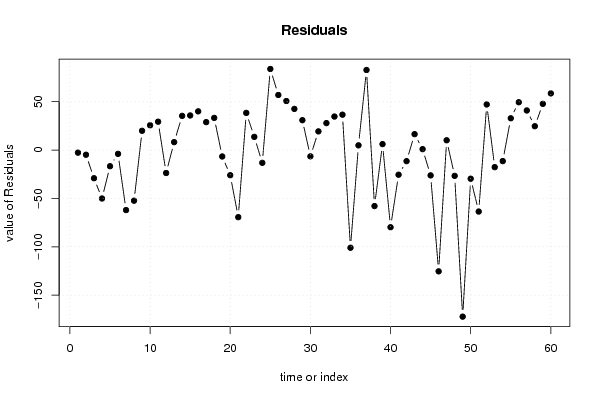
Multiple Linear Regression - Actuals, Interpolation, and Residuals
Time or IndexActualsInterpolationForecastResidualsPrediction Error
1819.3821.975919746773-2.67591974677275
2849.4854.215672283344-4.81567228334418
3880.4909.527094391804-29.1270943918044
4900.1950.14487900535-50.0448790053506
5937.2953.869053030259-16.6690530302585
6948.9952.812780696605-3.91278069660477
7952.61014.63377336981-62.0337733698061
8947.3999.627098201966-52.3270982019664
9974.2954.26888012080419.9311198791961
101000.8975.13590635229225.6640936477077
111032.81003.4420102129.3579897899996
121050.71074.40150422199-23.7015042219866
131057.31049.091809309718.2081906902895
141075.41040.0248966211635.3751033788436
151118.41082.6005785993235.7994214006762
161179.81139.7461062178140.0538937821864
1712271198.1008136311428.8991863688593
181257.81224.5298590934033.2701409065958
191251.51258.11135374661-6.61135374660902
201236.31262.28587010435-25.9858701043538
211170.61239.97989185636-69.3798918563602
221213.11174.6496944783338.4503055216656
231265.51251.8189068298413.6810931701575
241300.81313.98479312684-13.1847931268438
251348.41264.5089747984983.8910252015118
261371.91314.9364244316156.9635755683938
271403.31352.5714099497450.7285900502549
281451.81409.2151024900142.5848975099927
291474.21443.2883669490730.9116330509339
301438.21444.69699808003-6.49699808003346
311513.61494.2739099737519.3260900262478
321562.21534.3176661301027.8823338699012
331546.21511.5214926340834.6785073659163
341527.51490.8940223878036.6059776122033
351418.71519.687429784-100.987429784
361448.51443.597784264624.90221573538222
371492.11409.2761961945582.8238038054471
381395.41453.29154033206-57.8915403320582
391403.71397.539059553266.16094044673937
401316.61396.37808425024-79.7780842502385
411274.51299.97200970718-25.4720097071809
421264.41275.85692732584-11.4569273258365
431323.91307.4448629064516.4551370935548
441332.11331.128392351710.97160764828582
451250.21276.39786395056-26.1978639505628
461096.71222.09775307797-125.397753077972
471080.81070.6647181723110.1352818276917
481039.21065.84142106264-26.6414210626368
49792964.247099950476-172.247099950476
50746.6776.231466331835-29.6314663318349
51688.8752.361857505866-63.561857505866
52715.8668.6158280365947.18417196341
53672.9690.569756682354-17.6697566823538
54629.5640.903434804121-11.4034348041211
55681.2648.33610000338832.8638999966125
56755.4705.94097321186749.4590267881332
57760.6719.6318714381940.9681285618105
58765.9741.22262370360424.6773762963956
59836.8788.98693500384947.8130649961511
60904.9846.27449732391558.6255026760848

\begin{tabular}{lllllllll}
\hline
Multiple Linear Regression - Actuals, Interpolation, and Residuals \tabularnewline
Time or Index & Actuals & InterpolationForecast & ResidualsPrediction Error \tabularnewline
1 & 819.3 & 821.975919746773 & -2.67591974677275 \tabularnewline
2 & 849.4 & 854.215672283344 & -4.81567228334418 \tabularnewline
3 & 880.4 & 909.527094391804 & -29.1270943918044 \tabularnewline
4 & 900.1 & 950.14487900535 & -50.0448790053506 \tabularnewline
5 & 937.2 & 953.869053030259 & -16.6690530302585 \tabularnewline
6 & 948.9 & 952.812780696605 & -3.91278069660477 \tabularnewline
7 & 952.6 & 1014.63377336981 & -62.0337733698061 \tabularnewline
8 & 947.3 & 999.627098201966 & -52.3270982019664 \tabularnewline
9 & 974.2 & 954.268880120804 & 19.9311198791961 \tabularnewline
10 & 1000.8 & 975.135906352292 & 25.6640936477077 \tabularnewline
11 & 1032.8 & 1003.44201021 & 29.3579897899996 \tabularnewline
12 & 1050.7 & 1074.40150422199 & -23.7015042219866 \tabularnewline
13 & 1057.3 & 1049.09180930971 & 8.2081906902895 \tabularnewline
14 & 1075.4 & 1040.02489662116 & 35.3751033788436 \tabularnewline
15 & 1118.4 & 1082.60057859932 & 35.7994214006762 \tabularnewline
16 & 1179.8 & 1139.74610621781 & 40.0538937821864 \tabularnewline
17 & 1227 & 1198.10081363114 & 28.8991863688593 \tabularnewline
18 & 1257.8 & 1224.52985909340 & 33.2701409065958 \tabularnewline
19 & 1251.5 & 1258.11135374661 & -6.61135374660902 \tabularnewline
20 & 1236.3 & 1262.28587010435 & -25.9858701043538 \tabularnewline
21 & 1170.6 & 1239.97989185636 & -69.3798918563602 \tabularnewline
22 & 1213.1 & 1174.64969447833 & 38.4503055216656 \tabularnewline
23 & 1265.5 & 1251.81890682984 & 13.6810931701575 \tabularnewline
24 & 1300.8 & 1313.98479312684 & -13.1847931268438 \tabularnewline
25 & 1348.4 & 1264.50897479849 & 83.8910252015118 \tabularnewline
26 & 1371.9 & 1314.93642443161 & 56.9635755683938 \tabularnewline
27 & 1403.3 & 1352.57140994974 & 50.7285900502549 \tabularnewline
28 & 1451.8 & 1409.21510249001 & 42.5848975099927 \tabularnewline
29 & 1474.2 & 1443.28836694907 & 30.9116330509339 \tabularnewline
30 & 1438.2 & 1444.69699808003 & -6.49699808003346 \tabularnewline
31 & 1513.6 & 1494.27390997375 & 19.3260900262478 \tabularnewline
32 & 1562.2 & 1534.31766613010 & 27.8823338699012 \tabularnewline
33 & 1546.2 & 1511.52149263408 & 34.6785073659163 \tabularnewline
34 & 1527.5 & 1490.89402238780 & 36.6059776122033 \tabularnewline
35 & 1418.7 & 1519.687429784 & -100.987429784 \tabularnewline
36 & 1448.5 & 1443.59778426462 & 4.90221573538222 \tabularnewline
37 & 1492.1 & 1409.27619619455 & 82.8238038054471 \tabularnewline
38 & 1395.4 & 1453.29154033206 & -57.8915403320582 \tabularnewline
39 & 1403.7 & 1397.53905955326 & 6.16094044673937 \tabularnewline
40 & 1316.6 & 1396.37808425024 & -79.7780842502385 \tabularnewline
41 & 1274.5 & 1299.97200970718 & -25.4720097071809 \tabularnewline
42 & 1264.4 & 1275.85692732584 & -11.4569273258365 \tabularnewline
43 & 1323.9 & 1307.44486290645 & 16.4551370935548 \tabularnewline
44 & 1332.1 & 1331.12839235171 & 0.97160764828582 \tabularnewline
45 & 1250.2 & 1276.39786395056 & -26.1978639505628 \tabularnewline
46 & 1096.7 & 1222.09775307797 & -125.397753077972 \tabularnewline
47 & 1080.8 & 1070.66471817231 & 10.1352818276917 \tabularnewline
48 & 1039.2 & 1065.84142106264 & -26.6414210626368 \tabularnewline
49 & 792 & 964.247099950476 & -172.247099950476 \tabularnewline
50 & 746.6 & 776.231466331835 & -29.6314663318349 \tabularnewline
51 & 688.8 & 752.361857505866 & -63.561857505866 \tabularnewline
52 & 715.8 & 668.61582803659 & 47.18417196341 \tabularnewline
53 & 672.9 & 690.569756682354 & -17.6697566823538 \tabularnewline
54 & 629.5 & 640.903434804121 & -11.4034348041211 \tabularnewline
55 & 681.2 & 648.336100003388 & 32.8638999966125 \tabularnewline
56 & 755.4 & 705.940973211867 & 49.4590267881332 \tabularnewline
57 & 760.6 & 719.63187143819 & 40.9681285618105 \tabularnewline
58 & 765.9 & 741.222623703604 & 24.6773762963956 \tabularnewline
59 & 836.8 & 788.986935003849 & 47.8130649961511 \tabularnewline
60 & 904.9 & 846.274497323915 & 58.6255026760848 \tabularnewline
\hline
\end{tabular}
%Source: https://freestatistics.org/blog/index.php?pk=57476&T=4

[TABLE]
[ROW][C]Multiple Linear Regression - Actuals, Interpolation, and Residuals[/C][/ROW]
[ROW][C]Time or Index[/C][C]Actuals[/C][C]InterpolationForecast[/C][C]ResidualsPrediction Error[/C][/ROW]
[ROW][C]1[/C][C]819.3[/C][C]821.975919746773[/C][C]-2.67591974677275[/C][/ROW]
[ROW][C]2[/C][C]849.4[/C][C]854.215672283344[/C][C]-4.81567228334418[/C][/ROW]
[ROW][C]3[/C][C]880.4[/C][C]909.527094391804[/C][C]-29.1270943918044[/C][/ROW]
[ROW][C]4[/C][C]900.1[/C][C]950.14487900535[/C][C]-50.0448790053506[/C][/ROW]
[ROW][C]5[/C][C]937.2[/C][C]953.869053030259[/C][C]-16.6690530302585[/C][/ROW]
[ROW][C]6[/C][C]948.9[/C][C]952.812780696605[/C][C]-3.91278069660477[/C][/ROW]
[ROW][C]7[/C][C]952.6[/C][C]1014.63377336981[/C][C]-62.0337733698061[/C][/ROW]
[ROW][C]8[/C][C]947.3[/C][C]999.627098201966[/C][C]-52.3270982019664[/C][/ROW]
[ROW][C]9[/C][C]974.2[/C][C]954.268880120804[/C][C]19.9311198791961[/C][/ROW]
[ROW][C]10[/C][C]1000.8[/C][C]975.135906352292[/C][C]25.6640936477077[/C][/ROW]
[ROW][C]11[/C][C]1032.8[/C][C]1003.44201021[/C][C]29.3579897899996[/C][/ROW]
[ROW][C]12[/C][C]1050.7[/C][C]1074.40150422199[/C][C]-23.7015042219866[/C][/ROW]
[ROW][C]13[/C][C]1057.3[/C][C]1049.09180930971[/C][C]8.2081906902895[/C][/ROW]
[ROW][C]14[/C][C]1075.4[/C][C]1040.02489662116[/C][C]35.3751033788436[/C][/ROW]
[ROW][C]15[/C][C]1118.4[/C][C]1082.60057859932[/C][C]35.7994214006762[/C][/ROW]
[ROW][C]16[/C][C]1179.8[/C][C]1139.74610621781[/C][C]40.0538937821864[/C][/ROW]
[ROW][C]17[/C][C]1227[/C][C]1198.10081363114[/C][C]28.8991863688593[/C][/ROW]
[ROW][C]18[/C][C]1257.8[/C][C]1224.52985909340[/C][C]33.2701409065958[/C][/ROW]
[ROW][C]19[/C][C]1251.5[/C][C]1258.11135374661[/C][C]-6.61135374660902[/C][/ROW]
[ROW][C]20[/C][C]1236.3[/C][C]1262.28587010435[/C][C]-25.9858701043538[/C][/ROW]
[ROW][C]21[/C][C]1170.6[/C][C]1239.97989185636[/C][C]-69.3798918563602[/C][/ROW]
[ROW][C]22[/C][C]1213.1[/C][C]1174.64969447833[/C][C]38.4503055216656[/C][/ROW]
[ROW][C]23[/C][C]1265.5[/C][C]1251.81890682984[/C][C]13.6810931701575[/C][/ROW]
[ROW][C]24[/C][C]1300.8[/C][C]1313.98479312684[/C][C]-13.1847931268438[/C][/ROW]
[ROW][C]25[/C][C]1348.4[/C][C]1264.50897479849[/C][C]83.8910252015118[/C][/ROW]
[ROW][C]26[/C][C]1371.9[/C][C]1314.93642443161[/C][C]56.9635755683938[/C][/ROW]
[ROW][C]27[/C][C]1403.3[/C][C]1352.57140994974[/C][C]50.7285900502549[/C][/ROW]
[ROW][C]28[/C][C]1451.8[/C][C]1409.21510249001[/C][C]42.5848975099927[/C][/ROW]
[ROW][C]29[/C][C]1474.2[/C][C]1443.28836694907[/C][C]30.9116330509339[/C][/ROW]
[ROW][C]30[/C][C]1438.2[/C][C]1444.69699808003[/C][C]-6.49699808003346[/C][/ROW]
[ROW][C]31[/C][C]1513.6[/C][C]1494.27390997375[/C][C]19.3260900262478[/C][/ROW]
[ROW][C]32[/C][C]1562.2[/C][C]1534.31766613010[/C][C]27.8823338699012[/C][/ROW]
[ROW][C]33[/C][C]1546.2[/C][C]1511.52149263408[/C][C]34.6785073659163[/C][/ROW]
[ROW][C]34[/C][C]1527.5[/C][C]1490.89402238780[/C][C]36.6059776122033[/C][/ROW]
[ROW][C]35[/C][C]1418.7[/C][C]1519.687429784[/C][C]-100.987429784[/C][/ROW]
[ROW][C]36[/C][C]1448.5[/C][C]1443.59778426462[/C][C]4.90221573538222[/C][/ROW]
[ROW][C]37[/C][C]1492.1[/C][C]1409.27619619455[/C][C]82.8238038054471[/C][/ROW]
[ROW][C]38[/C][C]1395.4[/C][C]1453.29154033206[/C][C]-57.8915403320582[/C][/ROW]
[ROW][C]39[/C][C]1403.7[/C][C]1397.53905955326[/C][C]6.16094044673937[/C][/ROW]
[ROW][C]40[/C][C]1316.6[/C][C]1396.37808425024[/C][C]-79.7780842502385[/C][/ROW]
[ROW][C]41[/C][C]1274.5[/C][C]1299.97200970718[/C][C]-25.4720097071809[/C][/ROW]
[ROW][C]42[/C][C]1264.4[/C][C]1275.85692732584[/C][C]-11.4569273258365[/C][/ROW]
[ROW][C]43[/C][C]1323.9[/C][C]1307.44486290645[/C][C]16.4551370935548[/C][/ROW]
[ROW][C]44[/C][C]1332.1[/C][C]1331.12839235171[/C][C]0.97160764828582[/C][/ROW]
[ROW][C]45[/C][C]1250.2[/C][C]1276.39786395056[/C][C]-26.1978639505628[/C][/ROW]
[ROW][C]46[/C][C]1096.7[/C][C]1222.09775307797[/C][C]-125.397753077972[/C][/ROW]
[ROW][C]47[/C][C]1080.8[/C][C]1070.66471817231[/C][C]10.1352818276917[/C][/ROW]
[ROW][C]48[/C][C]1039.2[/C][C]1065.84142106264[/C][C]-26.6414210626368[/C][/ROW]
[ROW][C]49[/C][C]792[/C][C]964.247099950476[/C][C]-172.247099950476[/C][/ROW]
[ROW][C]50[/C][C]746.6[/C][C]776.231466331835[/C][C]-29.6314663318349[/C][/ROW]
[ROW][C]51[/C][C]688.8[/C][C]752.361857505866[/C][C]-63.561857505866[/C][/ROW]
[ROW][C]52[/C][C]715.8[/C][C]668.61582803659[/C][C]47.18417196341[/C][/ROW]
[ROW][C]53[/C][C]672.9[/C][C]690.569756682354[/C][C]-17.6697566823538[/C][/ROW]
[ROW][C]54[/C][C]629.5[/C][C]640.903434804121[/C][C]-11.4034348041211[/C][/ROW]
[ROW][C]55[/C][C]681.2[/C][C]648.336100003388[/C][C]32.8638999966125[/C][/ROW]
[ROW][C]56[/C][C]755.4[/C][C]705.940973211867[/C][C]49.4590267881332[/C][/ROW]
[ROW][C]57[/C][C]760.6[/C][C]719.63187143819[/C][C]40.9681285618105[/C][/ROW]
[ROW][C]58[/C][C]765.9[/C][C]741.222623703604[/C][C]24.6773762963956[/C][/ROW]
[ROW][C]59[/C][C]836.8[/C][C]788.986935003849[/C][C]47.8130649961511[/C][/ROW]
[ROW][C]60[/C][C]904.9[/C][C]846.274497323915[/C][C]58.6255026760848[/C][/ROW]
[/TABLE]
Source: https://freestatistics.org/blog/index.php?pk=57476&T=4

Globally Unique Identifier (entire table): ba.freestatistics.org/blog/index.php?pk=57476&T=4

As an alternative you can also use a QR Code:  

The GUIDs for individual cells are displayed in the table below:

Multiple Linear Regression - Actuals, Interpolation, and Residuals
Time or IndexActualsInterpolationForecastResidualsPrediction Error
1819.3821.975919746773-2.67591974677275
2849.4854.215672283344-4.81567228334418
3880.4909.527094391804-29.1270943918044
4900.1950.14487900535-50.0448790053506
5937.2953.869053030259-16.6690530302585
6948.9952.812780696605-3.91278069660477
7952.61014.63377336981-62.0337733698061
8947.3999.627098201966-52.3270982019664
9974.2954.26888012080419.9311198791961
101000.8975.13590635229225.6640936477077
111032.81003.4420102129.3579897899996
121050.71074.40150422199-23.7015042219866
131057.31049.091809309718.2081906902895
141075.41040.0248966211635.3751033788436
151118.41082.6005785993235.7994214006762
161179.81139.7461062178140.0538937821864
1712271198.1008136311428.8991863688593
181257.81224.5298590934033.2701409065958
191251.51258.11135374661-6.61135374660902
201236.31262.28587010435-25.9858701043538
211170.61239.97989185636-69.3798918563602
221213.11174.6496944783338.4503055216656
231265.51251.8189068298413.6810931701575
241300.81313.98479312684-13.1847931268438
251348.41264.5089747984983.8910252015118
261371.91314.9364244316156.9635755683938
271403.31352.5714099497450.7285900502549
281451.81409.2151024900142.5848975099927
291474.21443.2883669490730.9116330509339
301438.21444.69699808003-6.49699808003346
311513.61494.2739099737519.3260900262478
321562.21534.3176661301027.8823338699012
331546.21511.5214926340834.6785073659163
341527.51490.8940223878036.6059776122033
351418.71519.687429784-100.987429784
361448.51443.597784264624.90221573538222
371492.11409.2761961945582.8238038054471
381395.41453.29154033206-57.8915403320582
391403.71397.539059553266.16094044673937
401316.61396.37808425024-79.7780842502385
411274.51299.97200970718-25.4720097071809
421264.41275.85692732584-11.4569273258365
431323.91307.4448629064516.4551370935548
441332.11331.128392351710.97160764828582
451250.21276.39786395056-26.1978639505628
461096.71222.09775307797-125.397753077972
471080.81070.6647181723110.1352818276917
481039.21065.84142106264-26.6414210626368
49792964.247099950476-172.247099950476
50746.6776.231466331835-29.6314663318349
51688.8752.361857505866-63.561857505866
52715.8668.6158280365947.18417196341
53672.9690.569756682354-17.6697566823538
54629.5640.903434804121-11.4034348041211
55681.2648.33610000338832.8638999966125
56755.4705.94097321186749.4590267881332
57760.6719.6318714381940.9681285618105
58765.9741.22262370360424.6773762963956
59836.8788.98693500384947.8130649961511
60904.9846.27449732391558.6255026760848


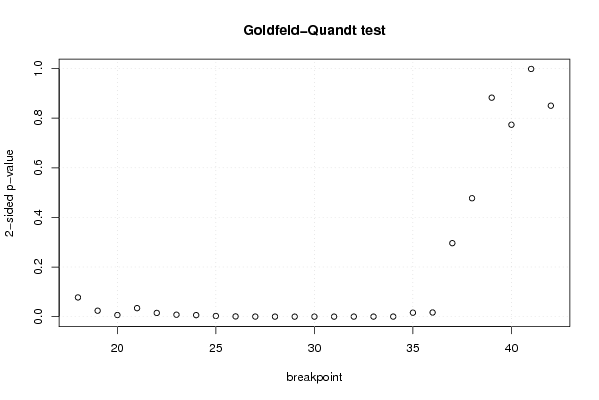
Goldfeld-Quandt test for Heteroskedasticity
p-valuesAlternative Hypothesis
breakpoint indexgreater2-sidedless
180.03876259549780610.07752519099561210.961237404502194
190.01202271147887190.02404542295774380.987977288521128
200.003256050858235010.006512101716470020.996743949141765
210.01717152207582010.03434304415164010.98282847792418
220.007521156220851090.01504231244170220.992478843779149
230.003942941427746680.007885882855493360.996057058572253
240.003084689080719180.006169378161438360.99691531091928
250.001373003286023450.002746006572046900.998626996713976
260.0005035590681110950.001007118136222190.99949644093189
270.0001906342192821380.0003812684385642750.999809365780718
286.38767551873373e-050.0001277535103746750.999936123244813
292.10937169765883e-054.21874339531765e-050.999978906283023
304.19865491984932e-058.39730983969863e-050.999958013450801
316.94907217422868e-050.0001389814434845740.999930509278258
320.0001163434104358340.0002326868208716690.999883656589564
335.60350947121674e-050.0001120701894243350.999943964905288
340.0001541462450937310.0003082924901874630.999845853754906
350.008008854757358360.01601770951471670.991991145242642
360.008407522054489070.01681504410897810.99159247794551
370.1480921653586970.2961843307173940.851907834641303
380.2386776240920110.4773552481840220.761322375907989
390.4412881352254980.8825762704509970.558711864774502
400.6132977504348570.7734044991302860.386702249565143
410.4991356502576850.998271300515370.500864349742315
420.4251111627363330.8502223254726650.574888837263667

\begin{tabular}{lllllllll}
\hline
Goldfeld-Quandt test for Heteroskedasticity \tabularnewline
p-values & Alternative Hypothesis \tabularnewline
breakpoint index & greater & 2-sided & less \tabularnewline
18 & 0.0387625954978061 & 0.0775251909956121 & 0.961237404502194 \tabularnewline
19 & 0.0120227114788719 & 0.0240454229577438 & 0.987977288521128 \tabularnewline
20 & 0.00325605085823501 & 0.00651210171647002 & 0.996743949141765 \tabularnewline
21 & 0.0171715220758201 & 0.0343430441516401 & 0.98282847792418 \tabularnewline
22 & 0.00752115622085109 & 0.0150423124417022 & 0.992478843779149 \tabularnewline
23 & 0.00394294142774668 & 0.00788588285549336 & 0.996057058572253 \tabularnewline
24 & 0.00308468908071918 & 0.00616937816143836 & 0.99691531091928 \tabularnewline
25 & 0.00137300328602345 & 0.00274600657204690 & 0.998626996713976 \tabularnewline
26 & 0.000503559068111095 & 0.00100711813622219 & 0.99949644093189 \tabularnewline
27 & 0.000190634219282138 & 0.000381268438564275 & 0.999809365780718 \tabularnewline
28 & 6.38767551873373e-05 & 0.000127753510374675 & 0.999936123244813 \tabularnewline
29 & 2.10937169765883e-05 & 4.21874339531765e-05 & 0.999978906283023 \tabularnewline
30 & 4.19865491984932e-05 & 8.39730983969863e-05 & 0.999958013450801 \tabularnewline
31 & 6.94907217422868e-05 & 0.000138981443484574 & 0.999930509278258 \tabularnewline
32 & 0.000116343410435834 & 0.000232686820871669 & 0.999883656589564 \tabularnewline
33 & 5.60350947121674e-05 & 0.000112070189424335 & 0.999943964905288 \tabularnewline
34 & 0.000154146245093731 & 0.000308292490187463 & 0.999845853754906 \tabularnewline
35 & 0.00800885475735836 & 0.0160177095147167 & 0.991991145242642 \tabularnewline
36 & 0.00840752205448907 & 0.0168150441089781 & 0.99159247794551 \tabularnewline
37 & 0.148092165358697 & 0.296184330717394 & 0.851907834641303 \tabularnewline
38 & 0.238677624092011 & 0.477355248184022 & 0.761322375907989 \tabularnewline
39 & 0.441288135225498 & 0.882576270450997 & 0.558711864774502 \tabularnewline
40 & 0.613297750434857 & 0.773404499130286 & 0.386702249565143 \tabularnewline
41 & 0.499135650257685 & 0.99827130051537 & 0.500864349742315 \tabularnewline
42 & 0.425111162736333 & 0.850222325472665 & 0.574888837263667 \tabularnewline
\hline
\end{tabular}
%Source: https://freestatistics.org/blog/index.php?pk=57476&T=5

[TABLE]
[ROW][C]Goldfeld-Quandt test for Heteroskedasticity[/C][/ROW]
[ROW][C]p-values[/C][C]Alternative Hypothesis[/C][/ROW]
[ROW][C]breakpoint index[/C][C]greater[/C][C]2-sided[/C][C]less[/C][/ROW]
[ROW][C]18[/C][C]0.0387625954978061[/C][C]0.0775251909956121[/C][C]0.961237404502194[/C][/ROW]
[ROW][C]19[/C][C]0.0120227114788719[/C][C]0.0240454229577438[/C][C]0.987977288521128[/C][/ROW]
[ROW][C]20[/C][C]0.00325605085823501[/C][C]0.00651210171647002[/C][C]0.996743949141765[/C][/ROW]
[ROW][C]21[/C][C]0.0171715220758201[/C][C]0.0343430441516401[/C][C]0.98282847792418[/C][/ROW]
[ROW][C]22[/C][C]0.00752115622085109[/C][C]0.0150423124417022[/C][C]0.992478843779149[/C][/ROW]
[ROW][C]23[/C][C]0.00394294142774668[/C][C]0.00788588285549336[/C][C]0.996057058572253[/C][/ROW]
[ROW][C]24[/C][C]0.00308468908071918[/C][C]0.00616937816143836[/C][C]0.99691531091928[/C][/ROW]
[ROW][C]25[/C][C]0.00137300328602345[/C][C]0.00274600657204690[/C][C]0.998626996713976[/C][/ROW]
[ROW][C]26[/C][C]0.000503559068111095[/C][C]0.00100711813622219[/C][C]0.99949644093189[/C][/ROW]
[ROW][C]27[/C][C]0.000190634219282138[/C][C]0.000381268438564275[/C][C]0.999809365780718[/C][/ROW]
[ROW][C]28[/C][C]6.38767551873373e-05[/C][C]0.000127753510374675[/C][C]0.999936123244813[/C][/ROW]
[ROW][C]29[/C][C]2.10937169765883e-05[/C][C]4.21874339531765e-05[/C][C]0.999978906283023[/C][/ROW]
[ROW][C]30[/C][C]4.19865491984932e-05[/C][C]8.39730983969863e-05[/C][C]0.999958013450801[/C][/ROW]
[ROW][C]31[/C][C]6.94907217422868e-05[/C][C]0.000138981443484574[/C][C]0.999930509278258[/C][/ROW]
[ROW][C]32[/C][C]0.000116343410435834[/C][C]0.000232686820871669[/C][C]0.999883656589564[/C][/ROW]
[ROW][C]33[/C][C]5.60350947121674e-05[/C][C]0.000112070189424335[/C][C]0.999943964905288[/C][/ROW]
[ROW][C]34[/C][C]0.000154146245093731[/C][C]0.000308292490187463[/C][C]0.999845853754906[/C][/ROW]
[ROW][C]35[/C][C]0.00800885475735836[/C][C]0.0160177095147167[/C][C]0.991991145242642[/C][/ROW]
[ROW][C]36[/C][C]0.00840752205448907[/C][C]0.0168150441089781[/C][C]0.99159247794551[/C][/ROW]
[ROW][C]37[/C][C]0.148092165358697[/C][C]0.296184330717394[/C][C]0.851907834641303[/C][/ROW]
[ROW][C]38[/C][C]0.238677624092011[/C][C]0.477355248184022[/C][C]0.761322375907989[/C][/ROW]
[ROW][C]39[/C][C]0.441288135225498[/C][C]0.882576270450997[/C][C]0.558711864774502[/C][/ROW]
[ROW][C]40[/C][C]0.613297750434857[/C][C]0.773404499130286[/C][C]0.386702249565143[/C][/ROW]
[ROW][C]41[/C][C]0.499135650257685[/C][C]0.99827130051537[/C][C]0.500864349742315[/C][/ROW]
[ROW][C]42[/C][C]0.425111162736333[/C][C]0.850222325472665[/C][C]0.574888837263667[/C][/ROW]
[/TABLE]
Source: https://freestatistics.org/blog/index.php?pk=57476&T=5

Globally Unique Identifier (entire table): ba.freestatistics.org/blog/index.php?pk=57476&T=5

As an alternative you can also use a QR Code:  

The GUIDs for individual cells are displayed in the table below:

Goldfeld-Quandt test for Heteroskedasticity
p-valuesAlternative Hypothesis
breakpoint indexgreater2-sidedless
180.03876259549780610.07752519099561210.961237404502194
190.01202271147887190.02404542295774380.987977288521128
200.003256050858235010.006512101716470020.996743949141765
210.01717152207582010.03434304415164010.98282847792418
220.007521156220851090.01504231244170220.992478843779149
230.003942941427746680.007885882855493360.996057058572253
240.003084689080719180.006169378161438360.99691531091928
250.001373003286023450.002746006572046900.998626996713976
260.0005035590681110950.001007118136222190.99949644093189
270.0001906342192821380.0003812684385642750.999809365780718
286.38767551873373e-050.0001277535103746750.999936123244813
292.10937169765883e-054.21874339531765e-050.999978906283023
304.19865491984932e-058.39730983969863e-050.999958013450801
316.94907217422868e-050.0001389814434845740.999930509278258
320.0001163434104358340.0002326868208716690.999883656589564
335.60350947121674e-050.0001120701894243350.999943964905288
340.0001541462450937310.0003082924901874630.999845853754906
350.008008854757358360.01601770951471670.991991145242642
360.008407522054489070.01681504410897810.99159247794551
370.1480921653586970.2961843307173940.851907834641303
380.2386776240920110.4773552481840220.761322375907989
390.4412881352254980.8825762704509970.558711864774502
400.6132977504348570.7734044991302860.386702249565143
410.4991356502576850.998271300515370.500864349742315
420.4251111627363330.8502223254726650.574888837263667


Meta Analysis of Goldfeld-Quandt test for Heteroskedasticity
Description# significant tests% significant testsOK/NOK
1% type I error level130.52NOK
5% type I error level180.72NOK
10% type I error level190.76NOK

\begin{tabular}{lllllllll}
\hline
Meta Analysis of Goldfeld-Quandt test for Heteroskedasticity \tabularnewline
Description & # significant tests & % significant tests & OK/NOK \tabularnewline
1% type I error level & 13 & 0.52 & NOK \tabularnewline
5% type I error level & 18 & 0.72 & NOK \tabularnewline
10% type I error level & 19 & 0.76 & NOK \tabularnewline
\hline
\end{tabular}
%Source: https://freestatistics.org/blog/index.php?pk=57476&T=6

[TABLE]
[ROW][C]Meta Analysis of Goldfeld-Quandt test for Heteroskedasticity[/C][/ROW]
[ROW][C]Description[/C][C]# significant tests[/C][C]% significant tests[/C][C]OK/NOK[/C][/ROW]
[ROW][C]1% type I error level[/C][C]13[/C][C]0.52[/C][C]NOK[/C][/ROW]
[ROW][C]5% type I error level[/C][C]18[/C][C]0.72[/C][C]NOK[/C][/ROW]
[ROW][C]10% type I error level[/C][C]19[/C][C]0.76[/C][C]NOK[/C][/ROW]
[/TABLE]
Source: https://freestatistics.org/blog/index.php?pk=57476&T=6

Globally Unique Identifier (entire table): ba.freestatistics.org/blog/index.php?pk=57476&T=6

As an alternative you can also use a QR Code:  

The GUIDs for individual cells are displayed in the table below:

Meta Analysis of Goldfeld-Quandt test for Heteroskedasticity
Description# significant tests% significant testsOK/NOK
1% type I error level130.52NOK
5% type I error level180.72NOK
10% type I error level190.76NOK


Parameters (Session):
par1 = 1 ; par2 = Include Monthly Dummies ; par3 = Linear Trend ;
Parameters (R input):
par1 = 1 ; par2 = Include Monthly Dummies ; par3 = Linear Trend ;
R code (references can be found in the software module):
library(lattice)
library(lmtest)
n25 <- 25 #minimum number of obs. for Goldfeld-Quandt test
par1 <- as.numeric(par1)
x <- t(y)
k <- length(x[1,])
n <- length(x[,1])
x1 <- cbind(x[,par1], x[,1:k!=par1])
mycolnames <- c(colnames(x)[par1], colnames(x)[1:k!=par1])
colnames(x1) <- mycolnames #colnames(x)[par1]
x <- x1
if (par3 == 'First Differences'){
x2 <- array(0, dim=c(n-1,k), dimnames=list(1:(n-1), paste('(1-B)',colnames(x),sep='')))
for (i in 1:n-1) {
for (j in 1:k) {
x2[i,j] <- x[i+1,j] - x[i,j]
}
}
x <- x2
}
if (par2 == 'Include Monthly Dummies'){
x2 <- array(0, dim=c(n,11), dimnames=list(1:n, paste('M', seq(1:11), sep ='')))
for (i in 1:11){
x2[seq(i,n,12),i] <- 1
}
x <- cbind(x, x2)
}
if (par2 == 'Include Quarterly Dummies'){
x2 <- array(0, dim=c(n,3), dimnames=list(1:n, paste('Q', seq(1:3), sep ='')))
for (i in 1:3){
x2[seq(i,n,4),i] <- 1
}
x <- cbind(x, x2)
}
k <- length(x[1,])
if (par3 == 'Linear Trend'){
x <- cbind(x, c(1:n))
colnames(x)[k+1] <- 't'
}
x
k <- length(x[1,])
df <- as.data.frame(x)
(mylm <- lm(df))
(mysum <- summary(mylm))
if (n > n25) {
kp3 <- k + 3
nmkm3 <- n - k - 3
gqarr <- array(NA, dim=c(nmkm3-kp3+1,3))
numgqtests <- 0
numsignificant1 <- 0
numsignificant5 <- 0
numsignificant10 <- 0
for (mypoint in kp3:nmkm3) {
j <- 0
numgqtests <- numgqtests + 1
for (myalt in c('greater', 'two.sided', 'less')) {
j <- j + 1
gqarr[mypoint-kp3+1,j] <- gqtest(mylm, point=mypoint, alternative=myalt)$p.value
}
if (gqarr[mypoint-kp3+1,2] < 0.01) numsignificant1 <- numsignificant1 + 1
if (gqarr[mypoint-kp3+1,2] < 0.05) numsignificant5 <- numsignificant5 + 1
if (gqarr[mypoint-kp3+1,2] < 0.10) numsignificant10 <- numsignificant10 + 1
}
gqarr
}
bitmap(file='test0.png')
plot(x[,1], type='l', main='Actuals and Interpolation', ylab='value of Actuals and Interpolation (dots)', xlab='time or index')
points(x[,1]-mysum$resid)
grid()
dev.off()
bitmap(file='test1.png')
plot(mysum$resid, type='b', pch=19, main='Residuals', ylab='value of Residuals', xlab='time or index')
grid()
dev.off()
bitmap(file='test2.png')
hist(mysum$resid, main='Residual Histogram', xlab='values of Residuals')
grid()
dev.off()
bitmap(file='test3.png')
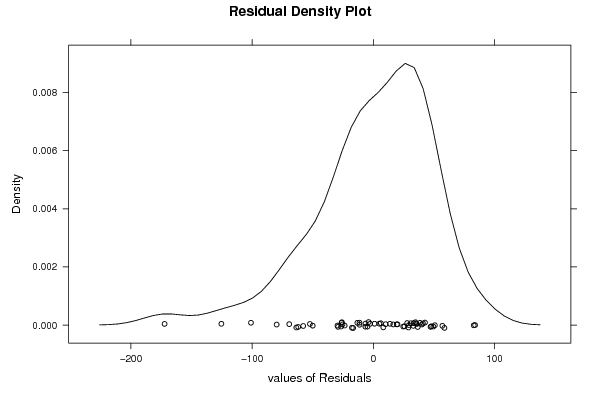
densityplot(~mysum$resid,col='black',main='Residual Density Plot', xlab='values of Residuals')
dev.off()
bitmap(file='test4.png')
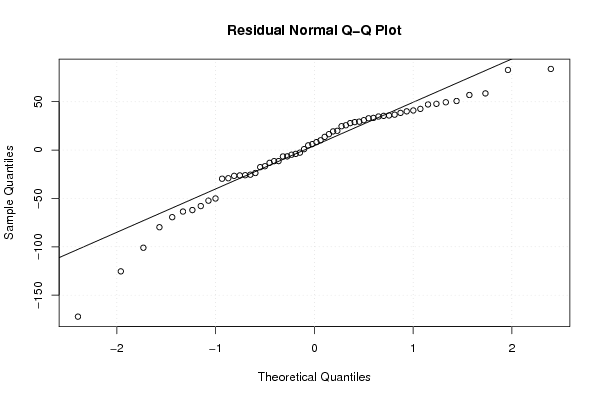
qqnorm(mysum$resid, main='Residual Normal Q-Q Plot')
qqline(mysum$resid)
grid()
dev.off()
(myerror <- as.ts(mysum$resid))
bitmap(file='test5.png')
dum <- cbind(lag(myerror,k=1),myerror)
dum
dum1 <- dum[2:length(myerror),]
dum1
z <- as.data.frame(dum1)
z
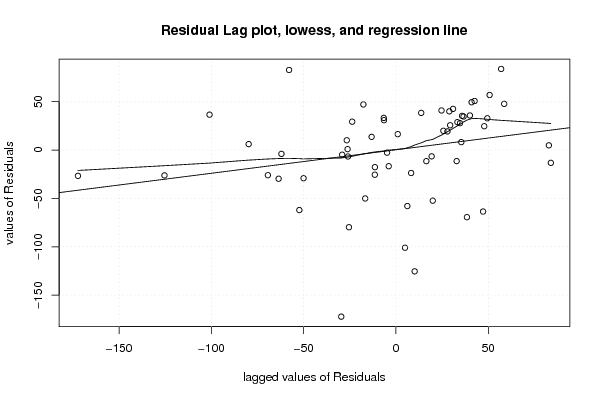
plot(z,main=paste('Residual Lag plot, lowess, and regression line'), ylab='values of Residuals', xlab='lagged values of Residuals')
lines(lowess(z))
abline(lm(z))
grid()
dev.off()
bitmap(file='test6.png')
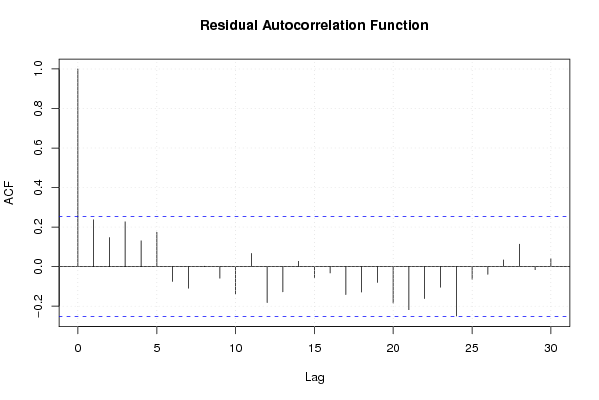
acf(mysum$resid, lag.max=length(mysum$resid)/2, main='Residual Autocorrelation Function')
grid()
dev.off()
bitmap(file='test7.png')
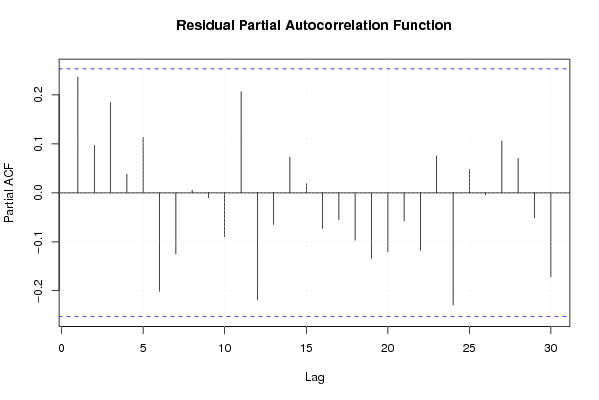
pacf(mysum$resid, lag.max=length(mysum$resid)/2, main='Residual Partial Autocorrelation Function')
grid()
dev.off()
bitmap(file='test8.png')
opar <- par(mfrow = c(2,2), oma = c(0, 0, 1.1, 0))
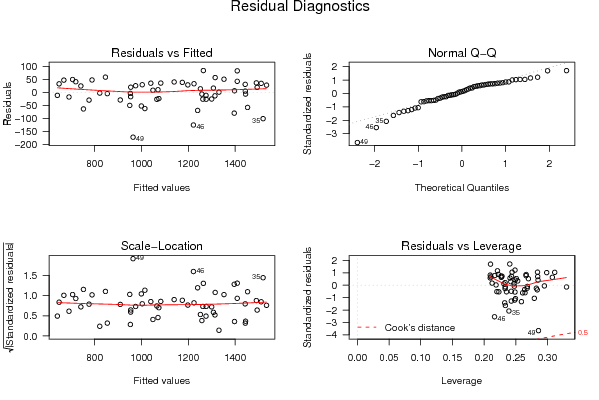
plot(mylm, las = 1, sub='Residual Diagnostics')
par(opar)
dev.off()
if (n > n25) {
bitmap(file='test9.png')
plot(kp3:nmkm3,gqarr[,2], main='Goldfeld-Quandt test',ylab='2-sided p-value',xlab='breakpoint')
grid()
dev.off()
}
load(file='createtable')
a<-table.start()
a<-table.row.start(a)
a<-table.element(a, 'Multiple Linear Regression - Estimated Regression Equation', 1, TRUE)
a<-table.row.end(a)
myeq <- colnames(x)[1]
myeq <- paste(myeq, '[t] = ', sep='')
for (i in 1:k){
if (mysum$coefficients[i,1] > 0) myeq <- paste(myeq, '+', '')
myeq <- paste(myeq, mysum$coefficients[i,1], sep=' ')
if (rownames(mysum$coefficients)[i] != '(Intercept)') {
myeq <- paste(myeq, rownames(mysum$coefficients)[i], sep='')
if (rownames(mysum$coefficients)[i] != 't') myeq <- paste(myeq, '[t]', sep='')
}
}
myeq <- paste(myeq, ' + e[t]')
a<-table.row.start(a)
a<-table.element(a, myeq)
a<-table.row.end(a)
a<-table.end(a)
table.save(a,file='mytable1.tab')
a<-table.start()
a<-table.row.start(a)
a<-table.element(a,hyperlink('ols1.htm','Multiple Linear Regression - Ordinary Least Squares',''), 6, TRUE)
a<-table.row.end(a)
a<-table.row.start(a)
a<-table.element(a,'Variable',header=TRUE)
a<-table.element(a,'Parameter',header=TRUE)
a<-table.element(a,'S.D.',header=TRUE)
a<-table.element(a,'T-STAT
H0: parameter = 0',header=TRUE)
a<-table.element(a,'2-tail p-value',header=TRUE)
a<-table.element(a,'1-tail p-value',header=TRUE)
a<-table.row.end(a)
for (i in 1:k){
a<-table.row.start(a)
a<-table.element(a,rownames(mysum$coefficients)[i],header=TRUE)
a<-table.element(a,mysum$coefficients[i,1])
a<-table.element(a, round(mysum$coefficients[i,2],6))
a<-table.element(a, round(mysum$coefficients[i,3],4))
a<-table.element(a, round(mysum$coefficients[i,4],6))
a<-table.element(a, round(mysum$coefficients[i,4]/2,6))
a<-table.row.end(a)
}
a<-table.end(a)
table.save(a,file='mytable2.tab')
a<-table.start()
a<-table.row.start(a)
a<-table.element(a, 'Multiple Linear Regression - Regression Statistics', 2, TRUE)
a<-table.row.end(a)
a<-table.row.start(a)
a<-table.element(a, 'Multiple R',1,TRUE)
a<-table.element(a, sqrt(mysum$r.squared))
a<-table.row.end(a)
a<-table.row.start(a)
a<-table.element(a, 'R-squared',1,TRUE)
a<-table.element(a, mysum$r.squared)
a<-table.row.end(a)
a<-table.row.start(a)
a<-table.element(a, 'Adjusted R-squared',1,TRUE)
a<-table.element(a, mysum$adj.r.squared)
a<-table.row.end(a)
a<-table.row.start(a)
a<-table.element(a, 'F-TEST (value)',1,TRUE)
a<-table.element(a, mysum$fstatistic[1])
a<-table.row.end(a)
a<-table.row.start(a)
a<-table.element(a, 'F-TEST (DF numerator)',1,TRUE)
a<-table.element(a, mysum$fstatistic[2])
a<-table.row.end(a)
a<-table.row.start(a)
a<-table.element(a, 'F-TEST (DF denominator)',1,TRUE)
a<-table.element(a, mysum$fstatistic[3])
a<-table.row.end(a)
a<-table.row.start(a)
a<-table.element(a, 'p-value',1,TRUE)
a<-table.element(a, 1-pf(mysum$fstatistic[1],mysum$fstatistic[2],mysum$fstatistic[3]))
a<-table.row.end(a)
a<-table.row.start(a)
a<-table.element(a, 'Multiple Linear Regression - Residual Statistics', 2, TRUE)
a<-table.row.end(a)
a<-table.row.start(a)
a<-table.element(a, 'Residual Standard Deviation',1,TRUE)
a<-table.element(a, mysum$sigma)
a<-table.row.end(a)
a<-table.row.start(a)
a<-table.element(a, 'Sum Squared Residuals',1,TRUE)
a<-table.element(a, sum(myerror*myerror))
a<-table.row.end(a)
a<-table.end(a)
table.save(a,file='mytable3.tab')
a<-table.start()
a<-table.row.start(a)
a<-table.element(a, 'Multiple Linear Regression - Actuals, Interpolation, and Residuals', 4, TRUE)
a<-table.row.end(a)
a<-table.row.start(a)
a<-table.element(a, 'Time or Index', 1, TRUE)
a<-table.element(a, 'Actuals', 1, TRUE)
a<-table.element(a, 'Interpolation
Forecast', 1, TRUE)
a<-table.element(a, 'Residuals
Prediction Error', 1, TRUE)
a<-table.row.end(a)
for (i in 1:n) {
a<-table.row.start(a)
a<-table.element(a,i, 1, TRUE)
a<-table.element(a,x[i])
a<-table.element(a,x[i]-mysum$resid[i])
a<-table.element(a,mysum$resid[i])
a<-table.row.end(a)
}
a<-table.end(a)
table.save(a,file='mytable4.tab')
if (n > n25) {
a<-table.start()
a<-table.row.start(a)
a<-table.element(a,'Goldfeld-Quandt test for Heteroskedasticity',4,TRUE)
a<-table.row.end(a)
a<-table.row.start(a)
a<-table.element(a,'p-values',header=TRUE)
a<-table.element(a,'Alternative Hypothesis',3,header=TRUE)
a<-table.row.end(a)
a<-table.row.start(a)
a<-table.element(a,'breakpoint index',header=TRUE)
a<-table.element(a,'greater',header=TRUE)
a<-table.element(a,'2-sided',header=TRUE)
a<-table.element(a,'less',header=TRUE)
a<-table.row.end(a)
for (mypoint in kp3:nmkm3) {
a<-table.row.start(a)
a<-table.element(a,mypoint,header=TRUE)
a<-table.element(a,gqarr[mypoint-kp3+1,1])
a<-table.element(a,gqarr[mypoint-kp3+1,2])
a<-table.element(a,gqarr[mypoint-kp3+1,3])
a<-table.row.end(a)
}
a<-table.end(a)
table.save(a,file='mytable5.tab')
a<-table.start()
a<-table.row.start(a)
a<-table.element(a,'Meta Analysis of Goldfeld-Quandt test for Heteroskedasticity',4,TRUE)
a<-table.row.end(a)
a<-table.row.start(a)
a<-table.element(a,'Description',header=TRUE)
a<-table.element(a,'# significant tests',header=TRUE)
a<-table.element(a,'% significant tests',header=TRUE)
a<-table.element(a,'OK/NOK',header=TRUE)
a<-table.row.end(a)
a<-table.row.start(a)
a<-table.element(a,'1% type I error level',header=TRUE)
a<-table.element(a,numsignificant1)
a<-table.element(a,numsignificant1/numgqtests)
if (numsignificant1/numgqtests < 0.01) dum <- 'OK' else dum <- 'NOK'
a<-table.element(a,dum)
a<-table.row.end(a)
a<-table.row.start(a)
a<-table.element(a,'5% type I error level',header=TRUE)
a<-table.element(a,numsignificant5)
a<-table.element(a,numsignificant5/numgqtests)
if (numsignificant5/numgqtests < 0.05) dum <- 'OK' else dum <- 'NOK'
a<-table.element(a,dum)
a<-table.row.end(a)
a<-table.row.start(a)
a<-table.element(a,'10% type I error level',header=TRUE)
a<-table.element(a,numsignificant10)
a<-table.element(a,numsignificant10/numgqtests)
if (numsignificant10/numgqtests < 0.1) dum <- 'OK' else dum <- 'NOK'
a<-table.element(a,dum)
a<-table.row.end(a)
a<-table.end(a)
table.save(a,file='mytable6.tab')
}