Free Statistics

of Irreproducible Research!

Author's title

Author*The author of this computation has been verified*
R Software Modulerwasp_multipleregression.wasp
Title produced by softwareMultiple Regression
Date of computationWed, 18 Nov 2009 08:05:53 -0700
Cite this page as followsStatistical Computations at FreeStatistics.org, Office for Research Development and Education, URL https://freestatistics.org/blog/index.php?v=date/2009/Nov/18/t1258556839ftp5ey3v9r2zh43.htm/, Retrieved Wed, 01 May 2024 17:17:07 +0000
Statistical Computations at FreeStatistics.org, Office for Research Development and Education, URL https://freestatistics.org/blog/index.php?pk=57471, Retrieved Wed, 01 May 2024 17:17:07 +0000
QR Codes:

Original text written by user:
IsPrivate?No (this computation is public)
User-defined keywords
Estimated Impact209
Family? (F = Feedback message, R = changed R code, M = changed R Module, P = changed Parameters, D = changed Data)
-     [Multiple Regression] [Q1 The Seatbeltlaw] [2007-11-14 19:27:43] [8cd6641b921d30ebe00b648d1481bba0]
- RM D  [Multiple Regression] [Seatbelt] [2009-11-12 14:10:54] [b98453cac15ba1066b407e146608df68]
-    D    [Multiple Regression] [] [2009-11-18 14:48:54] [ee35698a38947a6c6c039b1e3deafc05]
-    D        [Multiple Regression] [] [2009-11-18 15:05:53] [791a4a78a0a7ca497fb8791b982a539e] [Current]
-    D          [Multiple Regression] [] [2009-11-18 15:17:01] [ee35698a38947a6c6c039b1e3deafc05]
Feedback Forum

Post a new message
Dataseries X:
900.1	33	880.4	849.4	819.3	785.8
937.2	31.3	900.1	880.4	849.4	819.3
948.9	29	937.2	900.1	880.4	849.4
952.6	28.7	948.9	937.2	900.1	880.4
947.3	28	952.6	948.9	937.2	900.1
974.2	29.7	947.3	952.6	948.9	937.2
1000.8	30.7	974.2	947.3	952.6	948.9
1032.8	24	1000.8	974.2	947.3	952.6
1050.7	29	1032.8	1000.8	974.2	947.3
1057.3	33	1050.7	1032.8	1000.8	974.2
1075.4	28	1057.3	1050.7	1032.8	1000.8
1118.4	28.7	1075.4	1057.3	1050.7	1032.8
1179.8	31.7	1118.4	1075.4	1057.3	1050.7
1227	34	1179.8	1118.4	1075.4	1057.3
1257.8	35.3	1227	1179.8	1118.4	1075.4
1251.5	27	1257.8	1227	1179.8	1118.4
1236.3	31.3	1251.5	1257.8	1227	1179.8
1170.6	38.7	1236.3	1251.5	1257.8	1227
1213.1	37.3	1170.6	1236.3	1251.5	1257.8
1265.5	37.3	1213.1	1170.6	1236.3	1251.5
1300.8	37.7	1265.5	1213.1	1170.6	1236.3
1348.4	34.7	1300.8	1265.5	1213.1	1170.6
1371.9	34.7	1348.4	1300.8	1265.5	1213.1
1403.3	33.7	1371.9	1348.4	1300.8	1265.5
1451.8	38.3	1403.3	1371.9	1348.4	1300.8
1474.2	38	1451.8	1403.3	1371.9	1348.4
1438.2	38.3	1474.2	1451.8	1403.3	1371.9
1513.6	42.7	1438.2	1474.2	1451.8	1403.3
1562.2	41.7	1513.6	1438.2	1474.2	1451.8
1546.2	39.7	1562.2	1513.6	1438.2	1474.2
1527.5	39.3	1546.2	1562.2	1513.6	1438.2
1418.7	39.3	1527.5	1546.2	1562.2	1513.6
1448.5	37.7	1418.7	1527.5	1546.2	1562.2
1492.1	38.3	1448.5	1418.7	1527.5	1546.2
1395.4	37.7	1492.1	1448.5	1418.7	1527.5
1403.7	37	1395.4	1492.1	1448.5	1418.7
1316.6	34.3	1403.7	1395.4	1492.1	1448.5
1274.5	29.7	1316.6	1403.7	1395.4	1492.1
1264.4	34.7	1274.5	1316.6	1403.7	1395.4
1323.9	32	1264.4	1274.5	1316.6	1403.7
1332.1	30.3	1323.9	1264.4	1274.5	1316.6
1250.2	28.3	1332.1	1323.9	1264.4	1274.5
1096.7	31.3	1250.2	1332.1	1323.9	1264.4
1080.8	17.7	1096.7	1250.2	1332.1	1323.9
1039.2	15.7	1080.8	1096.7	1250.2	1332.1
792	14.3	1039.2	1080.8	1096.7	1250.2
746.6	13.3	792	1039.2	1080.8	1096.7
688.8	11	746.6	792	1039.2	1080.8
715.8	2.7	688.8	746.6	792	1039.2
672.9	3.3	715.8	688.8	746.6	792
629.5	3.7	672.9	715.8	688.8	746.6
681.2	1.4	629.5	672.9	715.8	688.8
755.4	7.1	681.2	629.5	672.9	715.8
760.6	8.1	755.4	681.2	629.5	672.9
765.9	12.4	760.6	755.4	681.2	629.5
836.8	12.4	765.9	760.6	755.4	681.2
904.9	9.2	836.8	765.9	760.6	755.4


Summary of computational transaction
Raw Inputview raw input (R code)
Raw Outputview raw output of R engine
Computing time3 seconds
R Server'Gwilym Jenkins' @ 72.249.127.135

\begin{tabular}{lllllllll}
\hline
Summary of computational transaction \tabularnewline
Raw Input & view raw input (R code)  \tabularnewline
Raw Output & view raw output of R engine  \tabularnewline
Computing time & 3 seconds \tabularnewline
R Server & 'Gwilym Jenkins' @ 72.249.127.135 \tabularnewline
\hline
\end{tabular}
%Source: https://freestatistics.org/blog/index.php?pk=57471&T=0

[TABLE]
[ROW][C]Summary of computational transaction[/C][/ROW]
[ROW][C]Raw Input[/C][C]view raw input (R code) [/C][/ROW]
[ROW][C]Raw Output[/C][C]view raw output of R engine [/C][/ROW]
[ROW][C]Computing time[/C][C]3 seconds[/C][/ROW]
[ROW][C]R Server[/C][C]'Gwilym Jenkins' @ 72.249.127.135[/C][/ROW]
[/TABLE]
Source: https://freestatistics.org/blog/index.php?pk=57471&T=0

Globally Unique Identifier (entire table): ba.freestatistics.org/blog/index.php?pk=57471&T=0

As an alternative you can also use a QR Code:  

The GUIDs for individual cells are displayed in the table below:

Summary of computational transaction
Raw Inputview raw input (R code)
Raw Outputview raw output of R engine
Computing time3 seconds
R Server'Gwilym Jenkins' @ 72.249.127.135


Multiple Linear Regression - Estimated Regression Equation
Y[t] = + 89.7311676142938 + 6.0227316227574X[t] + 1.03930927110254Y1[t] -0.149311449946610Y2[t] -0.0396953938960989Y3[t] -0.094152509972795Y4[t] -9.91198743304521M1[t] -18.0063243920921M2[t] -37.757433211208M3[t] + 20.7736076777111M4[t] -4.61820414700779M5[t] -57.0772202441823M6[t] -54.6300927530562M7[t] -4.68641875812672M8[t] + 9.28292783233514M9[t] -50.7958567312177M10[t] -29.8191819838307M11[t] + 1.37269517473825t + e[t]

\begin{tabular}{lllllllll}
\hline
Multiple Linear Regression - Estimated Regression Equation \tabularnewline
Y[t] =  +  89.7311676142938 +  6.0227316227574X[t] +  1.03930927110254Y1[t] -0.149311449946610Y2[t] -0.0396953938960989Y3[t] -0.094152509972795Y4[t] -9.91198743304521M1[t] -18.0063243920921M2[t] -37.757433211208M3[t] +  20.7736076777111M4[t] -4.61820414700779M5[t] -57.0772202441823M6[t] -54.6300927530562M7[t] -4.68641875812672M8[t] +  9.28292783233514M9[t] -50.7958567312177M10[t] -29.8191819838307M11[t] +  1.37269517473825t  + e[t] \tabularnewline
\hline
\end{tabular}
%Source: https://freestatistics.org/blog/index.php?pk=57471&T=1

[TABLE]
[ROW][C]Multiple Linear Regression - Estimated Regression Equation[/C][/ROW]
[ROW][C]Y[t] =  +  89.7311676142938 +  6.0227316227574X[t] +  1.03930927110254Y1[t] -0.149311449946610Y2[t] -0.0396953938960989Y3[t] -0.094152509972795Y4[t] -9.91198743304521M1[t] -18.0063243920921M2[t] -37.757433211208M3[t] +  20.7736076777111M4[t] -4.61820414700779M5[t] -57.0772202441823M6[t] -54.6300927530562M7[t] -4.68641875812672M8[t] +  9.28292783233514M9[t] -50.7958567312177M10[t] -29.8191819838307M11[t] +  1.37269517473825t  + e[t][/C][/ROW]
[/TABLE]
Source: https://freestatistics.org/blog/index.php?pk=57471&T=1

Globally Unique Identifier (entire table): ba.freestatistics.org/blog/index.php?pk=57471&T=1

As an alternative you can also use a QR Code:  

The GUIDs for individual cells are displayed in the table below:

Multiple Linear Regression - Estimated Regression Equation
Y[t] = + 89.7311676142938 + 6.0227316227574X[t] + 1.03930927110254Y1[t] -0.149311449946610Y2[t] -0.0396953938960989Y3[t] -0.094152509972795Y4[t] -9.91198743304521M1[t] -18.0063243920921M2[t] -37.757433211208M3[t] + 20.7736076777111M4[t] -4.61820414700779M5[t] -57.0772202441823M6[t] -54.6300927530562M7[t] -4.68641875812672M8[t] + 9.28292783233514M9[t] -50.7958567312177M10[t] -29.8191819838307M11[t] + 1.37269517473825t + e[t]


Multiple Linear Regression - Ordinary Least Squares
VariableParameterS.D.T-STATH0: parameter = 02-tail p-value1-tail p-value
(Intercept)89.731167614293847.4580481.89070.0661040.033052
X6.02273162275742.5143882.39530.0215050.010753
Y11.039309271102540.1661096.256800
Y2-0.1493114499466100.234821-0.63590.5285870.264293
Y3-0.03969539389609890.242334-0.16380.8707310.435365
Y4-0.0941525099727950.156609-0.60120.5511890.275595
M1-9.9119874330452138.075056-0.26030.7959810.39799
M2-18.006324392092138.214605-0.47120.6401310.320065
M3-37.75743321120837.886248-0.99660.3251020.162551
M420.773607677711137.4509270.55470.5822750.291137
M5-4.6182041470077938.048225-0.12140.9040150.452008
M6-57.077220244182339.347995-1.45060.1548940.077447
M7-54.630092753056239.056067-1.39880.1697870.084894
M8-4.6864187581267237.051435-0.12650.8999990.449999
M99.2829278323351437.804290.24560.8073170.403658
M10-50.795856731217739.986767-1.27030.2114980.105749
M11-29.819181983830739.950948-0.74640.4599050.229952
t1.372695174738250.9238161.48590.1453460.072673

\begin{tabular}{lllllllll}
\hline
Multiple Linear Regression - Ordinary Least Squares \tabularnewline
Variable & Parameter & S.D. & T-STATH0: parameter = 0 & 2-tail p-value & 1-tail p-value \tabularnewline
(Intercept) & 89.7311676142938 & 47.458048 & 1.8907 & 0.066104 & 0.033052 \tabularnewline
X & 6.0227316227574 & 2.514388 & 2.3953 & 0.021505 & 0.010753 \tabularnewline
Y1 & 1.03930927110254 & 0.166109 & 6.2568 & 0 & 0 \tabularnewline
Y2 & -0.149311449946610 & 0.234821 & -0.6359 & 0.528587 & 0.264293 \tabularnewline
Y3 & -0.0396953938960989 & 0.242334 & -0.1638 & 0.870731 & 0.435365 \tabularnewline
Y4 & -0.094152509972795 & 0.156609 & -0.6012 & 0.551189 & 0.275595 \tabularnewline
M1 & -9.91198743304521 & 38.075056 & -0.2603 & 0.795981 & 0.39799 \tabularnewline
M2 & -18.0063243920921 & 38.214605 & -0.4712 & 0.640131 & 0.320065 \tabularnewline
M3 & -37.757433211208 & 37.886248 & -0.9966 & 0.325102 & 0.162551 \tabularnewline
M4 & 20.7736076777111 & 37.450927 & 0.5547 & 0.582275 & 0.291137 \tabularnewline
M5 & -4.61820414700779 & 38.048225 & -0.1214 & 0.904015 & 0.452008 \tabularnewline
M6 & -57.0772202441823 & 39.347995 & -1.4506 & 0.154894 & 0.077447 \tabularnewline
M7 & -54.6300927530562 & 39.056067 & -1.3988 & 0.169787 & 0.084894 \tabularnewline
M8 & -4.68641875812672 & 37.051435 & -0.1265 & 0.899999 & 0.449999 \tabularnewline
M9 & 9.28292783233514 & 37.80429 & 0.2456 & 0.807317 & 0.403658 \tabularnewline
M10 & -50.7958567312177 & 39.986767 & -1.2703 & 0.211498 & 0.105749 \tabularnewline
M11 & -29.8191819838307 & 39.950948 & -0.7464 & 0.459905 & 0.229952 \tabularnewline
t & 1.37269517473825 & 0.923816 & 1.4859 & 0.145346 & 0.072673 \tabularnewline
\hline
\end{tabular}
%Source: https://freestatistics.org/blog/index.php?pk=57471&T=2

[TABLE]
[ROW][C]Multiple Linear Regression - Ordinary Least Squares[/C][/ROW]
[ROW][C]Variable[/C][C]Parameter[/C][C]S.D.[/C][C]T-STATH0: parameter = 0[/C][C]2-tail p-value[/C][C]1-tail p-value[/C][/ROW]
[ROW][C](Intercept)[/C][C]89.7311676142938[/C][C]47.458048[/C][C]1.8907[/C][C]0.066104[/C][C]0.033052[/C][/ROW]
[ROW][C]X[/C][C]6.0227316227574[/C][C]2.514388[/C][C]2.3953[/C][C]0.021505[/C][C]0.010753[/C][/ROW]
[ROW][C]Y1[/C][C]1.03930927110254[/C][C]0.166109[/C][C]6.2568[/C][C]0[/C][C]0[/C][/ROW]
[ROW][C]Y2[/C][C]-0.149311449946610[/C][C]0.234821[/C][C]-0.6359[/C][C]0.528587[/C][C]0.264293[/C][/ROW]
[ROW][C]Y3[/C][C]-0.0396953938960989[/C][C]0.242334[/C][C]-0.1638[/C][C]0.870731[/C][C]0.435365[/C][/ROW]
[ROW][C]Y4[/C][C]-0.094152509972795[/C][C]0.156609[/C][C]-0.6012[/C][C]0.551189[/C][C]0.275595[/C][/ROW]
[ROW][C]M1[/C][C]-9.91198743304521[/C][C]38.075056[/C][C]-0.2603[/C][C]0.795981[/C][C]0.39799[/C][/ROW]
[ROW][C]M2[/C][C]-18.0063243920921[/C][C]38.214605[/C][C]-0.4712[/C][C]0.640131[/C][C]0.320065[/C][/ROW]
[ROW][C]M3[/C][C]-37.757433211208[/C][C]37.886248[/C][C]-0.9966[/C][C]0.325102[/C][C]0.162551[/C][/ROW]
[ROW][C]M4[/C][C]20.7736076777111[/C][C]37.450927[/C][C]0.5547[/C][C]0.582275[/C][C]0.291137[/C][/ROW]
[ROW][C]M5[/C][C]-4.61820414700779[/C][C]38.048225[/C][C]-0.1214[/C][C]0.904015[/C][C]0.452008[/C][/ROW]
[ROW][C]M6[/C][C]-57.0772202441823[/C][C]39.347995[/C][C]-1.4506[/C][C]0.154894[/C][C]0.077447[/C][/ROW]
[ROW][C]M7[/C][C]-54.6300927530562[/C][C]39.056067[/C][C]-1.3988[/C][C]0.169787[/C][C]0.084894[/C][/ROW]
[ROW][C]M8[/C][C]-4.68641875812672[/C][C]37.051435[/C][C]-0.1265[/C][C]0.899999[/C][C]0.449999[/C][/ROW]
[ROW][C]M9[/C][C]9.28292783233514[/C][C]37.80429[/C][C]0.2456[/C][C]0.807317[/C][C]0.403658[/C][/ROW]
[ROW][C]M10[/C][C]-50.7958567312177[/C][C]39.986767[/C][C]-1.2703[/C][C]0.211498[/C][C]0.105749[/C][/ROW]
[ROW][C]M11[/C][C]-29.8191819838307[/C][C]39.950948[/C][C]-0.7464[/C][C]0.459905[/C][C]0.229952[/C][/ROW]
[ROW][C]t[/C][C]1.37269517473825[/C][C]0.923816[/C][C]1.4859[/C][C]0.145346[/C][C]0.072673[/C][/ROW]
[/TABLE]
Source: https://freestatistics.org/blog/index.php?pk=57471&T=2

Globally Unique Identifier (entire table): ba.freestatistics.org/blog/index.php?pk=57471&T=2

As an alternative you can also use a QR Code:  

The GUIDs for individual cells are displayed in the table below:

Multiple Linear Regression - Ordinary Least Squares
VariableParameterS.D.T-STATH0: parameter = 02-tail p-value1-tail p-value
(Intercept)89.731167614293847.4580481.89070.0661040.033052
X6.02273162275742.5143882.39530.0215050.010753
Y11.039309271102540.1661096.256800
Y2-0.1493114499466100.234821-0.63590.5285870.264293
Y3-0.03969539389609890.242334-0.16380.8707310.435365
Y4-0.0941525099727950.156609-0.60120.5511890.275595
M1-9.9119874330452138.075056-0.26030.7959810.39799
M2-18.006324392092138.214605-0.47120.6401310.320065
M3-37.75743321120837.886248-0.99660.3251020.162551
M420.773607677711137.4509270.55470.5822750.291137
M5-4.6182041470077938.048225-0.12140.9040150.452008
M6-57.077220244182339.347995-1.45060.1548940.077447
M7-54.630092753056239.056067-1.39880.1697870.084894
M8-4.6864187581267237.051435-0.12650.8999990.449999
M99.2829278323351437.804290.24560.8073170.403658
M10-50.795856731217739.986767-1.27030.2114980.105749
M11-29.819181983830739.950948-0.74640.4599050.229952
t1.372695174738250.9238161.48590.1453460.072673


Multiple Linear Regression - Regression Statistics
Multiple R0.985107834520052
R-squared0.970437445632787
Adjusted R-squared0.95755120398554
F-TEST (value)75.3080279105372
F-TEST (DF numerator)17
F-TEST (DF denominator)39
p-value0
Multiple Linear Regression - Residual Statistics
Residual Standard Deviation55.0451702605518
Sum Squared Residuals118168.859991512

\begin{tabular}{lllllllll}
\hline
Multiple Linear Regression - Regression Statistics \tabularnewline
Multiple R & 0.985107834520052 \tabularnewline
R-squared & 0.970437445632787 \tabularnewline
Adjusted R-squared & 0.95755120398554 \tabularnewline
F-TEST (value) & 75.3080279105372 \tabularnewline
F-TEST (DF numerator) & 17 \tabularnewline
F-TEST (DF denominator) & 39 \tabularnewline
p-value & 0 \tabularnewline
Multiple Linear Regression - Residual Statistics \tabularnewline
Residual Standard Deviation & 55.0451702605518 \tabularnewline
Sum Squared Residuals & 118168.859991512 \tabularnewline
\hline
\end{tabular}
%Source: https://freestatistics.org/blog/index.php?pk=57471&T=3

[TABLE]
[ROW][C]Multiple Linear Regression - Regression Statistics[/C][/ROW]
[ROW][C]Multiple R[/C][C]0.985107834520052[/C][/ROW]
[ROW][C]R-squared[/C][C]0.970437445632787[/C][/ROW]
[ROW][C]Adjusted R-squared[/C][C]0.95755120398554[/C][/ROW]
[ROW][C]F-TEST (value)[/C][C]75.3080279105372[/C][/ROW]
[ROW][C]F-TEST (DF numerator)[/C][C]17[/C][/ROW]
[ROW][C]F-TEST (DF denominator)[/C][C]39[/C][/ROW]
[ROW][C]p-value[/C][C]0[/C][/ROW]
[ROW][C]Multiple Linear Regression - Residual Statistics[/C][/ROW]
[ROW][C]Residual Standard Deviation[/C][C]55.0451702605518[/C][/ROW]
[ROW][C]Sum Squared Residuals[/C][C]118168.859991512[/C][/ROW]
[/TABLE]
Source: https://freestatistics.org/blog/index.php?pk=57471&T=3

Globally Unique Identifier (entire table): ba.freestatistics.org/blog/index.php?pk=57471&T=3

As an alternative you can also use a QR Code:  

The GUIDs for individual cells are displayed in the table below:

Multiple Linear Regression - Regression Statistics
Multiple R0.985107834520052
R-squared0.970437445632787
Adjusted R-squared0.95755120398554
F-TEST (value)75.3080279105372
F-TEST (DF numerator)17
F-TEST (DF denominator)39
p-value0
Multiple Linear Regression - Residual Statistics
Residual Standard Deviation55.0451702605518
Sum Squared Residuals118168.859991512


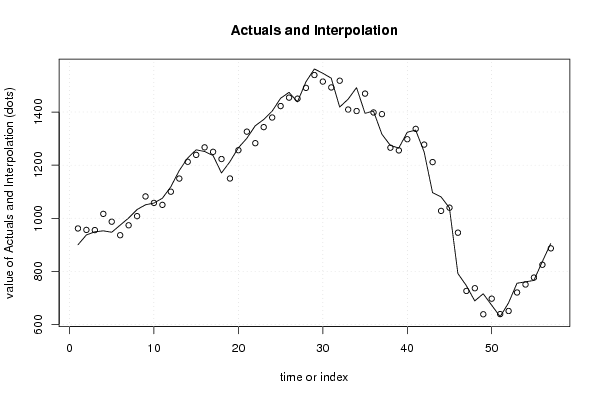
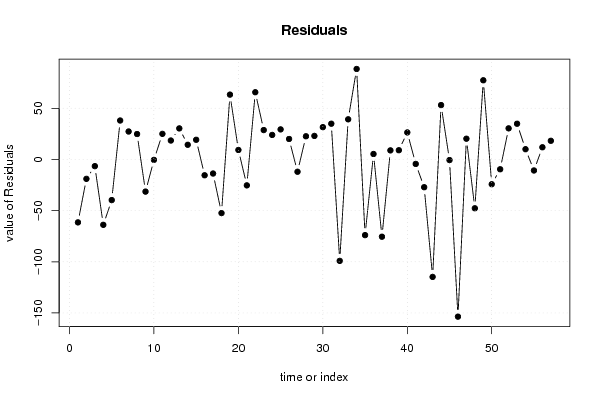
Multiple Linear Regression - Actuals, Interpolation, and Residuals
Time or IndexActualsInterpolationForecastResidualsPrediction Error
1900.1961.617277045312-61.517277045312
2937.2956.153788754332-18.9537887543321
3948.9955.475483010608-6.57548301060806
4952.61016.49213619741-63.8921361974092
5947.3987.028104190193-39.7281041901932
6974.2936.16214129622338.0378587037767
71000.8973.50500833812427.2949916618764
81032.81007.9602455438324.8397544561695
91050.71082.13335973657-31.4333597365699
101057.31057.75526639732-0.455266397324585
111075.41050.4030350709424.9969649290564
121118.41099.9134387328818.4865612671182
131179.81149.4827832280030.3172167720044
1412271212.6667278786814.333272121319
151257.81238.5944775451719.2055224548336
161251.51266.98691113837-15.4869111383651
171236.31250.06451269571-13.7645126957143
181170.61223.02295039287-52.4229503928718
191213.11149.7480473890163.3519526109895
201265.51256.241353642089.25864635792217
211300.81326.14566276998-25.3456627699837
221348.41282.7338414702465.6661585297575
231371.91343.2021181997328.6978818002656
241403.31379.3529676618923.9470323381095
251451.81422.4306485556529.369351444352
261474.21454.2058061734019.9941938266014
271438.21450.21411501344-12.0141150134365
281513.61490.9765445616222.6234554383757
291562.21539.2182539711422.9817460288574
301546.21514.6588350096731.5411649903301
311527.51492.5805378806434.9194621193598
321418.71517.82251148454-99.1225114845368
331448.51409.3027723890339.1972276109702
341492.11403.6755680323488.4244319676616
351395.41469.35521278486-73.9552127848577
361403.71398.380862421145.31913757885518
371316.61392.10841497032-75.508414970322
381274.51265.652580328688.8474196713204
391264.41255.413007720058.98699227994683
401323.91297.5203597824626.3796402175418
411332.11336.48140635051-4.38140635050854
421250.21277.35267108198-27.1526710819800
431096.71211.48596983716-114.785969837164
441080.81027.6602470003953.1397529996119
451039.21039.83011785466-0.63011785466105
46792945.635324100095-153.635324100095
47746.6726.33963394446420.2603660555358
48688.8736.552731184083-47.7527311840829
49715.8638.46087620072277.3391237992777
50672.9697.121096864909-24.2210968649087
51629.5639.102916710736-9.60291671073588
52681.2650.82404832014330.3759516798568
53755.4720.50772279244134.8922772075587
54760.6750.6034022192559.99659778074505
55765.9776.680436555062-10.7804365550621
56836.8824.91564232916711.8843576708332
57904.9886.68808724975618.2119127502445

\begin{tabular}{lllllllll}
\hline
Multiple Linear Regression - Actuals, Interpolation, and Residuals \tabularnewline
Time or Index & Actuals & InterpolationForecast & ResidualsPrediction Error \tabularnewline
1 & 900.1 & 961.617277045312 & -61.517277045312 \tabularnewline
2 & 937.2 & 956.153788754332 & -18.9537887543321 \tabularnewline
3 & 948.9 & 955.475483010608 & -6.57548301060806 \tabularnewline
4 & 952.6 & 1016.49213619741 & -63.8921361974092 \tabularnewline
5 & 947.3 & 987.028104190193 & -39.7281041901932 \tabularnewline
6 & 974.2 & 936.162141296223 & 38.0378587037767 \tabularnewline
7 & 1000.8 & 973.505008338124 & 27.2949916618764 \tabularnewline
8 & 1032.8 & 1007.96024554383 & 24.8397544561695 \tabularnewline
9 & 1050.7 & 1082.13335973657 & -31.4333597365699 \tabularnewline
10 & 1057.3 & 1057.75526639732 & -0.455266397324585 \tabularnewline
11 & 1075.4 & 1050.40303507094 & 24.9969649290564 \tabularnewline
12 & 1118.4 & 1099.91343873288 & 18.4865612671182 \tabularnewline
13 & 1179.8 & 1149.48278322800 & 30.3172167720044 \tabularnewline
14 & 1227 & 1212.66672787868 & 14.333272121319 \tabularnewline
15 & 1257.8 & 1238.59447754517 & 19.2055224548336 \tabularnewline
16 & 1251.5 & 1266.98691113837 & -15.4869111383651 \tabularnewline
17 & 1236.3 & 1250.06451269571 & -13.7645126957143 \tabularnewline
18 & 1170.6 & 1223.02295039287 & -52.4229503928718 \tabularnewline
19 & 1213.1 & 1149.74804738901 & 63.3519526109895 \tabularnewline
20 & 1265.5 & 1256.24135364208 & 9.25864635792217 \tabularnewline
21 & 1300.8 & 1326.14566276998 & -25.3456627699837 \tabularnewline
22 & 1348.4 & 1282.73384147024 & 65.6661585297575 \tabularnewline
23 & 1371.9 & 1343.20211819973 & 28.6978818002656 \tabularnewline
24 & 1403.3 & 1379.35296766189 & 23.9470323381095 \tabularnewline
25 & 1451.8 & 1422.43064855565 & 29.369351444352 \tabularnewline
26 & 1474.2 & 1454.20580617340 & 19.9941938266014 \tabularnewline
27 & 1438.2 & 1450.21411501344 & -12.0141150134365 \tabularnewline
28 & 1513.6 & 1490.97654456162 & 22.6234554383757 \tabularnewline
29 & 1562.2 & 1539.21825397114 & 22.9817460288574 \tabularnewline
30 & 1546.2 & 1514.65883500967 & 31.5411649903301 \tabularnewline
31 & 1527.5 & 1492.58053788064 & 34.9194621193598 \tabularnewline
32 & 1418.7 & 1517.82251148454 & -99.1225114845368 \tabularnewline
33 & 1448.5 & 1409.30277238903 & 39.1972276109702 \tabularnewline
34 & 1492.1 & 1403.67556803234 & 88.4244319676616 \tabularnewline
35 & 1395.4 & 1469.35521278486 & -73.9552127848577 \tabularnewline
36 & 1403.7 & 1398.38086242114 & 5.31913757885518 \tabularnewline
37 & 1316.6 & 1392.10841497032 & -75.508414970322 \tabularnewline
38 & 1274.5 & 1265.65258032868 & 8.8474196713204 \tabularnewline
39 & 1264.4 & 1255.41300772005 & 8.98699227994683 \tabularnewline
40 & 1323.9 & 1297.52035978246 & 26.3796402175418 \tabularnewline
41 & 1332.1 & 1336.48140635051 & -4.38140635050854 \tabularnewline
42 & 1250.2 & 1277.35267108198 & -27.1526710819800 \tabularnewline
43 & 1096.7 & 1211.48596983716 & -114.785969837164 \tabularnewline
44 & 1080.8 & 1027.66024700039 & 53.1397529996119 \tabularnewline
45 & 1039.2 & 1039.83011785466 & -0.63011785466105 \tabularnewline
46 & 792 & 945.635324100095 & -153.635324100095 \tabularnewline
47 & 746.6 & 726.339633944464 & 20.2603660555358 \tabularnewline
48 & 688.8 & 736.552731184083 & -47.7527311840829 \tabularnewline
49 & 715.8 & 638.460876200722 & 77.3391237992777 \tabularnewline
50 & 672.9 & 697.121096864909 & -24.2210968649087 \tabularnewline
51 & 629.5 & 639.102916710736 & -9.60291671073588 \tabularnewline
52 & 681.2 & 650.824048320143 & 30.3759516798568 \tabularnewline
53 & 755.4 & 720.507722792441 & 34.8922772075587 \tabularnewline
54 & 760.6 & 750.603402219255 & 9.99659778074505 \tabularnewline
55 & 765.9 & 776.680436555062 & -10.7804365550621 \tabularnewline
56 & 836.8 & 824.915642329167 & 11.8843576708332 \tabularnewline
57 & 904.9 & 886.688087249756 & 18.2119127502445 \tabularnewline
\hline
\end{tabular}
%Source: https://freestatistics.org/blog/index.php?pk=57471&T=4

[TABLE]
[ROW][C]Multiple Linear Regression - Actuals, Interpolation, and Residuals[/C][/ROW]
[ROW][C]Time or Index[/C][C]Actuals[/C][C]InterpolationForecast[/C][C]ResidualsPrediction Error[/C][/ROW]
[ROW][C]1[/C][C]900.1[/C][C]961.617277045312[/C][C]-61.517277045312[/C][/ROW]
[ROW][C]2[/C][C]937.2[/C][C]956.153788754332[/C][C]-18.9537887543321[/C][/ROW]
[ROW][C]3[/C][C]948.9[/C][C]955.475483010608[/C][C]-6.57548301060806[/C][/ROW]
[ROW][C]4[/C][C]952.6[/C][C]1016.49213619741[/C][C]-63.8921361974092[/C][/ROW]
[ROW][C]5[/C][C]947.3[/C][C]987.028104190193[/C][C]-39.7281041901932[/C][/ROW]
[ROW][C]6[/C][C]974.2[/C][C]936.162141296223[/C][C]38.0378587037767[/C][/ROW]
[ROW][C]7[/C][C]1000.8[/C][C]973.505008338124[/C][C]27.2949916618764[/C][/ROW]
[ROW][C]8[/C][C]1032.8[/C][C]1007.96024554383[/C][C]24.8397544561695[/C][/ROW]
[ROW][C]9[/C][C]1050.7[/C][C]1082.13335973657[/C][C]-31.4333597365699[/C][/ROW]
[ROW][C]10[/C][C]1057.3[/C][C]1057.75526639732[/C][C]-0.455266397324585[/C][/ROW]
[ROW][C]11[/C][C]1075.4[/C][C]1050.40303507094[/C][C]24.9969649290564[/C][/ROW]
[ROW][C]12[/C][C]1118.4[/C][C]1099.91343873288[/C][C]18.4865612671182[/C][/ROW]
[ROW][C]13[/C][C]1179.8[/C][C]1149.48278322800[/C][C]30.3172167720044[/C][/ROW]
[ROW][C]14[/C][C]1227[/C][C]1212.66672787868[/C][C]14.333272121319[/C][/ROW]
[ROW][C]15[/C][C]1257.8[/C][C]1238.59447754517[/C][C]19.2055224548336[/C][/ROW]
[ROW][C]16[/C][C]1251.5[/C][C]1266.98691113837[/C][C]-15.4869111383651[/C][/ROW]
[ROW][C]17[/C][C]1236.3[/C][C]1250.06451269571[/C][C]-13.7645126957143[/C][/ROW]
[ROW][C]18[/C][C]1170.6[/C][C]1223.02295039287[/C][C]-52.4229503928718[/C][/ROW]
[ROW][C]19[/C][C]1213.1[/C][C]1149.74804738901[/C][C]63.3519526109895[/C][/ROW]
[ROW][C]20[/C][C]1265.5[/C][C]1256.24135364208[/C][C]9.25864635792217[/C][/ROW]
[ROW][C]21[/C][C]1300.8[/C][C]1326.14566276998[/C][C]-25.3456627699837[/C][/ROW]
[ROW][C]22[/C][C]1348.4[/C][C]1282.73384147024[/C][C]65.6661585297575[/C][/ROW]
[ROW][C]23[/C][C]1371.9[/C][C]1343.20211819973[/C][C]28.6978818002656[/C][/ROW]
[ROW][C]24[/C][C]1403.3[/C][C]1379.35296766189[/C][C]23.9470323381095[/C][/ROW]
[ROW][C]25[/C][C]1451.8[/C][C]1422.43064855565[/C][C]29.369351444352[/C][/ROW]
[ROW][C]26[/C][C]1474.2[/C][C]1454.20580617340[/C][C]19.9941938266014[/C][/ROW]
[ROW][C]27[/C][C]1438.2[/C][C]1450.21411501344[/C][C]-12.0141150134365[/C][/ROW]
[ROW][C]28[/C][C]1513.6[/C][C]1490.97654456162[/C][C]22.6234554383757[/C][/ROW]
[ROW][C]29[/C][C]1562.2[/C][C]1539.21825397114[/C][C]22.9817460288574[/C][/ROW]
[ROW][C]30[/C][C]1546.2[/C][C]1514.65883500967[/C][C]31.5411649903301[/C][/ROW]
[ROW][C]31[/C][C]1527.5[/C][C]1492.58053788064[/C][C]34.9194621193598[/C][/ROW]
[ROW][C]32[/C][C]1418.7[/C][C]1517.82251148454[/C][C]-99.1225114845368[/C][/ROW]
[ROW][C]33[/C][C]1448.5[/C][C]1409.30277238903[/C][C]39.1972276109702[/C][/ROW]
[ROW][C]34[/C][C]1492.1[/C][C]1403.67556803234[/C][C]88.4244319676616[/C][/ROW]
[ROW][C]35[/C][C]1395.4[/C][C]1469.35521278486[/C][C]-73.9552127848577[/C][/ROW]
[ROW][C]36[/C][C]1403.7[/C][C]1398.38086242114[/C][C]5.31913757885518[/C][/ROW]
[ROW][C]37[/C][C]1316.6[/C][C]1392.10841497032[/C][C]-75.508414970322[/C][/ROW]
[ROW][C]38[/C][C]1274.5[/C][C]1265.65258032868[/C][C]8.8474196713204[/C][/ROW]
[ROW][C]39[/C][C]1264.4[/C][C]1255.41300772005[/C][C]8.98699227994683[/C][/ROW]
[ROW][C]40[/C][C]1323.9[/C][C]1297.52035978246[/C][C]26.3796402175418[/C][/ROW]
[ROW][C]41[/C][C]1332.1[/C][C]1336.48140635051[/C][C]-4.38140635050854[/C][/ROW]
[ROW][C]42[/C][C]1250.2[/C][C]1277.35267108198[/C][C]-27.1526710819800[/C][/ROW]
[ROW][C]43[/C][C]1096.7[/C][C]1211.48596983716[/C][C]-114.785969837164[/C][/ROW]
[ROW][C]44[/C][C]1080.8[/C][C]1027.66024700039[/C][C]53.1397529996119[/C][/ROW]
[ROW][C]45[/C][C]1039.2[/C][C]1039.83011785466[/C][C]-0.63011785466105[/C][/ROW]
[ROW][C]46[/C][C]792[/C][C]945.635324100095[/C][C]-153.635324100095[/C][/ROW]
[ROW][C]47[/C][C]746.6[/C][C]726.339633944464[/C][C]20.2603660555358[/C][/ROW]
[ROW][C]48[/C][C]688.8[/C][C]736.552731184083[/C][C]-47.7527311840829[/C][/ROW]
[ROW][C]49[/C][C]715.8[/C][C]638.460876200722[/C][C]77.3391237992777[/C][/ROW]
[ROW][C]50[/C][C]672.9[/C][C]697.121096864909[/C][C]-24.2210968649087[/C][/ROW]
[ROW][C]51[/C][C]629.5[/C][C]639.102916710736[/C][C]-9.60291671073588[/C][/ROW]
[ROW][C]52[/C][C]681.2[/C][C]650.824048320143[/C][C]30.3759516798568[/C][/ROW]
[ROW][C]53[/C][C]755.4[/C][C]720.507722792441[/C][C]34.8922772075587[/C][/ROW]
[ROW][C]54[/C][C]760.6[/C][C]750.603402219255[/C][C]9.99659778074505[/C][/ROW]
[ROW][C]55[/C][C]765.9[/C][C]776.680436555062[/C][C]-10.7804365550621[/C][/ROW]
[ROW][C]56[/C][C]836.8[/C][C]824.915642329167[/C][C]11.8843576708332[/C][/ROW]
[ROW][C]57[/C][C]904.9[/C][C]886.688087249756[/C][C]18.2119127502445[/C][/ROW]
[/TABLE]
Source: https://freestatistics.org/blog/index.php?pk=57471&T=4

Globally Unique Identifier (entire table): ba.freestatistics.org/blog/index.php?pk=57471&T=4

As an alternative you can also use a QR Code:  

The GUIDs for individual cells are displayed in the table below:

Multiple Linear Regression - Actuals, Interpolation, and Residuals
Time or IndexActualsInterpolationForecastResidualsPrediction Error
1900.1961.617277045312-61.517277045312
2937.2956.153788754332-18.9537887543321
3948.9955.475483010608-6.57548301060806
4952.61016.49213619741-63.8921361974092
5947.3987.028104190193-39.7281041901932
6974.2936.16214129622338.0378587037767
71000.8973.50500833812427.2949916618764
81032.81007.9602455438324.8397544561695
91050.71082.13335973657-31.4333597365699
101057.31057.75526639732-0.455266397324585
111075.41050.4030350709424.9969649290564
121118.41099.9134387328818.4865612671182
131179.81149.4827832280030.3172167720044
1412271212.6667278786814.333272121319
151257.81238.5944775451719.2055224548336
161251.51266.98691113837-15.4869111383651
171236.31250.06451269571-13.7645126957143
181170.61223.02295039287-52.4229503928718
191213.11149.7480473890163.3519526109895
201265.51256.241353642089.25864635792217
211300.81326.14566276998-25.3456627699837
221348.41282.7338414702465.6661585297575
231371.91343.2021181997328.6978818002656
241403.31379.3529676618923.9470323381095
251451.81422.4306485556529.369351444352
261474.21454.2058061734019.9941938266014
271438.21450.21411501344-12.0141150134365
281513.61490.9765445616222.6234554383757
291562.21539.2182539711422.9817460288574
301546.21514.6588350096731.5411649903301
311527.51492.5805378806434.9194621193598
321418.71517.82251148454-99.1225114845368
331448.51409.3027723890339.1972276109702
341492.11403.6755680323488.4244319676616
351395.41469.35521278486-73.9552127848577
361403.71398.380862421145.31913757885518
371316.61392.10841497032-75.508414970322
381274.51265.652580328688.8474196713204
391264.41255.413007720058.98699227994683
401323.91297.5203597824626.3796402175418
411332.11336.48140635051-4.38140635050854
421250.21277.35267108198-27.1526710819800
431096.71211.48596983716-114.785969837164
441080.81027.6602470003953.1397529996119
451039.21039.83011785466-0.63011785466105
46792945.635324100095-153.635324100095
47746.6726.33963394446420.2603660555358
48688.8736.552731184083-47.7527311840829
49715.8638.46087620072277.3391237992777
50672.9697.121096864909-24.2210968649087
51629.5639.102916710736-9.60291671073588
52681.2650.82404832014330.3759516798568
53755.4720.50772279244134.8922772075587
54760.6750.6034022192559.99659778074505
55765.9776.680436555062-10.7804365550621
56836.8824.91564232916711.8843576708332
57904.9886.68808724975618.2119127502445


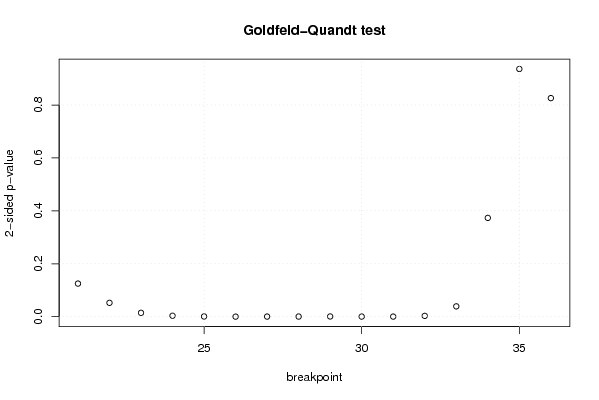
Goldfeld-Quandt test for Heteroskedasticity
p-valuesAlternative Hypothesis
breakpoint indexgreater2-sidedless
210.06257037456364580.1251407491272920.937429625436354
220.02622969462828700.05245938925657410.973770305371713
230.007304447708642960.01460889541728590.992695552291357
240.001832219453974370.003664438907948730.998167780546026
250.0004496160184083850.000899232036816770.999550383981592
269.67248575731702e-050.0001934497151463400.999903275142427
270.0002371350120766530.0004742700241533060.999762864987923
280.0002695871428365780.0005391742856731570.999730412857163
290.0004428661236577410.0008857322473154830.999557133876342
300.0002204522568413720.0004409045136827430.999779547743159
310.0001913298322771940.0003826596645543870.999808670167723
320.001576487536217530.003152975072435070.998423512463782
330.01956044795907530.03912089591815060.980439552040925
340.1867440833969870.3734881667939740.813255916603013
350.4682211245683510.9364422491367020.531778875431649
360.4130900537534770.8261801075069530.586909946246523

\begin{tabular}{lllllllll}
\hline
Goldfeld-Quandt test for Heteroskedasticity \tabularnewline
p-values & Alternative Hypothesis \tabularnewline
breakpoint index & greater & 2-sided & less \tabularnewline
21 & 0.0625703745636458 & 0.125140749127292 & 0.937429625436354 \tabularnewline
22 & 0.0262296946282870 & 0.0524593892565741 & 0.973770305371713 \tabularnewline
23 & 0.00730444770864296 & 0.0146088954172859 & 0.992695552291357 \tabularnewline
24 & 0.00183221945397437 & 0.00366443890794873 & 0.998167780546026 \tabularnewline
25 & 0.000449616018408385 & 0.00089923203681677 & 0.999550383981592 \tabularnewline
26 & 9.67248575731702e-05 & 0.000193449715146340 & 0.999903275142427 \tabularnewline
27 & 0.000237135012076653 & 0.000474270024153306 & 0.999762864987923 \tabularnewline
28 & 0.000269587142836578 & 0.000539174285673157 & 0.999730412857163 \tabularnewline
29 & 0.000442866123657741 & 0.000885732247315483 & 0.999557133876342 \tabularnewline
30 & 0.000220452256841372 & 0.000440904513682743 & 0.999779547743159 \tabularnewline
31 & 0.000191329832277194 & 0.000382659664554387 & 0.999808670167723 \tabularnewline
32 & 0.00157648753621753 & 0.00315297507243507 & 0.998423512463782 \tabularnewline
33 & 0.0195604479590753 & 0.0391208959181506 & 0.980439552040925 \tabularnewline
34 & 0.186744083396987 & 0.373488166793974 & 0.813255916603013 \tabularnewline
35 & 0.468221124568351 & 0.936442249136702 & 0.531778875431649 \tabularnewline
36 & 0.413090053753477 & 0.826180107506953 & 0.586909946246523 \tabularnewline
\hline
\end{tabular}
%Source: https://freestatistics.org/blog/index.php?pk=57471&T=5

[TABLE]
[ROW][C]Goldfeld-Quandt test for Heteroskedasticity[/C][/ROW]
[ROW][C]p-values[/C][C]Alternative Hypothesis[/C][/ROW]
[ROW][C]breakpoint index[/C][C]greater[/C][C]2-sided[/C][C]less[/C][/ROW]
[ROW][C]21[/C][C]0.0625703745636458[/C][C]0.125140749127292[/C][C]0.937429625436354[/C][/ROW]
[ROW][C]22[/C][C]0.0262296946282870[/C][C]0.0524593892565741[/C][C]0.973770305371713[/C][/ROW]
[ROW][C]23[/C][C]0.00730444770864296[/C][C]0.0146088954172859[/C][C]0.992695552291357[/C][/ROW]
[ROW][C]24[/C][C]0.00183221945397437[/C][C]0.00366443890794873[/C][C]0.998167780546026[/C][/ROW]
[ROW][C]25[/C][C]0.000449616018408385[/C][C]0.00089923203681677[/C][C]0.999550383981592[/C][/ROW]
[ROW][C]26[/C][C]9.67248575731702e-05[/C][C]0.000193449715146340[/C][C]0.999903275142427[/C][/ROW]
[ROW][C]27[/C][C]0.000237135012076653[/C][C]0.000474270024153306[/C][C]0.999762864987923[/C][/ROW]
[ROW][C]28[/C][C]0.000269587142836578[/C][C]0.000539174285673157[/C][C]0.999730412857163[/C][/ROW]
[ROW][C]29[/C][C]0.000442866123657741[/C][C]0.000885732247315483[/C][C]0.999557133876342[/C][/ROW]
[ROW][C]30[/C][C]0.000220452256841372[/C][C]0.000440904513682743[/C][C]0.999779547743159[/C][/ROW]
[ROW][C]31[/C][C]0.000191329832277194[/C][C]0.000382659664554387[/C][C]0.999808670167723[/C][/ROW]
[ROW][C]32[/C][C]0.00157648753621753[/C][C]0.00315297507243507[/C][C]0.998423512463782[/C][/ROW]
[ROW][C]33[/C][C]0.0195604479590753[/C][C]0.0391208959181506[/C][C]0.980439552040925[/C][/ROW]
[ROW][C]34[/C][C]0.186744083396987[/C][C]0.373488166793974[/C][C]0.813255916603013[/C][/ROW]
[ROW][C]35[/C][C]0.468221124568351[/C][C]0.936442249136702[/C][C]0.531778875431649[/C][/ROW]
[ROW][C]36[/C][C]0.413090053753477[/C][C]0.826180107506953[/C][C]0.586909946246523[/C][/ROW]
[/TABLE]
Source: https://freestatistics.org/blog/index.php?pk=57471&T=5

Globally Unique Identifier (entire table): ba.freestatistics.org/blog/index.php?pk=57471&T=5

As an alternative you can also use a QR Code:  

The GUIDs for individual cells are displayed in the table below:

Goldfeld-Quandt test for Heteroskedasticity
p-valuesAlternative Hypothesis
breakpoint indexgreater2-sidedless
210.06257037456364580.1251407491272920.937429625436354
220.02622969462828700.05245938925657410.973770305371713
230.007304447708642960.01460889541728590.992695552291357
240.001832219453974370.003664438907948730.998167780546026
250.0004496160184083850.000899232036816770.999550383981592
269.67248575731702e-050.0001934497151463400.999903275142427
270.0002371350120766530.0004742700241533060.999762864987923
280.0002695871428365780.0005391742856731570.999730412857163
290.0004428661236577410.0008857322473154830.999557133876342
300.0002204522568413720.0004409045136827430.999779547743159
310.0001913298322771940.0003826596645543870.999808670167723
320.001576487536217530.003152975072435070.998423512463782
330.01956044795907530.03912089591815060.980439552040925
340.1867440833969870.3734881667939740.813255916603013
350.4682211245683510.9364422491367020.531778875431649
360.4130900537534770.8261801075069530.586909946246523


Meta Analysis of Goldfeld-Quandt test for Heteroskedasticity
Description# significant tests% significant testsOK/NOK
1% type I error level90.5625NOK
5% type I error level110.6875NOK
10% type I error level120.75NOK

\begin{tabular}{lllllllll}
\hline
Meta Analysis of Goldfeld-Quandt test for Heteroskedasticity \tabularnewline
Description & # significant tests & % significant tests & OK/NOK \tabularnewline
1% type I error level & 9 & 0.5625 & NOK \tabularnewline
5% type I error level & 11 & 0.6875 & NOK \tabularnewline
10% type I error level & 12 & 0.75 & NOK \tabularnewline
\hline
\end{tabular}
%Source: https://freestatistics.org/blog/index.php?pk=57471&T=6

[TABLE]
[ROW][C]Meta Analysis of Goldfeld-Quandt test for Heteroskedasticity[/C][/ROW]
[ROW][C]Description[/C][C]# significant tests[/C][C]% significant tests[/C][C]OK/NOK[/C][/ROW]
[ROW][C]1% type I error level[/C][C]9[/C][C]0.5625[/C][C]NOK[/C][/ROW]
[ROW][C]5% type I error level[/C][C]11[/C][C]0.6875[/C][C]NOK[/C][/ROW]
[ROW][C]10% type I error level[/C][C]12[/C][C]0.75[/C][C]NOK[/C][/ROW]
[/TABLE]
Source: https://freestatistics.org/blog/index.php?pk=57471&T=6

Globally Unique Identifier (entire table): ba.freestatistics.org/blog/index.php?pk=57471&T=6

As an alternative you can also use a QR Code:  

The GUIDs for individual cells are displayed in the table below:

Meta Analysis of Goldfeld-Quandt test for Heteroskedasticity
Description# significant tests% significant testsOK/NOK
1% type I error level90.5625NOK
5% type I error level110.6875NOK
10% type I error level120.75NOK


Parameters (Session):
par1 = 1 ; par2 = Include Monthly Dummies ; par3 = Linear Trend ;
Parameters (R input):
par1 = 1 ; par2 = Include Monthly Dummies ; par3 = Linear Trend ;
R code (references can be found in the software module):
library(lattice)
library(lmtest)
n25 <- 25 #minimum number of obs. for Goldfeld-Quandt test
par1 <- as.numeric(par1)
x <- t(y)
k <- length(x[1,])
n <- length(x[,1])
x1 <- cbind(x[,par1], x[,1:k!=par1])
mycolnames <- c(colnames(x)[par1], colnames(x)[1:k!=par1])
colnames(x1) <- mycolnames #colnames(x)[par1]
x <- x1
if (par3 == 'First Differences'){
x2 <- array(0, dim=c(n-1,k), dimnames=list(1:(n-1), paste('(1-B)',colnames(x),sep='')))
for (i in 1:n-1) {
for (j in 1:k) {
x2[i,j] <- x[i+1,j] - x[i,j]
}
}
x <- x2
}
if (par2 == 'Include Monthly Dummies'){
x2 <- array(0, dim=c(n,11), dimnames=list(1:n, paste('M', seq(1:11), sep ='')))
for (i in 1:11){
x2[seq(i,n,12),i] <- 1
}
x <- cbind(x, x2)
}
if (par2 == 'Include Quarterly Dummies'){
x2 <- array(0, dim=c(n,3), dimnames=list(1:n, paste('Q', seq(1:3), sep ='')))
for (i in 1:3){
x2[seq(i,n,4),i] <- 1
}
x <- cbind(x, x2)
}
k <- length(x[1,])
if (par3 == 'Linear Trend'){
x <- cbind(x, c(1:n))
colnames(x)[k+1] <- 't'
}
x
k <- length(x[1,])
df <- as.data.frame(x)
(mylm <- lm(df))
(mysum <- summary(mylm))
if (n > n25) {
kp3 <- k + 3
nmkm3 <- n - k - 3
gqarr <- array(NA, dim=c(nmkm3-kp3+1,3))
numgqtests <- 0
numsignificant1 <- 0
numsignificant5 <- 0
numsignificant10 <- 0
for (mypoint in kp3:nmkm3) {
j <- 0
numgqtests <- numgqtests + 1
for (myalt in c('greater', 'two.sided', 'less')) {
j <- j + 1
gqarr[mypoint-kp3+1,j] <- gqtest(mylm, point=mypoint, alternative=myalt)$p.value
}
if (gqarr[mypoint-kp3+1,2] < 0.01) numsignificant1 <- numsignificant1 + 1
if (gqarr[mypoint-kp3+1,2] < 0.05) numsignificant5 <- numsignificant5 + 1
if (gqarr[mypoint-kp3+1,2] < 0.10) numsignificant10 <- numsignificant10 + 1
}
gqarr
}
bitmap(file='test0.png')
plot(x[,1], type='l', main='Actuals and Interpolation', ylab='value of Actuals and Interpolation (dots)', xlab='time or index')
points(x[,1]-mysum$resid)
grid()
dev.off()
bitmap(file='test1.png')
plot(mysum$resid, type='b', pch=19, main='Residuals', ylab='value of Residuals', xlab='time or index')
grid()
dev.off()
bitmap(file='test2.png')
hist(mysum$resid, main='Residual Histogram', xlab='values of Residuals')
grid()
dev.off()
bitmap(file='test3.png')
densityplot(~mysum$resid,col='black',main='Residual Density Plot', xlab='values of Residuals')
dev.off()
bitmap(file='test4.png')
qqnorm(mysum$resid, main='Residual Normal Q-Q Plot')
qqline(mysum$resid)
grid()
dev.off()
(myerror <- as.ts(mysum$resid))
bitmap(file='test5.png')
dum <- cbind(lag(myerror,k=1),myerror)
dum
dum1 <- dum[2:length(myerror),]
dum1
z <- as.data.frame(dum1)
z
plot(z,main=paste('Residual Lag plot, lowess, and regression line'), ylab='values of Residuals', xlab='lagged values of Residuals')
lines(lowess(z))
abline(lm(z))
grid()
dev.off()
bitmap(file='test6.png')
acf(mysum$resid, lag.max=length(mysum$resid)/2, main='Residual Autocorrelation Function')
grid()
dev.off()
bitmap(file='test7.png')
pacf(mysum$resid, lag.max=length(mysum$resid)/2, main='Residual Partial Autocorrelation Function')
grid()
dev.off()
bitmap(file='test8.png')
opar <- par(mfrow = c(2,2), oma = c(0, 0, 1.1, 0))
plot(mylm, las = 1, sub='Residual Diagnostics')
par(opar)
dev.off()
if (n > n25) {
bitmap(file='test9.png')
plot(kp3:nmkm3,gqarr[,2], main='Goldfeld-Quandt test',ylab='2-sided p-value',xlab='breakpoint')
grid()
dev.off()
}
load(file='createtable')
a<-table.start()
a<-table.row.start(a)
a<-table.element(a, 'Multiple Linear Regression - Estimated Regression Equation', 1, TRUE)
a<-table.row.end(a)
myeq <- colnames(x)[1]
myeq <- paste(myeq, '[t] = ', sep='')
for (i in 1:k){
if (mysum$coefficients[i,1] > 0) myeq <- paste(myeq, '+', '')
myeq <- paste(myeq, mysum$coefficients[i,1], sep=' ')
if (rownames(mysum$coefficients)[i] != '(Intercept)') {
myeq <- paste(myeq, rownames(mysum$coefficients)[i], sep='')
if (rownames(mysum$coefficients)[i] != 't') myeq <- paste(myeq, '[t]', sep='')
}
}
myeq <- paste(myeq, ' + e[t]')
a<-table.row.start(a)
a<-table.element(a, myeq)
a<-table.row.end(a)
a<-table.end(a)
table.save(a,file='mytable1.tab')
a<-table.start()
a<-table.row.start(a)
a<-table.element(a,hyperlink('ols1.htm','Multiple Linear Regression - Ordinary Least Squares',''), 6, TRUE)
a<-table.row.end(a)
a<-table.row.start(a)
a<-table.element(a,'Variable',header=TRUE)
a<-table.element(a,'Parameter',header=TRUE)
a<-table.element(a,'S.D.',header=TRUE)
a<-table.element(a,'T-STAT
H0: parameter = 0',header=TRUE)
a<-table.element(a,'2-tail p-value',header=TRUE)
a<-table.element(a,'1-tail p-value',header=TRUE)
a<-table.row.end(a)
for (i in 1:k){
a<-table.row.start(a)
a<-table.element(a,rownames(mysum$coefficients)[i],header=TRUE)
a<-table.element(a,mysum$coefficients[i,1])
a<-table.element(a, round(mysum$coefficients[i,2],6))
a<-table.element(a, round(mysum$coefficients[i,3],4))
a<-table.element(a, round(mysum$coefficients[i,4],6))
a<-table.element(a, round(mysum$coefficients[i,4]/2,6))
a<-table.row.end(a)
}
a<-table.end(a)
table.save(a,file='mytable2.tab')
a<-table.start()
a<-table.row.start(a)
a<-table.element(a, 'Multiple Linear Regression - Regression Statistics', 2, TRUE)
a<-table.row.end(a)
a<-table.row.start(a)
a<-table.element(a, 'Multiple R',1,TRUE)
a<-table.element(a, sqrt(mysum$r.squared))
a<-table.row.end(a)
a<-table.row.start(a)
a<-table.element(a, 'R-squared',1,TRUE)
a<-table.element(a, mysum$r.squared)
a<-table.row.end(a)
a<-table.row.start(a)
a<-table.element(a, 'Adjusted R-squared',1,TRUE)
a<-table.element(a, mysum$adj.r.squared)
a<-table.row.end(a)
a<-table.row.start(a)
a<-table.element(a, 'F-TEST (value)',1,TRUE)
a<-table.element(a, mysum$fstatistic[1])
a<-table.row.end(a)
a<-table.row.start(a)
a<-table.element(a, 'F-TEST (DF numerator)',1,TRUE)
a<-table.element(a, mysum$fstatistic[2])
a<-table.row.end(a)
a<-table.row.start(a)
a<-table.element(a, 'F-TEST (DF denominator)',1,TRUE)
a<-table.element(a, mysum$fstatistic[3])
a<-table.row.end(a)
a<-table.row.start(a)
a<-table.element(a, 'p-value',1,TRUE)
a<-table.element(a, 1-pf(mysum$fstatistic[1],mysum$fstatistic[2],mysum$fstatistic[3]))
a<-table.row.end(a)
a<-table.row.start(a)
a<-table.element(a, 'Multiple Linear Regression - Residual Statistics', 2, TRUE)
a<-table.row.end(a)
a<-table.row.start(a)
a<-table.element(a, 'Residual Standard Deviation',1,TRUE)
a<-table.element(a, mysum$sigma)
a<-table.row.end(a)
a<-table.row.start(a)
a<-table.element(a, 'Sum Squared Residuals',1,TRUE)
a<-table.element(a, sum(myerror*myerror))
a<-table.row.end(a)
a<-table.end(a)
table.save(a,file='mytable3.tab')
a<-table.start()
a<-table.row.start(a)
a<-table.element(a, 'Multiple Linear Regression - Actuals, Interpolation, and Residuals', 4, TRUE)
a<-table.row.end(a)
a<-table.row.start(a)
a<-table.element(a, 'Time or Index', 1, TRUE)
a<-table.element(a, 'Actuals', 1, TRUE)
a<-table.element(a, 'Interpolation
Forecast', 1, TRUE)
a<-table.element(a, 'Residuals
Prediction Error', 1, TRUE)
a<-table.row.end(a)
for (i in 1:n) {
a<-table.row.start(a)
a<-table.element(a,i, 1, TRUE)
a<-table.element(a,x[i])
a<-table.element(a,x[i]-mysum$resid[i])
a<-table.element(a,mysum$resid[i])
a<-table.row.end(a)
}
a<-table.end(a)
table.save(a,file='mytable4.tab')
if (n > n25) {
a<-table.start()
a<-table.row.start(a)
a<-table.element(a,'Goldfeld-Quandt test for Heteroskedasticity',4,TRUE)
a<-table.row.end(a)
a<-table.row.start(a)
a<-table.element(a,'p-values',header=TRUE)
a<-table.element(a,'Alternative Hypothesis',3,header=TRUE)
a<-table.row.end(a)
a<-table.row.start(a)
a<-table.element(a,'breakpoint index',header=TRUE)
a<-table.element(a,'greater',header=TRUE)
a<-table.element(a,'2-sided',header=TRUE)
a<-table.element(a,'less',header=TRUE)
a<-table.row.end(a)
for (mypoint in kp3:nmkm3) {
a<-table.row.start(a)
a<-table.element(a,mypoint,header=TRUE)
a<-table.element(a,gqarr[mypoint-kp3+1,1])
a<-table.element(a,gqarr[mypoint-kp3+1,2])
a<-table.element(a,gqarr[mypoint-kp3+1,3])
a<-table.row.end(a)
}
a<-table.end(a)
table.save(a,file='mytable5.tab')
a<-table.start()
a<-table.row.start(a)
a<-table.element(a,'Meta Analysis of Goldfeld-Quandt test for Heteroskedasticity',4,TRUE)
a<-table.row.end(a)
a<-table.row.start(a)
a<-table.element(a,'Description',header=TRUE)
a<-table.element(a,'# significant tests',header=TRUE)
a<-table.element(a,'% significant tests',header=TRUE)
a<-table.element(a,'OK/NOK',header=TRUE)
a<-table.row.end(a)
a<-table.row.start(a)
a<-table.element(a,'1% type I error level',header=TRUE)
a<-table.element(a,numsignificant1)
a<-table.element(a,numsignificant1/numgqtests)
if (numsignificant1/numgqtests < 0.01) dum <- 'OK' else dum <- 'NOK'
a<-table.element(a,dum)
a<-table.row.end(a)
a<-table.row.start(a)
a<-table.element(a,'5% type I error level',header=TRUE)
a<-table.element(a,numsignificant5)
a<-table.element(a,numsignificant5/numgqtests)
if (numsignificant5/numgqtests < 0.05) dum <- 'OK' else dum <- 'NOK'
a<-table.element(a,dum)
a<-table.row.end(a)
a<-table.row.start(a)
a<-table.element(a,'10% type I error level',header=TRUE)
a<-table.element(a,numsignificant10)
a<-table.element(a,numsignificant10/numgqtests)
if (numsignificant10/numgqtests < 0.1) dum <- 'OK' else dum <- 'NOK'
a<-table.element(a,dum)
a<-table.row.end(a)
a<-table.end(a)
table.save(a,file='mytable6.tab')
}