Free Statistics

of Irreproducible Research!

Author's title

Author*The author of this computation has been verified*
R Software Modulerwasp_multipleregression.wasp
Title produced by softwareMultiple Regression
Date of computationWed, 18 Nov 2009 07:48:54 -0700
Cite this page as followsStatistical Computations at FreeStatistics.org, Office for Research Development and Education, URL https://freestatistics.org/blog/index.php?v=date/2009/Nov/18/t1258555829yx1o04pmlew1sza.htm/, Retrieved Wed, 01 May 2024 16:25:01 +0000
Statistical Computations at FreeStatistics.org, Office for Research Development and Education, URL https://freestatistics.org/blog/index.php?pk=57461, Retrieved Wed, 01 May 2024 16:25:01 +0000
QR Codes:

Original text written by user:
IsPrivate?No (this computation is public)
User-defined keywords
Estimated Impact178
Family? (F = Feedback message, R = changed R code, M = changed R Module, P = changed Parameters, D = changed Data)
-     [Multiple Regression] [Q1 The Seatbeltlaw] [2007-11-14 19:27:43] [8cd6641b921d30ebe00b648d1481bba0]
- RM D  [Multiple Regression] [Seatbelt] [2009-11-12 14:10:54] [b98453cac15ba1066b407e146608df68]
-    D      [Multiple Regression] [] [2009-11-18 14:48:54] [791a4a78a0a7ca497fb8791b982a539e] [Current]
-    D        [Multiple Regression] [] [2009-11-18 15:05:53] [ee35698a38947a6c6c039b1e3deafc05]
-    D          [Multiple Regression] [] [2009-11-18 15:17:01] [ee35698a38947a6c6c039b1e3deafc05]
Feedback Forum

Post a new message
Dataseries X:
900.1	880.4	849.4	819.3	785.8
937.2	900.1	880.4	849.4	819.3
948.9	937.2	900.1	880.4	849.4
952.6	948.9	937.2	900.1	880.4
947.3	952.6	948.9	937.2	900.1
974.2	947.3	952.6	948.9	937.2
1000.8	974.2	947.3	952.6	948.9
1032.8	1000.8	974.2	947.3	952.6
1050.7	1032.8	1000.8	974.2	947.3
1057.3	1050.7	1032.8	1000.8	974.2
1075.4	1057.3	1050.7	1032.8	1000.8
1118.4	1075.4	1057.3	1050.7	1032.8
1179.8	1118.4	1075.4	1057.3	1050.7
1227	1179.8	1118.4	1075.4	1057.3
1257.8	1227	1179.8	1118.4	1075.4
1251.5	1257.8	1227	1179.8	1118.4
1236.3	1251.5	1257.8	1227	1179.8
1170.6	1236.3	1251.5	1257.8	1227
1213.1	1170.6	1236.3	1251.5	1257.8
1265.5	1213.1	1170.6	1236.3	1251.5
1300.8	1265.5	1213.1	1170.6	1236.3
1348.4	1300.8	1265.5	1213.1	1170.6
1371.9	1348.4	1300.8	1265.5	1213.1
1403.3	1371.9	1348.4	1300.8	1265.5
1451.8	1403.3	1371.9	1348.4	1300.8
1474.2	1451.8	1403.3	1371.9	1348.4
1438.2	1474.2	1451.8	1403.3	1371.9
1513.6	1438.2	1474.2	1451.8	1403.3
1562.2	1513.6	1438.2	1474.2	1451.8
1546.2	1562.2	1513.6	1438.2	1474.2
1527.5	1546.2	1562.2	1513.6	1438.2
1418.7	1527.5	1546.2	1562.2	1513.6
1448.5	1418.7	1527.5	1546.2	1562.2
1492.1	1448.5	1418.7	1527.5	1546.2
1395.4	1492.1	1448.5	1418.7	1527.5
1403.7	1395.4	1492.1	1448.5	1418.7
1316.6	1403.7	1395.4	1492.1	1448.5
1274.5	1316.6	1403.7	1395.4	1492.1
1264.4	1274.5	1316.6	1403.7	1395.4
1323.9	1264.4	1274.5	1316.6	1403.7
1332.1	1323.9	1264.4	1274.5	1316.6
1250.2	1332.1	1323.9	1264.4	1274.5
1096.7	1250.2	1332.1	1323.9	1264.4
1080.8	1096.7	1250.2	1332.1	1323.9
1039.2	1080.8	1096.7	1250.2	1332.1
792	1039.2	1080.8	1096.7	1250.2
746.6	792	1039.2	1080.8	1096.7
688.8	746.6	792	1039.2	1080.8
715.8	688.8	746.6	792	1039.2
672.9	715.8	688.8	746.6	792
629.5	672.9	715.8	688.8	746.6
681.2	629.5	672.9	715.8	688.8
755.4	681.2	629.5	672.9	715.8
760.6	755.4	681.2	629.5	672.9
765.9	760.6	755.4	681.2	629.5
836.8	765.9	760.6	755.4	681.2
904.9	836.8	765.9	760.6	755.4


Summary of computational transaction
Raw Inputview raw input (R code)
Raw Outputview raw output of R engine
Computing time3 seconds
R Server'Gwilym Jenkins' @ 72.249.127.135

\begin{tabular}{lllllllll}
\hline
Summary of computational transaction \tabularnewline
Raw Input & view raw input (R code)  \tabularnewline
Raw Output & view raw output of R engine  \tabularnewline
Computing time & 3 seconds \tabularnewline
R Server & 'Gwilym Jenkins' @ 72.249.127.135 \tabularnewline
\hline
\end{tabular}
%Source: https://freestatistics.org/blog/index.php?pk=57461&T=0

[TABLE]
[ROW][C]Summary of computational transaction[/C][/ROW]
[ROW][C]Raw Input[/C][C]view raw input (R code) [/C][/ROW]
[ROW][C]Raw Output[/C][C]view raw output of R engine [/C][/ROW]
[ROW][C]Computing time[/C][C]3 seconds[/C][/ROW]
[ROW][C]R Server[/C][C]'Gwilym Jenkins' @ 72.249.127.135[/C][/ROW]
[/TABLE]
Source: https://freestatistics.org/blog/index.php?pk=57461&T=0

Globally Unique Identifier (entire table): ba.freestatistics.org/blog/index.php?pk=57461&T=0

As an alternative you can also use a QR Code:  

The GUIDs for individual cells are displayed in the table below:

Summary of computational transaction
Raw Inputview raw input (R code)
Raw Outputview raw output of R engine
Computing time3 seconds
R Server'Gwilym Jenkins' @ 72.249.127.135


Multiple Linear Regression - Estimated Regression Equation
Y[t] = + 79.0512126552317 + 1.22170757002387Y1[t] -0.190212790162334Y2[t] + 0.101091244492515Y3[t] -0.177636627855897Y4[t] -2.25135137660336M1[t] -15.0135666200880M2[t] -30.2559502272950M3[t] + 19.8816269382945M4[t] -2.28760544293282M5[t] -46.4191181022845M6[t] -34.5872551501615M7[t] -4.82314676287394M8[t] + 12.9111032358508M9[t] -46.7887484961442M10[t] -27.4271648752184M11[t] -0.447193297077627t + e[t]

\begin{tabular}{lllllllll}
\hline
Multiple Linear Regression - Estimated Regression Equation \tabularnewline
Y[t] =  +  79.0512126552317 +  1.22170757002387Y1[t] -0.190212790162334Y2[t] +  0.101091244492515Y3[t] -0.177636627855897Y4[t] -2.25135137660336M1[t] -15.0135666200880M2[t] -30.2559502272950M3[t] +  19.8816269382945M4[t] -2.28760544293282M5[t] -46.4191181022845M6[t] -34.5872551501615M7[t] -4.82314676287394M8[t] +  12.9111032358508M9[t] -46.7887484961442M10[t] -27.4271648752184M11[t] -0.447193297077627t  + e[t] \tabularnewline
\hline
\end{tabular}
%Source: https://freestatistics.org/blog/index.php?pk=57461&T=1

[TABLE]
[ROW][C]Multiple Linear Regression - Estimated Regression Equation[/C][/ROW]
[ROW][C]Y[t] =  +  79.0512126552317 +  1.22170757002387Y1[t] -0.190212790162334Y2[t] +  0.101091244492515Y3[t] -0.177636627855897Y4[t] -2.25135137660336M1[t] -15.0135666200880M2[t] -30.2559502272950M3[t] +  19.8816269382945M4[t] -2.28760544293282M5[t] -46.4191181022845M6[t] -34.5872551501615M7[t] -4.82314676287394M8[t] +  12.9111032358508M9[t] -46.7887484961442M10[t] -27.4271648752184M11[t] -0.447193297077627t  + e[t][/C][/ROW]
[/TABLE]
Source: https://freestatistics.org/blog/index.php?pk=57461&T=1

Globally Unique Identifier (entire table): ba.freestatistics.org/blog/index.php?pk=57461&T=1

As an alternative you can also use a QR Code:  

The GUIDs for individual cells are displayed in the table below:

Multiple Linear Regression - Estimated Regression Equation
Y[t] = + 79.0512126552317 + 1.22170757002387Y1[t] -0.190212790162334Y2[t] + 0.101091244492515Y3[t] -0.177636627855897Y4[t] -2.25135137660336M1[t] -15.0135666200880M2[t] -30.2559502272950M3[t] + 19.8816269382945M4[t] -2.28760544293282M5[t] -46.4191181022845M6[t] -34.5872551501615M7[t] -4.82314676287394M8[t] + 12.9111032358508M9[t] -46.7887484961442M10[t] -27.4271648752184M11[t] -0.447193297077627t + e[t]


Multiple Linear Regression - Ordinary Least Squares
VariableParameterS.D.T-STATH0: parameter = 02-tail p-value1-tail p-value
(Intercept)79.051212655231749.9678351.5820.1215160.060758
Y11.221707570023870.1561257.825200
Y2-0.1902127901623340.24768-0.7680.4470110.223506
Y30.1010912444925150.248630.40660.6864750.343237
Y4-0.1776366278558970.16147-1.10010.2778570.138928
M1-2.2513513766033640.124432-0.05610.9555340.477767
M2-15.013566620088040.392709-0.37170.7120850.356043
M3-30.255950227295039.929935-0.75770.4530560.226528
M419.881626938294539.6047210.5020.6184190.309209
M5-2.2876054429328240.225199-0.05690.9549320.477466
M6-46.419118102284541.346023-1.12270.2682590.13413
M7-34.587255150161540.345134-0.85730.3963950.198198
M8-4.8231467628739439.184145-0.12310.9026530.451326
M912.911103235850839.9482780.32320.7482310.374115
M10-46.788748496144242.251462-1.10740.2747410.137371
M11-27.427164875218442.237405-0.64940.5198190.25991
t-0.4471932970776270.555781-0.80460.4257950.212898

\begin{tabular}{lllllllll}
\hline
Multiple Linear Regression - Ordinary Least Squares \tabularnewline
Variable & Parameter & S.D. & T-STATH0: parameter = 0 & 2-tail p-value & 1-tail p-value \tabularnewline
(Intercept) & 79.0512126552317 & 49.967835 & 1.582 & 0.121516 & 0.060758 \tabularnewline
Y1 & 1.22170757002387 & 0.156125 & 7.8252 & 0 & 0 \tabularnewline
Y2 & -0.190212790162334 & 0.24768 & -0.768 & 0.447011 & 0.223506 \tabularnewline
Y3 & 0.101091244492515 & 0.24863 & 0.4066 & 0.686475 & 0.343237 \tabularnewline
Y4 & -0.177636627855897 & 0.16147 & -1.1001 & 0.277857 & 0.138928 \tabularnewline
M1 & -2.25135137660336 & 40.124432 & -0.0561 & 0.955534 & 0.477767 \tabularnewline
M2 & -15.0135666200880 & 40.392709 & -0.3717 & 0.712085 & 0.356043 \tabularnewline
M3 & -30.2559502272950 & 39.929935 & -0.7577 & 0.453056 & 0.226528 \tabularnewline
M4 & 19.8816269382945 & 39.604721 & 0.502 & 0.618419 & 0.309209 \tabularnewline
M5 & -2.28760544293282 & 40.225199 & -0.0569 & 0.954932 & 0.477466 \tabularnewline
M6 & -46.4191181022845 & 41.346023 & -1.1227 & 0.268259 & 0.13413 \tabularnewline
M7 & -34.5872551501615 & 40.345134 & -0.8573 & 0.396395 & 0.198198 \tabularnewline
M8 & -4.82314676287394 & 39.184145 & -0.1231 & 0.902653 & 0.451326 \tabularnewline
M9 & 12.9111032358508 & 39.948278 & 0.3232 & 0.748231 & 0.374115 \tabularnewline
M10 & -46.7887484961442 & 42.251462 & -1.1074 & 0.274741 & 0.137371 \tabularnewline
M11 & -27.4271648752184 & 42.237405 & -0.6494 & 0.519819 & 0.25991 \tabularnewline
t & -0.447193297077627 & 0.555781 & -0.8046 & 0.425795 & 0.212898 \tabularnewline
\hline
\end{tabular}
%Source: https://freestatistics.org/blog/index.php?pk=57461&T=2

[TABLE]
[ROW][C]Multiple Linear Regression - Ordinary Least Squares[/C][/ROW]
[ROW][C]Variable[/C][C]Parameter[/C][C]S.D.[/C][C]T-STATH0: parameter = 0[/C][C]2-tail p-value[/C][C]1-tail p-value[/C][/ROW]
[ROW][C](Intercept)[/C][C]79.0512126552317[/C][C]49.967835[/C][C]1.582[/C][C]0.121516[/C][C]0.060758[/C][/ROW]
[ROW][C]Y1[/C][C]1.22170757002387[/C][C]0.156125[/C][C]7.8252[/C][C]0[/C][C]0[/C][/ROW]
[ROW][C]Y2[/C][C]-0.190212790162334[/C][C]0.24768[/C][C]-0.768[/C][C]0.447011[/C][C]0.223506[/C][/ROW]
[ROW][C]Y3[/C][C]0.101091244492515[/C][C]0.24863[/C][C]0.4066[/C][C]0.686475[/C][C]0.343237[/C][/ROW]
[ROW][C]Y4[/C][C]-0.177636627855897[/C][C]0.16147[/C][C]-1.1001[/C][C]0.277857[/C][C]0.138928[/C][/ROW]
[ROW][C]M1[/C][C]-2.25135137660336[/C][C]40.124432[/C][C]-0.0561[/C][C]0.955534[/C][C]0.477767[/C][/ROW]
[ROW][C]M2[/C][C]-15.0135666200880[/C][C]40.392709[/C][C]-0.3717[/C][C]0.712085[/C][C]0.356043[/C][/ROW]
[ROW][C]M3[/C][C]-30.2559502272950[/C][C]39.929935[/C][C]-0.7577[/C][C]0.453056[/C][C]0.226528[/C][/ROW]
[ROW][C]M4[/C][C]19.8816269382945[/C][C]39.604721[/C][C]0.502[/C][C]0.618419[/C][C]0.309209[/C][/ROW]
[ROW][C]M5[/C][C]-2.28760544293282[/C][C]40.225199[/C][C]-0.0569[/C][C]0.954932[/C][C]0.477466[/C][/ROW]
[ROW][C]M6[/C][C]-46.4191181022845[/C][C]41.346023[/C][C]-1.1227[/C][C]0.268259[/C][C]0.13413[/C][/ROW]
[ROW][C]M7[/C][C]-34.5872551501615[/C][C]40.345134[/C][C]-0.8573[/C][C]0.396395[/C][C]0.198198[/C][/ROW]
[ROW][C]M8[/C][C]-4.82314676287394[/C][C]39.184145[/C][C]-0.1231[/C][C]0.902653[/C][C]0.451326[/C][/ROW]
[ROW][C]M9[/C][C]12.9111032358508[/C][C]39.948278[/C][C]0.3232[/C][C]0.748231[/C][C]0.374115[/C][/ROW]
[ROW][C]M10[/C][C]-46.7887484961442[/C][C]42.251462[/C][C]-1.1074[/C][C]0.274741[/C][C]0.137371[/C][/ROW]
[ROW][C]M11[/C][C]-27.4271648752184[/C][C]42.237405[/C][C]-0.6494[/C][C]0.519819[/C][C]0.25991[/C][/ROW]
[ROW][C]t[/C][C]-0.447193297077627[/C][C]0.555781[/C][C]-0.8046[/C][C]0.425795[/C][C]0.212898[/C][/ROW]
[/TABLE]
Source: https://freestatistics.org/blog/index.php?pk=57461&T=2

Globally Unique Identifier (entire table): ba.freestatistics.org/blog/index.php?pk=57461&T=2

As an alternative you can also use a QR Code:  

The GUIDs for individual cells are displayed in the table below:

Multiple Linear Regression - Ordinary Least Squares
VariableParameterS.D.T-STATH0: parameter = 02-tail p-value1-tail p-value
(Intercept)79.051212655231749.9678351.5820.1215160.060758
Y11.221707570023870.1561257.825200
Y2-0.1902127901623340.24768-0.7680.4470110.223506
Y30.1010912444925150.248630.40660.6864750.343237
Y4-0.1776366278558970.16147-1.10010.2778570.138928
M1-2.2513513766033640.124432-0.05610.9555340.477767
M2-15.013566620088040.392709-0.37170.7120850.356043
M3-30.255950227295039.929935-0.75770.4530560.226528
M419.881626938294539.6047210.5020.6184190.309209
M5-2.2876054429328240.225199-0.05690.9549320.477466
M6-46.419118102284541.346023-1.12270.2682590.13413
M7-34.587255150161540.345134-0.85730.3963950.198198
M8-4.8231467628739439.184145-0.12310.9026530.451326
M912.911103235850839.9482780.32320.7482310.374115
M10-46.788748496144242.251462-1.10740.2747410.137371
M11-27.427164875218442.237405-0.64940.5198190.25991
t-0.4471932970776270.555781-0.80460.4257950.212898


Multiple Linear Regression - Regression Statistics
Multiple R0.982897929705165
R-squared0.9660883402187
Adjusted R-squared0.95252367630618
F-TEST (value)71.2209566303373
F-TEST (DF numerator)16
F-TEST (DF denominator)40
p-value0
Multiple Linear Regression - Residual Statistics
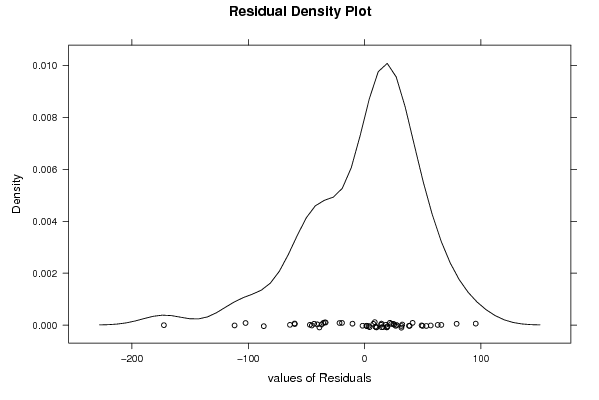
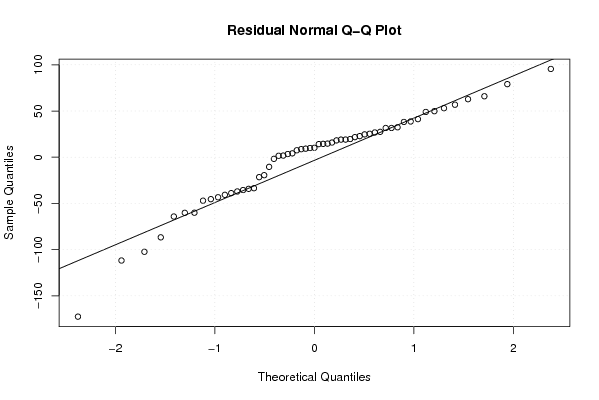
Residual Standard Deviation58.2136823939256
Sum Squared Residuals135553.312714434

\begin{tabular}{lllllllll}
\hline
Multiple Linear Regression - Regression Statistics \tabularnewline
Multiple R & 0.982897929705165 \tabularnewline
R-squared & 0.9660883402187 \tabularnewline
Adjusted R-squared & 0.95252367630618 \tabularnewline
F-TEST (value) & 71.2209566303373 \tabularnewline
F-TEST (DF numerator) & 16 \tabularnewline
F-TEST (DF denominator) & 40 \tabularnewline
p-value & 0 \tabularnewline
Multiple Linear Regression - Residual Statistics \tabularnewline
Residual Standard Deviation & 58.2136823939256 \tabularnewline
Sum Squared Residuals & 135553.312714434 \tabularnewline
\hline
\end{tabular}
%Source: https://freestatistics.org/blog/index.php?pk=57461&T=3

[TABLE]
[ROW][C]Multiple Linear Regression - Regression Statistics[/C][/ROW]
[ROW][C]Multiple R[/C][C]0.982897929705165[/C][/ROW]
[ROW][C]R-squared[/C][C]0.9660883402187[/C][/ROW]
[ROW][C]Adjusted R-squared[/C][C]0.95252367630618[/C][/ROW]
[ROW][C]F-TEST (value)[/C][C]71.2209566303373[/C][/ROW]
[ROW][C]F-TEST (DF numerator)[/C][C]16[/C][/ROW]
[ROW][C]F-TEST (DF denominator)[/C][C]40[/C][/ROW]
[ROW][C]p-value[/C][C]0[/C][/ROW]
[ROW][C]Multiple Linear Regression - Residual Statistics[/C][/ROW]
[ROW][C]Residual Standard Deviation[/C][C]58.2136823939256[/C][/ROW]
[ROW][C]Sum Squared Residuals[/C][C]135553.312714434[/C][/ROW]
[/TABLE]
Source: https://freestatistics.org/blog/index.php?pk=57461&T=3

Globally Unique Identifier (entire table): ba.freestatistics.org/blog/index.php?pk=57461&T=3

As an alternative you can also use a QR Code:  

The GUIDs for individual cells are displayed in the table below:

Multiple Linear Regression - Regression Statistics
Multiple R0.982897929705165
R-squared0.9660883402187
Adjusted R-squared0.95252367630618
F-TEST (value)71.2209566303373
F-TEST (DF numerator)16
F-TEST (DF denominator)40
p-value0
Multiple Linear Regression - Residual Statistics
Residual Standard Deviation58.2136823939256
Sum Squared Residuals135553.312714434


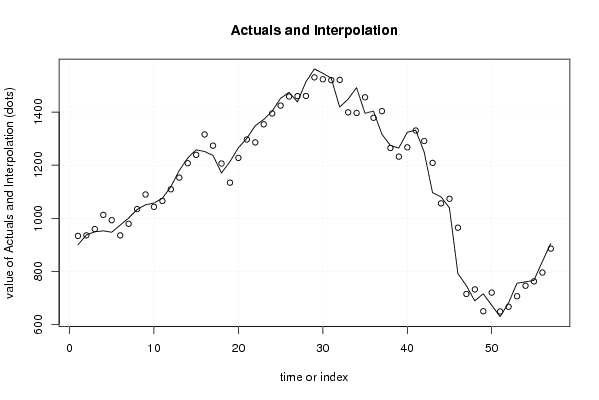
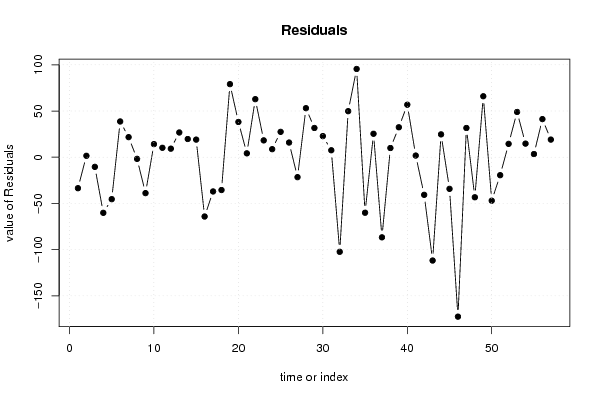
Multiple Linear Regression - Actuals, Interpolation, and Residuals
Time or IndexActualsInterpolationForecastResidualsPrediction Error
1900.1933.614463110231-33.5144631102308
2937.2935.668116630161.53188336983968
3948.9959.343664688369-10.4436646883692
4952.61012.75589466411-60.1558946641074
5947.3992.685340951903-45.3853409519027
6974.2935.52024621785538.6797537821453
71000.8979.07266635311121.7273336468889
81032.81034.57723963171-1.77723963171197
91050.71089.56010696029-38.8601069602897
101057.31043.1054199636314.1945800363729
111075.41065.1880568285210.2119431714796
121118.41109.150692194059.24930780595069
131179.81153.0302281044926.7697718955134
1412271207.3118641678819.6881358321249
151257.81238.7395198017419.0604801982637
161251.51315.64908054536-64.149080545358
171236.31273.34196102860-37.0419610285975
181170.61206.1208020814-35.5208020813991
191213.11134.0224358180879.0775641819209
201265.51227.3414267871738.1585732128252
211300.81296.620298556434.17970144357486
221348.41285.5994848857562.800515114247
231371.91353.7002685775418.1997314224607
241403.31394.596600870458.70339912954925
251451.81424.3310436012327.4689563987652
261474.21458.3219113553715.8780886446337
271438.21459.77306801919-21.5730680191946
281513.61460.5463481104253.0536518895771
291562.21530.5434010833831.6565989166172
301546.21523.3792933861722.8207066138288
311527.51519.989498756497.51050124350699
321418.71521.02311967186-102.323119671856
331448.51398.6947719052649.8052280947356
341492.11396.6015438062595.4984561937506
351395.41455.43712057642-60.0371205764203
361403.71378.3240766787725.3759233212263
371316.61403.27328839476-86.6732883947564
381274.51264.553904029829.94609597017573
391264.41232.0144916936332.3855083063729
401323.91267.0941561642356.8058438357697
411332.11330.30668897611.79331102390086
421250.21290.88580454257-40.6858045425652
431096.71208.46193832197-111.761938321974
441080.81056.0847377752324.7152622247725
451039.21073.40831413106-34.2083141310580
46792964.49355134437-172.493551344370
47746.6714.9745540175231.6254459824799
48688.8732.128630256726-43.3286302567264
49715.8649.85097678929165.9490232107087
50672.9719.944203816774-47.044203816774
51629.5648.929255797073-19.4292557970726
52681.2666.75452051588114.4454794841186
53755.4706.42260796001848.9773920399821
54760.6745.8938537720114.7061462279902
55765.9762.4534607503433.44653924965691
56836.8795.5734761340341.2265238659699
57904.9885.81650844696319.0834915530372

\begin{tabular}{lllllllll}
\hline
Multiple Linear Regression - Actuals, Interpolation, and Residuals \tabularnewline
Time or Index & Actuals & InterpolationForecast & ResidualsPrediction Error \tabularnewline
1 & 900.1 & 933.614463110231 & -33.5144631102308 \tabularnewline
2 & 937.2 & 935.66811663016 & 1.53188336983968 \tabularnewline
3 & 948.9 & 959.343664688369 & -10.4436646883692 \tabularnewline
4 & 952.6 & 1012.75589466411 & -60.1558946641074 \tabularnewline
5 & 947.3 & 992.685340951903 & -45.3853409519027 \tabularnewline
6 & 974.2 & 935.520246217855 & 38.6797537821453 \tabularnewline
7 & 1000.8 & 979.072666353111 & 21.7273336468889 \tabularnewline
8 & 1032.8 & 1034.57723963171 & -1.77723963171197 \tabularnewline
9 & 1050.7 & 1089.56010696029 & -38.8601069602897 \tabularnewline
10 & 1057.3 & 1043.10541996363 & 14.1945800363729 \tabularnewline
11 & 1075.4 & 1065.18805682852 & 10.2119431714796 \tabularnewline
12 & 1118.4 & 1109.15069219405 & 9.24930780595069 \tabularnewline
13 & 1179.8 & 1153.03022810449 & 26.7697718955134 \tabularnewline
14 & 1227 & 1207.31186416788 & 19.6881358321249 \tabularnewline
15 & 1257.8 & 1238.73951980174 & 19.0604801982637 \tabularnewline
16 & 1251.5 & 1315.64908054536 & -64.149080545358 \tabularnewline
17 & 1236.3 & 1273.34196102860 & -37.0419610285975 \tabularnewline
18 & 1170.6 & 1206.1208020814 & -35.5208020813991 \tabularnewline
19 & 1213.1 & 1134.02243581808 & 79.0775641819209 \tabularnewline
20 & 1265.5 & 1227.34142678717 & 38.1585732128252 \tabularnewline
21 & 1300.8 & 1296.62029855643 & 4.17970144357486 \tabularnewline
22 & 1348.4 & 1285.59948488575 & 62.800515114247 \tabularnewline
23 & 1371.9 & 1353.70026857754 & 18.1997314224607 \tabularnewline
24 & 1403.3 & 1394.59660087045 & 8.70339912954925 \tabularnewline
25 & 1451.8 & 1424.33104360123 & 27.4689563987652 \tabularnewline
26 & 1474.2 & 1458.32191135537 & 15.8780886446337 \tabularnewline
27 & 1438.2 & 1459.77306801919 & -21.5730680191946 \tabularnewline
28 & 1513.6 & 1460.54634811042 & 53.0536518895771 \tabularnewline
29 & 1562.2 & 1530.54340108338 & 31.6565989166172 \tabularnewline
30 & 1546.2 & 1523.37929338617 & 22.8207066138288 \tabularnewline
31 & 1527.5 & 1519.98949875649 & 7.51050124350699 \tabularnewline
32 & 1418.7 & 1521.02311967186 & -102.323119671856 \tabularnewline
33 & 1448.5 & 1398.69477190526 & 49.8052280947356 \tabularnewline
34 & 1492.1 & 1396.60154380625 & 95.4984561937506 \tabularnewline
35 & 1395.4 & 1455.43712057642 & -60.0371205764203 \tabularnewline
36 & 1403.7 & 1378.32407667877 & 25.3759233212263 \tabularnewline
37 & 1316.6 & 1403.27328839476 & -86.6732883947564 \tabularnewline
38 & 1274.5 & 1264.55390402982 & 9.94609597017573 \tabularnewline
39 & 1264.4 & 1232.01449169363 & 32.3855083063729 \tabularnewline
40 & 1323.9 & 1267.09415616423 & 56.8058438357697 \tabularnewline
41 & 1332.1 & 1330.3066889761 & 1.79331102390086 \tabularnewline
42 & 1250.2 & 1290.88580454257 & -40.6858045425652 \tabularnewline
43 & 1096.7 & 1208.46193832197 & -111.761938321974 \tabularnewline
44 & 1080.8 & 1056.08473777523 & 24.7152622247725 \tabularnewline
45 & 1039.2 & 1073.40831413106 & -34.2083141310580 \tabularnewline
46 & 792 & 964.49355134437 & -172.493551344370 \tabularnewline
47 & 746.6 & 714.97455401752 & 31.6254459824799 \tabularnewline
48 & 688.8 & 732.128630256726 & -43.3286302567264 \tabularnewline
49 & 715.8 & 649.850976789291 & 65.9490232107087 \tabularnewline
50 & 672.9 & 719.944203816774 & -47.044203816774 \tabularnewline
51 & 629.5 & 648.929255797073 & -19.4292557970726 \tabularnewline
52 & 681.2 & 666.754520515881 & 14.4454794841186 \tabularnewline
53 & 755.4 & 706.422607960018 & 48.9773920399821 \tabularnewline
54 & 760.6 & 745.89385377201 & 14.7061462279902 \tabularnewline
55 & 765.9 & 762.453460750343 & 3.44653924965691 \tabularnewline
56 & 836.8 & 795.57347613403 & 41.2265238659699 \tabularnewline
57 & 904.9 & 885.816508446963 & 19.0834915530372 \tabularnewline
\hline
\end{tabular}
%Source: https://freestatistics.org/blog/index.php?pk=57461&T=4

[TABLE]
[ROW][C]Multiple Linear Regression - Actuals, Interpolation, and Residuals[/C][/ROW]
[ROW][C]Time or Index[/C][C]Actuals[/C][C]InterpolationForecast[/C][C]ResidualsPrediction Error[/C][/ROW]
[ROW][C]1[/C][C]900.1[/C][C]933.614463110231[/C][C]-33.5144631102308[/C][/ROW]
[ROW][C]2[/C][C]937.2[/C][C]935.66811663016[/C][C]1.53188336983968[/C][/ROW]
[ROW][C]3[/C][C]948.9[/C][C]959.343664688369[/C][C]-10.4436646883692[/C][/ROW]
[ROW][C]4[/C][C]952.6[/C][C]1012.75589466411[/C][C]-60.1558946641074[/C][/ROW]
[ROW][C]5[/C][C]947.3[/C][C]992.685340951903[/C][C]-45.3853409519027[/C][/ROW]
[ROW][C]6[/C][C]974.2[/C][C]935.520246217855[/C][C]38.6797537821453[/C][/ROW]
[ROW][C]7[/C][C]1000.8[/C][C]979.072666353111[/C][C]21.7273336468889[/C][/ROW]
[ROW][C]8[/C][C]1032.8[/C][C]1034.57723963171[/C][C]-1.77723963171197[/C][/ROW]
[ROW][C]9[/C][C]1050.7[/C][C]1089.56010696029[/C][C]-38.8601069602897[/C][/ROW]
[ROW][C]10[/C][C]1057.3[/C][C]1043.10541996363[/C][C]14.1945800363729[/C][/ROW]
[ROW][C]11[/C][C]1075.4[/C][C]1065.18805682852[/C][C]10.2119431714796[/C][/ROW]
[ROW][C]12[/C][C]1118.4[/C][C]1109.15069219405[/C][C]9.24930780595069[/C][/ROW]
[ROW][C]13[/C][C]1179.8[/C][C]1153.03022810449[/C][C]26.7697718955134[/C][/ROW]
[ROW][C]14[/C][C]1227[/C][C]1207.31186416788[/C][C]19.6881358321249[/C][/ROW]
[ROW][C]15[/C][C]1257.8[/C][C]1238.73951980174[/C][C]19.0604801982637[/C][/ROW]
[ROW][C]16[/C][C]1251.5[/C][C]1315.64908054536[/C][C]-64.149080545358[/C][/ROW]
[ROW][C]17[/C][C]1236.3[/C][C]1273.34196102860[/C][C]-37.0419610285975[/C][/ROW]
[ROW][C]18[/C][C]1170.6[/C][C]1206.1208020814[/C][C]-35.5208020813991[/C][/ROW]
[ROW][C]19[/C][C]1213.1[/C][C]1134.02243581808[/C][C]79.0775641819209[/C][/ROW]
[ROW][C]20[/C][C]1265.5[/C][C]1227.34142678717[/C][C]38.1585732128252[/C][/ROW]
[ROW][C]21[/C][C]1300.8[/C][C]1296.62029855643[/C][C]4.17970144357486[/C][/ROW]
[ROW][C]22[/C][C]1348.4[/C][C]1285.59948488575[/C][C]62.800515114247[/C][/ROW]
[ROW][C]23[/C][C]1371.9[/C][C]1353.70026857754[/C][C]18.1997314224607[/C][/ROW]
[ROW][C]24[/C][C]1403.3[/C][C]1394.59660087045[/C][C]8.70339912954925[/C][/ROW]
[ROW][C]25[/C][C]1451.8[/C][C]1424.33104360123[/C][C]27.4689563987652[/C][/ROW]
[ROW][C]26[/C][C]1474.2[/C][C]1458.32191135537[/C][C]15.8780886446337[/C][/ROW]
[ROW][C]27[/C][C]1438.2[/C][C]1459.77306801919[/C][C]-21.5730680191946[/C][/ROW]
[ROW][C]28[/C][C]1513.6[/C][C]1460.54634811042[/C][C]53.0536518895771[/C][/ROW]
[ROW][C]29[/C][C]1562.2[/C][C]1530.54340108338[/C][C]31.6565989166172[/C][/ROW]
[ROW][C]30[/C][C]1546.2[/C][C]1523.37929338617[/C][C]22.8207066138288[/C][/ROW]
[ROW][C]31[/C][C]1527.5[/C][C]1519.98949875649[/C][C]7.51050124350699[/C][/ROW]
[ROW][C]32[/C][C]1418.7[/C][C]1521.02311967186[/C][C]-102.323119671856[/C][/ROW]
[ROW][C]33[/C][C]1448.5[/C][C]1398.69477190526[/C][C]49.8052280947356[/C][/ROW]
[ROW][C]34[/C][C]1492.1[/C][C]1396.60154380625[/C][C]95.4984561937506[/C][/ROW]
[ROW][C]35[/C][C]1395.4[/C][C]1455.43712057642[/C][C]-60.0371205764203[/C][/ROW]
[ROW][C]36[/C][C]1403.7[/C][C]1378.32407667877[/C][C]25.3759233212263[/C][/ROW]
[ROW][C]37[/C][C]1316.6[/C][C]1403.27328839476[/C][C]-86.6732883947564[/C][/ROW]
[ROW][C]38[/C][C]1274.5[/C][C]1264.55390402982[/C][C]9.94609597017573[/C][/ROW]
[ROW][C]39[/C][C]1264.4[/C][C]1232.01449169363[/C][C]32.3855083063729[/C][/ROW]
[ROW][C]40[/C][C]1323.9[/C][C]1267.09415616423[/C][C]56.8058438357697[/C][/ROW]
[ROW][C]41[/C][C]1332.1[/C][C]1330.3066889761[/C][C]1.79331102390086[/C][/ROW]
[ROW][C]42[/C][C]1250.2[/C][C]1290.88580454257[/C][C]-40.6858045425652[/C][/ROW]
[ROW][C]43[/C][C]1096.7[/C][C]1208.46193832197[/C][C]-111.761938321974[/C][/ROW]
[ROW][C]44[/C][C]1080.8[/C][C]1056.08473777523[/C][C]24.7152622247725[/C][/ROW]
[ROW][C]45[/C][C]1039.2[/C][C]1073.40831413106[/C][C]-34.2083141310580[/C][/ROW]
[ROW][C]46[/C][C]792[/C][C]964.49355134437[/C][C]-172.493551344370[/C][/ROW]
[ROW][C]47[/C][C]746.6[/C][C]714.97455401752[/C][C]31.6254459824799[/C][/ROW]
[ROW][C]48[/C][C]688.8[/C][C]732.128630256726[/C][C]-43.3286302567264[/C][/ROW]
[ROW][C]49[/C][C]715.8[/C][C]649.850976789291[/C][C]65.9490232107087[/C][/ROW]
[ROW][C]50[/C][C]672.9[/C][C]719.944203816774[/C][C]-47.044203816774[/C][/ROW]
[ROW][C]51[/C][C]629.5[/C][C]648.929255797073[/C][C]-19.4292557970726[/C][/ROW]
[ROW][C]52[/C][C]681.2[/C][C]666.754520515881[/C][C]14.4454794841186[/C][/ROW]
[ROW][C]53[/C][C]755.4[/C][C]706.422607960018[/C][C]48.9773920399821[/C][/ROW]
[ROW][C]54[/C][C]760.6[/C][C]745.89385377201[/C][C]14.7061462279902[/C][/ROW]
[ROW][C]55[/C][C]765.9[/C][C]762.453460750343[/C][C]3.44653924965691[/C][/ROW]
[ROW][C]56[/C][C]836.8[/C][C]795.57347613403[/C][C]41.2265238659699[/C][/ROW]
[ROW][C]57[/C][C]904.9[/C][C]885.816508446963[/C][C]19.0834915530372[/C][/ROW]
[/TABLE]
Source: https://freestatistics.org/blog/index.php?pk=57461&T=4

Globally Unique Identifier (entire table): ba.freestatistics.org/blog/index.php?pk=57461&T=4

As an alternative you can also use a QR Code:  

The GUIDs for individual cells are displayed in the table below:

Multiple Linear Regression - Actuals, Interpolation, and Residuals
Time or IndexActualsInterpolationForecastResidualsPrediction Error
1900.1933.614463110231-33.5144631102308
2937.2935.668116630161.53188336983968
3948.9959.343664688369-10.4436646883692
4952.61012.75589466411-60.1558946641074
5947.3992.685340951903-45.3853409519027
6974.2935.52024621785538.6797537821453
71000.8979.07266635311121.7273336468889
81032.81034.57723963171-1.77723963171197
91050.71089.56010696029-38.8601069602897
101057.31043.1054199636314.1945800363729
111075.41065.1880568285210.2119431714796
121118.41109.150692194059.24930780595069
131179.81153.0302281044926.7697718955134
1412271207.3118641678819.6881358321249
151257.81238.7395198017419.0604801982637
161251.51315.64908054536-64.149080545358
171236.31273.34196102860-37.0419610285975
181170.61206.1208020814-35.5208020813991
191213.11134.0224358180879.0775641819209
201265.51227.3414267871738.1585732128252
211300.81296.620298556434.17970144357486
221348.41285.5994848857562.800515114247
231371.91353.7002685775418.1997314224607
241403.31394.596600870458.70339912954925
251451.81424.3310436012327.4689563987652
261474.21458.3219113553715.8780886446337
271438.21459.77306801919-21.5730680191946
281513.61460.5463481104253.0536518895771
291562.21530.5434010833831.6565989166172
301546.21523.3792933861722.8207066138288
311527.51519.989498756497.51050124350699
321418.71521.02311967186-102.323119671856
331448.51398.6947719052649.8052280947356
341492.11396.6015438062595.4984561937506
351395.41455.43712057642-60.0371205764203
361403.71378.3240766787725.3759233212263
371316.61403.27328839476-86.6732883947564
381274.51264.553904029829.94609597017573
391264.41232.0144916936332.3855083063729
401323.91267.0941561642356.8058438357697
411332.11330.30668897611.79331102390086
421250.21290.88580454257-40.6858045425652
431096.71208.46193832197-111.761938321974
441080.81056.0847377752324.7152622247725
451039.21073.40831413106-34.2083141310580
46792964.49355134437-172.493551344370
47746.6714.9745540175231.6254459824799
48688.8732.128630256726-43.3286302567264
49715.8649.85097678929165.9490232107087
50672.9719.944203816774-47.044203816774
51629.5648.929255797073-19.4292557970726
52681.2666.75452051588114.4454794841186
53755.4706.42260796001848.9773920399821
54760.6745.8938537720114.7061462279902
55765.9762.4534607503433.44653924965691
56836.8795.5734761340341.2265238659699
57904.9885.81650844696319.0834915530372


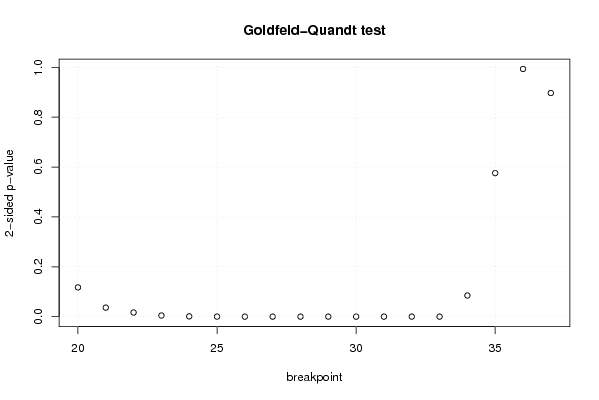
Goldfeld-Quandt test for Heteroskedasticity
p-valuesAlternative Hypothesis
breakpoint indexgreater2-sidedless
200.0586642998366550.117328599673310.941335700163345
210.01810925741429660.03621851482859310.981890742585703
220.008324878115786540.01664975623157310.991675121884213
230.002277211627179860.004554423254359730.99772278837282
240.0005589880332356090.001117976066471220.999441011966764
250.0001379007149211330.0002758014298422670.99986209928508
262.78154198675450e-055.56308397350901e-050.999972184580132
275.12659393335787e-050.0001025318786671570.999948734060666
283.3976282187298e-056.7952564374596e-050.999966023717813
296.02092513677025e-050.0001204185027354050.999939790748632
303.00680178163322e-056.01360356326644e-050.999969931982184
318.82534245482924e-061.76506849096585e-050.999991174657545
320.0001028359474094230.0002056718948188470.99989716405259
333.8590299001552e-057.7180598003104e-050.999961409700998
340.04244405413416210.08488810826832420.957555945865838
350.2878856530375010.5757713060750010.7121143469625
360.4968645838529780.9937291677059560.503135416147022
370.4485909643193390.8971819286386790.551409035680661

\begin{tabular}{lllllllll}
\hline
Goldfeld-Quandt test for Heteroskedasticity \tabularnewline
p-values & Alternative Hypothesis \tabularnewline
breakpoint index & greater & 2-sided & less \tabularnewline
20 & 0.058664299836655 & 0.11732859967331 & 0.941335700163345 \tabularnewline
21 & 0.0181092574142966 & 0.0362185148285931 & 0.981890742585703 \tabularnewline
22 & 0.00832487811578654 & 0.0166497562315731 & 0.991675121884213 \tabularnewline
23 & 0.00227721162717986 & 0.00455442325435973 & 0.99772278837282 \tabularnewline
24 & 0.000558988033235609 & 0.00111797606647122 & 0.999441011966764 \tabularnewline
25 & 0.000137900714921133 & 0.000275801429842267 & 0.99986209928508 \tabularnewline
26 & 2.78154198675450e-05 & 5.56308397350901e-05 & 0.999972184580132 \tabularnewline
27 & 5.12659393335787e-05 & 0.000102531878667157 & 0.999948734060666 \tabularnewline
28 & 3.3976282187298e-05 & 6.7952564374596e-05 & 0.999966023717813 \tabularnewline
29 & 6.02092513677025e-05 & 0.000120418502735405 & 0.999939790748632 \tabularnewline
30 & 3.00680178163322e-05 & 6.01360356326644e-05 & 0.999969931982184 \tabularnewline
31 & 8.82534245482924e-06 & 1.76506849096585e-05 & 0.999991174657545 \tabularnewline
32 & 0.000102835947409423 & 0.000205671894818847 & 0.99989716405259 \tabularnewline
33 & 3.8590299001552e-05 & 7.7180598003104e-05 & 0.999961409700998 \tabularnewline
34 & 0.0424440541341621 & 0.0848881082683242 & 0.957555945865838 \tabularnewline
35 & 0.287885653037501 & 0.575771306075001 & 0.7121143469625 \tabularnewline
36 & 0.496864583852978 & 0.993729167705956 & 0.503135416147022 \tabularnewline
37 & 0.448590964319339 & 0.897181928638679 & 0.551409035680661 \tabularnewline
\hline
\end{tabular}
%Source: https://freestatistics.org/blog/index.php?pk=57461&T=5

[TABLE]
[ROW][C]Goldfeld-Quandt test for Heteroskedasticity[/C][/ROW]
[ROW][C]p-values[/C][C]Alternative Hypothesis[/C][/ROW]
[ROW][C]breakpoint index[/C][C]greater[/C][C]2-sided[/C][C]less[/C][/ROW]
[ROW][C]20[/C][C]0.058664299836655[/C][C]0.11732859967331[/C][C]0.941335700163345[/C][/ROW]
[ROW][C]21[/C][C]0.0181092574142966[/C][C]0.0362185148285931[/C][C]0.981890742585703[/C][/ROW]
[ROW][C]22[/C][C]0.00832487811578654[/C][C]0.0166497562315731[/C][C]0.991675121884213[/C][/ROW]
[ROW][C]23[/C][C]0.00227721162717986[/C][C]0.00455442325435973[/C][C]0.99772278837282[/C][/ROW]
[ROW][C]24[/C][C]0.000558988033235609[/C][C]0.00111797606647122[/C][C]0.999441011966764[/C][/ROW]
[ROW][C]25[/C][C]0.000137900714921133[/C][C]0.000275801429842267[/C][C]0.99986209928508[/C][/ROW]
[ROW][C]26[/C][C]2.78154198675450e-05[/C][C]5.56308397350901e-05[/C][C]0.999972184580132[/C][/ROW]
[ROW][C]27[/C][C]5.12659393335787e-05[/C][C]0.000102531878667157[/C][C]0.999948734060666[/C][/ROW]
[ROW][C]28[/C][C]3.3976282187298e-05[/C][C]6.7952564374596e-05[/C][C]0.999966023717813[/C][/ROW]
[ROW][C]29[/C][C]6.02092513677025e-05[/C][C]0.000120418502735405[/C][C]0.999939790748632[/C][/ROW]
[ROW][C]30[/C][C]3.00680178163322e-05[/C][C]6.01360356326644e-05[/C][C]0.999969931982184[/C][/ROW]
[ROW][C]31[/C][C]8.82534245482924e-06[/C][C]1.76506849096585e-05[/C][C]0.999991174657545[/C][/ROW]
[ROW][C]32[/C][C]0.000102835947409423[/C][C]0.000205671894818847[/C][C]0.99989716405259[/C][/ROW]
[ROW][C]33[/C][C]3.8590299001552e-05[/C][C]7.7180598003104e-05[/C][C]0.999961409700998[/C][/ROW]
[ROW][C]34[/C][C]0.0424440541341621[/C][C]0.0848881082683242[/C][C]0.957555945865838[/C][/ROW]
[ROW][C]35[/C][C]0.287885653037501[/C][C]0.575771306075001[/C][C]0.7121143469625[/C][/ROW]
[ROW][C]36[/C][C]0.496864583852978[/C][C]0.993729167705956[/C][C]0.503135416147022[/C][/ROW]
[ROW][C]37[/C][C]0.448590964319339[/C][C]0.897181928638679[/C][C]0.551409035680661[/C][/ROW]
[/TABLE]
Source: https://freestatistics.org/blog/index.php?pk=57461&T=5

Globally Unique Identifier (entire table): ba.freestatistics.org/blog/index.php?pk=57461&T=5

As an alternative you can also use a QR Code:  

The GUIDs for individual cells are displayed in the table below:

Goldfeld-Quandt test for Heteroskedasticity
p-valuesAlternative Hypothesis
breakpoint indexgreater2-sidedless
200.0586642998366550.117328599673310.941335700163345
210.01810925741429660.03621851482859310.981890742585703
220.008324878115786540.01664975623157310.991675121884213
230.002277211627179860.004554423254359730.99772278837282
240.0005589880332356090.001117976066471220.999441011966764
250.0001379007149211330.0002758014298422670.99986209928508
262.78154198675450e-055.56308397350901e-050.999972184580132
275.12659393335787e-050.0001025318786671570.999948734060666
283.3976282187298e-056.7952564374596e-050.999966023717813
296.02092513677025e-050.0001204185027354050.999939790748632
303.00680178163322e-056.01360356326644e-050.999969931982184
318.82534245482924e-061.76506849096585e-050.999991174657545
320.0001028359474094230.0002056718948188470.99989716405259
333.8590299001552e-057.7180598003104e-050.999961409700998
340.04244405413416210.08488810826832420.957555945865838
350.2878856530375010.5757713060750010.7121143469625
360.4968645838529780.9937291677059560.503135416147022
370.4485909643193390.8971819286386790.551409035680661


Meta Analysis of Goldfeld-Quandt test for Heteroskedasticity
Description# significant tests% significant testsOK/NOK
1% type I error level110.611111111111111NOK
5% type I error level130.722222222222222NOK
10% type I error level140.777777777777778NOK

\begin{tabular}{lllllllll}
\hline
Meta Analysis of Goldfeld-Quandt test for Heteroskedasticity \tabularnewline
Description & # significant tests & % significant tests & OK/NOK \tabularnewline
1% type I error level & 11 & 0.611111111111111 & NOK \tabularnewline
5% type I error level & 13 & 0.722222222222222 & NOK \tabularnewline
10% type I error level & 14 & 0.777777777777778 & NOK \tabularnewline
\hline
\end{tabular}
%Source: https://freestatistics.org/blog/index.php?pk=57461&T=6

[TABLE]
[ROW][C]Meta Analysis of Goldfeld-Quandt test for Heteroskedasticity[/C][/ROW]
[ROW][C]Description[/C][C]# significant tests[/C][C]% significant tests[/C][C]OK/NOK[/C][/ROW]
[ROW][C]1% type I error level[/C][C]11[/C][C]0.611111111111111[/C][C]NOK[/C][/ROW]
[ROW][C]5% type I error level[/C][C]13[/C][C]0.722222222222222[/C][C]NOK[/C][/ROW]
[ROW][C]10% type I error level[/C][C]14[/C][C]0.777777777777778[/C][C]NOK[/C][/ROW]
[/TABLE]
Source: https://freestatistics.org/blog/index.php?pk=57461&T=6

Globally Unique Identifier (entire table): ba.freestatistics.org/blog/index.php?pk=57461&T=6

As an alternative you can also use a QR Code:  

The GUIDs for individual cells are displayed in the table below:

Meta Analysis of Goldfeld-Quandt test for Heteroskedasticity
Description# significant tests% significant testsOK/NOK
1% type I error level110.611111111111111NOK
5% type I error level130.722222222222222NOK
10% type I error level140.777777777777778NOK


Parameters (Session):
par1 = 1 ; par2 = Include Monthly Dummies ; par3 = Linear Trend ;
Parameters (R input):
par1 = 1 ; par2 = Include Monthly Dummies ; par3 = Linear Trend ;
R code (references can be found in the software module):
library(lattice)
library(lmtest)
n25 <- 25 #minimum number of obs. for Goldfeld-Quandt test
par1 <- as.numeric(par1)
x <- t(y)
k <- length(x[1,])
n <- length(x[,1])
x1 <- cbind(x[,par1], x[,1:k!=par1])
mycolnames <- c(colnames(x)[par1], colnames(x)[1:k!=par1])
colnames(x1) <- mycolnames #colnames(x)[par1]
x <- x1
if (par3 == 'First Differences'){
x2 <- array(0, dim=c(n-1,k), dimnames=list(1:(n-1), paste('(1-B)',colnames(x),sep='')))
for (i in 1:n-1) {
for (j in 1:k) {
x2[i,j] <- x[i+1,j] - x[i,j]
}
}
x <- x2
}
if (par2 == 'Include Monthly Dummies'){
x2 <- array(0, dim=c(n,11), dimnames=list(1:n, paste('M', seq(1:11), sep ='')))
for (i in 1:11){
x2[seq(i,n,12),i] <- 1
}
x <- cbind(x, x2)
}
if (par2 == 'Include Quarterly Dummies'){
x2 <- array(0, dim=c(n,3), dimnames=list(1:n, paste('Q', seq(1:3), sep ='')))
for (i in 1:3){
x2[seq(i,n,4),i] <- 1
}
x <- cbind(x, x2)
}
k <- length(x[1,])
if (par3 == 'Linear Trend'){
x <- cbind(x, c(1:n))
colnames(x)[k+1] <- 't'
}
x
k <- length(x[1,])
df <- as.data.frame(x)
(mylm <- lm(df))
(mysum <- summary(mylm))
if (n > n25) {
kp3 <- k + 3
nmkm3 <- n - k - 3
gqarr <- array(NA, dim=c(nmkm3-kp3+1,3))
numgqtests <- 0
numsignificant1 <- 0
numsignificant5 <- 0
numsignificant10 <- 0
for (mypoint in kp3:nmkm3) {
j <- 0
numgqtests <- numgqtests + 1
for (myalt in c('greater', 'two.sided', 'less')) {
j <- j + 1
gqarr[mypoint-kp3+1,j] <- gqtest(mylm, point=mypoint, alternative=myalt)$p.value
}
if (gqarr[mypoint-kp3+1,2] < 0.01) numsignificant1 <- numsignificant1 + 1
if (gqarr[mypoint-kp3+1,2] < 0.05) numsignificant5 <- numsignificant5 + 1
if (gqarr[mypoint-kp3+1,2] < 0.10) numsignificant10 <- numsignificant10 + 1
}
gqarr
}
bitmap(file='test0.png')
plot(x[,1], type='l', main='Actuals and Interpolation', ylab='value of Actuals and Interpolation (dots)', xlab='time or index')
points(x[,1]-mysum$resid)
grid()
dev.off()
bitmap(file='test1.png')
plot(mysum$resid, type='b', pch=19, main='Residuals', ylab='value of Residuals', xlab='time or index')
grid()
dev.off()
bitmap(file='test2.png')
hist(mysum$resid, main='Residual Histogram', xlab='values of Residuals')
grid()
dev.off()
bitmap(file='test3.png')
densityplot(~mysum$resid,col='black',main='Residual Density Plot', xlab='values of Residuals')
dev.off()
bitmap(file='test4.png')
qqnorm(mysum$resid, main='Residual Normal Q-Q Plot')
qqline(mysum$resid)
grid()
dev.off()
(myerror <- as.ts(mysum$resid))
bitmap(file='test5.png')
dum <- cbind(lag(myerror,k=1),myerror)
dum
dum1 <- dum[2:length(myerror),]
dum1
z <- as.data.frame(dum1)
z
plot(z,main=paste('Residual Lag plot, lowess, and regression line'), ylab='values of Residuals', xlab='lagged values of Residuals')
lines(lowess(z))
abline(lm(z))
grid()
dev.off()
bitmap(file='test6.png')
acf(mysum$resid, lag.max=length(mysum$resid)/2, main='Residual Autocorrelation Function')
grid()
dev.off()
bitmap(file='test7.png')
pacf(mysum$resid, lag.max=length(mysum$resid)/2, main='Residual Partial Autocorrelation Function')
grid()
dev.off()
bitmap(file='test8.png')
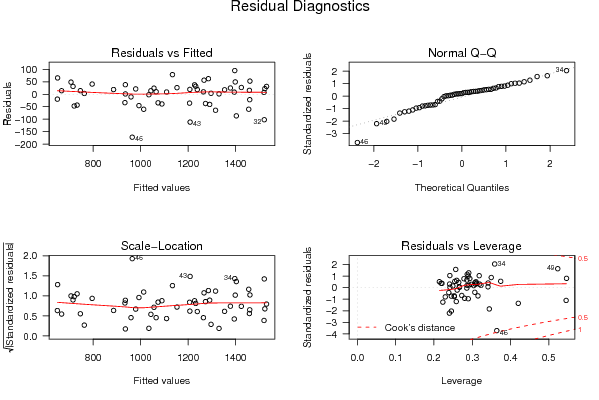
opar <- par(mfrow = c(2,2), oma = c(0, 0, 1.1, 0))
plot(mylm, las = 1, sub='Residual Diagnostics')
par(opar)
dev.off()
if (n > n25) {
bitmap(file='test9.png')
plot(kp3:nmkm3,gqarr[,2], main='Goldfeld-Quandt test',ylab='2-sided p-value',xlab='breakpoint')
grid()
dev.off()
}
load(file='createtable')
a<-table.start()
a<-table.row.start(a)
a<-table.element(a, 'Multiple Linear Regression - Estimated Regression Equation', 1, TRUE)
a<-table.row.end(a)
myeq <- colnames(x)[1]
myeq <- paste(myeq, '[t] = ', sep='')
for (i in 1:k){
if (mysum$coefficients[i,1] > 0) myeq <- paste(myeq, '+', '')
myeq <- paste(myeq, mysum$coefficients[i,1], sep=' ')
if (rownames(mysum$coefficients)[i] != '(Intercept)') {
myeq <- paste(myeq, rownames(mysum$coefficients)[i], sep='')
if (rownames(mysum$coefficients)[i] != 't') myeq <- paste(myeq, '[t]', sep='')
}
}
myeq <- paste(myeq, ' + e[t]')
a<-table.row.start(a)
a<-table.element(a, myeq)
a<-table.row.end(a)
a<-table.end(a)
table.save(a,file='mytable1.tab')
a<-table.start()
a<-table.row.start(a)
a<-table.element(a,hyperlink('ols1.htm','Multiple Linear Regression - Ordinary Least Squares',''), 6, TRUE)
a<-table.row.end(a)
a<-table.row.start(a)
a<-table.element(a,'Variable',header=TRUE)
a<-table.element(a,'Parameter',header=TRUE)
a<-table.element(a,'S.D.',header=TRUE)
a<-table.element(a,'T-STAT
H0: parameter = 0',header=TRUE)
a<-table.element(a,'2-tail p-value',header=TRUE)
a<-table.element(a,'1-tail p-value',header=TRUE)
a<-table.row.end(a)
for (i in 1:k){
a<-table.row.start(a)
a<-table.element(a,rownames(mysum$coefficients)[i],header=TRUE)
a<-table.element(a,mysum$coefficients[i,1])
a<-table.element(a, round(mysum$coefficients[i,2],6))
a<-table.element(a, round(mysum$coefficients[i,3],4))
a<-table.element(a, round(mysum$coefficients[i,4],6))
a<-table.element(a, round(mysum$coefficients[i,4]/2,6))
a<-table.row.end(a)
}
a<-table.end(a)
table.save(a,file='mytable2.tab')
a<-table.start()
a<-table.row.start(a)
a<-table.element(a, 'Multiple Linear Regression - Regression Statistics', 2, TRUE)
a<-table.row.end(a)
a<-table.row.start(a)
a<-table.element(a, 'Multiple R',1,TRUE)
a<-table.element(a, sqrt(mysum$r.squared))
a<-table.row.end(a)
a<-table.row.start(a)
a<-table.element(a, 'R-squared',1,TRUE)
a<-table.element(a, mysum$r.squared)
a<-table.row.end(a)
a<-table.row.start(a)
a<-table.element(a, 'Adjusted R-squared',1,TRUE)
a<-table.element(a, mysum$adj.r.squared)
a<-table.row.end(a)
a<-table.row.start(a)
a<-table.element(a, 'F-TEST (value)',1,TRUE)
a<-table.element(a, mysum$fstatistic[1])
a<-table.row.end(a)
a<-table.row.start(a)
a<-table.element(a, 'F-TEST (DF numerator)',1,TRUE)
a<-table.element(a, mysum$fstatistic[2])
a<-table.row.end(a)
a<-table.row.start(a)
a<-table.element(a, 'F-TEST (DF denominator)',1,TRUE)
a<-table.element(a, mysum$fstatistic[3])
a<-table.row.end(a)
a<-table.row.start(a)
a<-table.element(a, 'p-value',1,TRUE)
a<-table.element(a, 1-pf(mysum$fstatistic[1],mysum$fstatistic[2],mysum$fstatistic[3]))
a<-table.row.end(a)
a<-table.row.start(a)
a<-table.element(a, 'Multiple Linear Regression - Residual Statistics', 2, TRUE)
a<-table.row.end(a)
a<-table.row.start(a)
a<-table.element(a, 'Residual Standard Deviation',1,TRUE)
a<-table.element(a, mysum$sigma)
a<-table.row.end(a)
a<-table.row.start(a)
a<-table.element(a, 'Sum Squared Residuals',1,TRUE)
a<-table.element(a, sum(myerror*myerror))
a<-table.row.end(a)
a<-table.end(a)
table.save(a,file='mytable3.tab')
a<-table.start()
a<-table.row.start(a)
a<-table.element(a, 'Multiple Linear Regression - Actuals, Interpolation, and Residuals', 4, TRUE)
a<-table.row.end(a)
a<-table.row.start(a)
a<-table.element(a, 'Time or Index', 1, TRUE)
a<-table.element(a, 'Actuals', 1, TRUE)
a<-table.element(a, 'Interpolation
Forecast', 1, TRUE)
a<-table.element(a, 'Residuals
Prediction Error', 1, TRUE)
a<-table.row.end(a)
for (i in 1:n) {
a<-table.row.start(a)
a<-table.element(a,i, 1, TRUE)
a<-table.element(a,x[i])
a<-table.element(a,x[i]-mysum$resid[i])
a<-table.element(a,mysum$resid[i])
a<-table.row.end(a)
}
a<-table.end(a)
table.save(a,file='mytable4.tab')
if (n > n25) {
a<-table.start()
a<-table.row.start(a)
a<-table.element(a,'Goldfeld-Quandt test for Heteroskedasticity',4,TRUE)
a<-table.row.end(a)
a<-table.row.start(a)
a<-table.element(a,'p-values',header=TRUE)
a<-table.element(a,'Alternative Hypothesis',3,header=TRUE)
a<-table.row.end(a)
a<-table.row.start(a)
a<-table.element(a,'breakpoint index',header=TRUE)
a<-table.element(a,'greater',header=TRUE)
a<-table.element(a,'2-sided',header=TRUE)
a<-table.element(a,'less',header=TRUE)
a<-table.row.end(a)
for (mypoint in kp3:nmkm3) {
a<-table.row.start(a)
a<-table.element(a,mypoint,header=TRUE)
a<-table.element(a,gqarr[mypoint-kp3+1,1])
a<-table.element(a,gqarr[mypoint-kp3+1,2])
a<-table.element(a,gqarr[mypoint-kp3+1,3])
a<-table.row.end(a)
}
a<-table.end(a)
table.save(a,file='mytable5.tab')
a<-table.start()
a<-table.row.start(a)
a<-table.element(a,'Meta Analysis of Goldfeld-Quandt test for Heteroskedasticity',4,TRUE)
a<-table.row.end(a)
a<-table.row.start(a)
a<-table.element(a,'Description',header=TRUE)
a<-table.element(a,'# significant tests',header=TRUE)
a<-table.element(a,'% significant tests',header=TRUE)
a<-table.element(a,'OK/NOK',header=TRUE)
a<-table.row.end(a)
a<-table.row.start(a)
a<-table.element(a,'1% type I error level',header=TRUE)
a<-table.element(a,numsignificant1)
a<-table.element(a,numsignificant1/numgqtests)
if (numsignificant1/numgqtests < 0.01) dum <- 'OK' else dum <- 'NOK'
a<-table.element(a,dum)
a<-table.row.end(a)
a<-table.row.start(a)
a<-table.element(a,'5% type I error level',header=TRUE)
a<-table.element(a,numsignificant5)
a<-table.element(a,numsignificant5/numgqtests)
if (numsignificant5/numgqtests < 0.05) dum <- 'OK' else dum <- 'NOK'
a<-table.element(a,dum)
a<-table.row.end(a)
a<-table.row.start(a)
a<-table.element(a,'10% type I error level',header=TRUE)
a<-table.element(a,numsignificant10)
a<-table.element(a,numsignificant10/numgqtests)
if (numsignificant10/numgqtests < 0.1) dum <- 'OK' else dum <- 'NOK'
a<-table.element(a,dum)
a<-table.row.end(a)
a<-table.end(a)
table.save(a,file='mytable6.tab')
}