Free Statistics

of Irreproducible Research!

Author's title

Author*The author of this computation has been verified*
R Software Modulerwasp_Bayesian_Two_Sample_Test.wasp
Title produced by softwareBayesian Two Sample Test
Date of computationSat, 07 Nov 2015 14:34:04 +0000
Cite this page as followsStatistical Computations at FreeStatistics.org, Office for Research Development and Education, URL https://freestatistics.org/blog/index.php?v=date/2015/Nov/07/t14469071285v28jliho5lkeme.htm/, Retrieved Tue, 14 May 2024 12:25:20 +0000
Statistical Computations at FreeStatistics.org, Office for Research Development and Education, URL https://freestatistics.org/blog/index.php?pk=283232, Retrieved Tue, 14 May 2024 12:25:20 +0000
QR Codes:

Original text written by user:
IsPrivate?No (this computation is public)
User-defined keywords
Estimated Impact231
Family? (F = Feedback message, R = changed R code, M = changed R Module, P = changed Parameters, D = changed Data)
-     [Testing Mean with unknown Variance - Critical Value] [] [2015-10-24 09:52:55] [32b17a345b130fdf5cc88718ed94a974]
- RMPD    [Bayesian Two Sample Test] [] [2015-11-07 14:34:04] [63a9f0ea7bb98050796b649e85481845] [Current]
Feedback Forum

Post a new message
Dataseries X:
5.77	3.88
5.33	3.55
4.59	3.29
4.33	2.59
3.66	2.33
4.48	3.59


Summary of computational transaction
Raw Inputview raw input (R code)
Raw Outputview raw output of R engine
Computing time8 seconds
R Server'Sir Maurice George Kendall' @ kendall.wessa.net

\begin{tabular}{lllllllll}
\hline
Summary of computational transaction \tabularnewline
Raw Input & view raw input (R code)  \tabularnewline
Raw Output & view raw output of R engine  \tabularnewline
Computing time & 8 seconds \tabularnewline
R Server & 'Sir Maurice George Kendall' @ kendall.wessa.net \tabularnewline
\hline
\end{tabular}
%Source: https://freestatistics.org/blog/index.php?pk=283232&T=0

[TABLE]
[ROW][C]Summary of computational transaction[/C][/ROW]
[ROW][C]Raw Input[/C][C]view raw input (R code) [/C][/ROW]
[ROW][C]Raw Output[/C][C]view raw output of R engine [/C][/ROW]
[ROW][C]Computing time[/C][C]8 seconds[/C][/ROW]
[ROW][C]R Server[/C][C]'Sir Maurice George Kendall' @ kendall.wessa.net[/C][/ROW]
[/TABLE]
Source: https://freestatistics.org/blog/index.php?pk=283232&T=0

Globally Unique Identifier (entire table): ba.freestatistics.org/blog/index.php?pk=283232&T=0

As an alternative you can also use a QR Code:  

The GUIDs for individual cells are displayed in the table below:

Summary of computational transaction
Raw Inputview raw input (R code)
Raw Outputview raw output of R engine
Computing time8 seconds
R Server'Sir Maurice George Kendall' @ kendall.wessa.net


Bayesian Two Sample Test
> summary(r, credMass = par4, compValeff = par3)
          mean median  mode HDI% HDIlo  HDIup compVal %>compVal
mu       1.497  1.498 1.512   97 0.907   2.07       0      99.9
sigma    0.523  0.453 0.371   97 0.168   1.18                  
nu      32.208 23.412 7.957   97 1.001 106.16                  
log10nu  1.328  1.369 1.474   97 0.350   2.14                  
effSz    3.446  3.300 3.074   97 0.677   6.74       0      99.9

\begin{tabular}{lllllllll}
\hline
Bayesian Two Sample Test \tabularnewline
> summary(r, credMass = par4, compValeff = par3)
          mean median  mode HDI% HDIlo  HDIup compVal %>compVal
mu       1.497  1.498 1.512   97 0.907   2.07       0      99.9
sigma    0.523  0.453 0.371   97 0.168   1.18                  
nu      32.208 23.412 7.957   97 1.001 106.16                  
log10nu  1.328  1.369 1.474   97 0.350   2.14                  
effSz    3.446  3.300 3.074   97 0.677   6.74       0      99.9
\tabularnewline \hline \end{tabular} %Source: https://freestatistics.org/blog/index.php?pk=283232&T=1

[TABLE]
[ROW][C]Bayesian Two Sample Test[/C][/ROW]
[ROW][C]
> summary(r, credMass = par4, compValeff = par3)
          mean median  mode HDI% HDIlo  HDIup compVal %>compVal
mu       1.497  1.498 1.512   97 0.907   2.07       0      99.9
sigma    0.523  0.453 0.371   97 0.168   1.18                  
nu      32.208 23.412 7.957   97 1.001 106.16                  
log10nu  1.328  1.369 1.474   97 0.350   2.14                  
effSz    3.446  3.300 3.074   97 0.677   6.74       0      99.9
[/C][/ROW] [/TABLE] Source: https://freestatistics.org/blog/index.php?pk=283232&T=1

Globally Unique Identifier (entire table): ba.freestatistics.org/blog/index.php?pk=283232&T=1

As an alternative you can also use a QR Code:  

The GUIDs for individual cells are displayed in the table below:

Bayesian Two Sample Test
> summary(r, credMass = par4, compValeff = par3)
          mean median  mode HDI% HDIlo  HDIup compVal %>compVal
mu       1.497  1.498 1.512   97 0.907   2.07       0      99.9
sigma    0.523  0.453 0.371   97 0.168   1.18                  
nu      32.208 23.412 7.957   97 1.001 106.16                  
log10nu  1.328  1.369 1.474   97 0.350   2.14                  
effSz    3.446  3.300 3.074   97 0.677   6.74       0      99.9


Parameters (Session):
par1 = 1 ; par2 = 2 ; par3 = 0 ; par4 = 0.97 ; par5 = paired ;
Parameters (R input):
par1 = 1 ; par2 = 2 ; par3 = 0 ; par4 = 0.97 ; par5 = paired ;
R code (references can be found in the software module):
library(BEST)
par1 <- as.numeric(par1) #column number of first sample
par2 <- as.numeric(par2) #column number of second sample
par3 <- as.numeric(par3)
par4 <- as.numeric(par4)
z <- t(y)
if (par1 == par2) stop('Please, select two different column numbers')
if (par1 < 1) stop('Please, select a column number greater than zero for the first sample')
if (par2 < 1) stop('Please, select a column number greater than zero for the second sample')
if (par1 > length(z[1,])) stop('The column number for the first sample should be smaller')
if (par2 > length(z[1,])) stop('The column number for the second sample should be smaller')
if(par5=='unpaired') {
(r <- BESTmcmc(z[,par1],z[,par2], parallel=F))
}
if(par5=='paired') {
(r <- BESTmcmc(z[,par1]-z[,par2], parallel=F))
}
bitmap(file='test2.png')
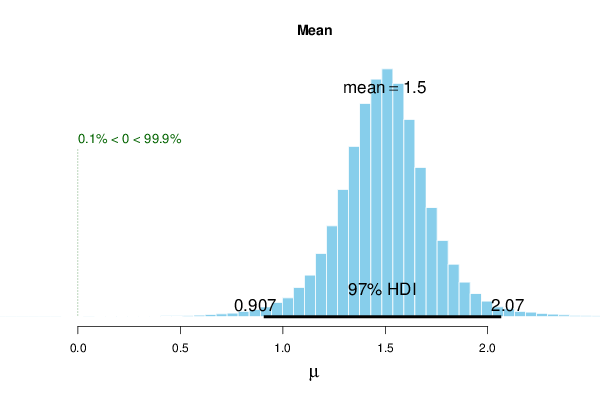
plot(r, credMass=par4, compVal=par3)
dev.off()
load(file='createtable')
a<-table.start()
a<-table.row.start(a)
a<-table.element(a,'Bayesian Two Sample Test',1,TRUE)
a<-table.row.end(a)
a<-table.row.start(a)
a<-table.element(a,paste('
',RC.texteval('summary(r, credMass=par4, compValeff=par3)'),'
',sep=''))
a<-table.row.end(a)
a<-table.end(a)
table.save(a,file='mytable.tab')