Free Statistics
of Irreproducible Research!
Description of Statistical Computation | |||||||||||||||||||||||||||||||||||||||||||||||||||||||||||||||||||||||||||||||||||||||||||||||||||||||||||||||||||||||||||||||||||||||||||||||||||||||||||||||||||||||||||||||||||||
|---|---|---|---|---|---|---|---|---|---|---|---|---|---|---|---|---|---|---|---|---|---|---|---|---|---|---|---|---|---|---|---|---|---|---|---|---|---|---|---|---|---|---|---|---|---|---|---|---|---|---|---|---|---|---|---|---|---|---|---|---|---|---|---|---|---|---|---|---|---|---|---|---|---|---|---|---|---|---|---|---|---|---|---|---|---|---|---|---|---|---|---|---|---|---|---|---|---|---|---|---|---|---|---|---|---|---|---|---|---|---|---|---|---|---|---|---|---|---|---|---|---|---|---|---|---|---|---|---|---|---|---|---|---|---|---|---|---|---|---|---|---|---|---|---|---|---|---|---|---|---|---|---|---|---|---|---|---|---|---|---|---|---|---|---|---|---|---|---|---|---|---|---|---|---|---|---|---|---|---|---|---|
| Author's title | |||||||||||||||||||||||||||||||||||||||||||||||||||||||||||||||||||||||||||||||||||||||||||||||||||||||||||||||||||||||||||||||||||||||||||||||||||||||||||||||||||||||||||||||||||||
| Author | *The author of this computation has been verified* | ||||||||||||||||||||||||||||||||||||||||||||||||||||||||||||||||||||||||||||||||||||||||||||||||||||||||||||||||||||||||||||||||||||||||||||||||||||||||||||||||||||||||||||||||||||
| R Software Module | rwasp_chi_squared_tests.wasp | ||||||||||||||||||||||||||||||||||||||||||||||||||||||||||||||||||||||||||||||||||||||||||||||||||||||||||||||||||||||||||||||||||||||||||||||||||||||||||||||||||||||||||||||||||||
| Title produced by software | Chi-Squared Test, McNemar Test, and Fisher Exact Test | ||||||||||||||||||||||||||||||||||||||||||||||||||||||||||||||||||||||||||||||||||||||||||||||||||||||||||||||||||||||||||||||||||||||||||||||||||||||||||||||||||||||||||||||||||||
| Date of computation | Sat, 10 Nov 2012 05:48:52 -0500 | ||||||||||||||||||||||||||||||||||||||||||||||||||||||||||||||||||||||||||||||||||||||||||||||||||||||||||||||||||||||||||||||||||||||||||||||||||||||||||||||||||||||||||||||||||||
| Cite this page as follows | Statistical Computations at FreeStatistics.org, Office for Research Development and Education, URL https://freestatistics.org/blog/index.php?v=date/2012/Nov/10/t1352544544k019nt9v3vl0poj.htm/, Retrieved Sat, 06 Jun 2026 00:20:48 +0000 | ||||||||||||||||||||||||||||||||||||||||||||||||||||||||||||||||||||||||||||||||||||||||||||||||||||||||||||||||||||||||||||||||||||||||||||||||||||||||||||||||||||||||||||||||||||
| Statistical Computations at FreeStatistics.org, Office for Research Development and Education, URL https://freestatistics.org/blog/index.php?pk=187285, Retrieved Sat, 06 Jun 2026 00:20:48 +0000 | |||||||||||||||||||||||||||||||||||||||||||||||||||||||||||||||||||||||||||||||||||||||||||||||||||||||||||||||||||||||||||||||||||||||||||||||||||||||||||||||||||||||||||||||||||||
| QR Codes: | |||||||||||||||||||||||||||||||||||||||||||||||||||||||||||||||||||||||||||||||||||||||||||||||||||||||||||||||||||||||||||||||||||||||||||||||||||||||||||||||||||||||||||||||||||||
|
| |||||||||||||||||||||||||||||||||||||||||||||||||||||||||||||||||||||||||||||||||||||||||||||||||||||||||||||||||||||||||||||||||||||||||||||||||||||||||||||||||||||||||||||||||||||
| Original text written by user: | |||||||||||||||||||||||||||||||||||||||||||||||||||||||||||||||||||||||||||||||||||||||||||||||||||||||||||||||||||||||||||||||||||||||||||||||||||||||||||||||||||||||||||||||||||||
| IsPrivate? | No (this computation is public) | ||||||||||||||||||||||||||||||||||||||||||||||||||||||||||||||||||||||||||||||||||||||||||||||||||||||||||||||||||||||||||||||||||||||||||||||||||||||||||||||||||||||||||||||||||||
| User-defined keywords | |||||||||||||||||||||||||||||||||||||||||||||||||||||||||||||||||||||||||||||||||||||||||||||||||||||||||||||||||||||||||||||||||||||||||||||||||||||||||||||||||||||||||||||||||||||
| Estimated Impact | 527 | ||||||||||||||||||||||||||||||||||||||||||||||||||||||||||||||||||||||||||||||||||||||||||||||||||||||||||||||||||||||||||||||||||||||||||||||||||||||||||||||||||||||||||||||||||||
Tree of Dependent Computations | |||||||||||||||||||||||||||||||||||||||||||||||||||||||||||||||||||||||||||||||||||||||||||||||||||||||||||||||||||||||||||||||||||||||||||||||||||||||||||||||||||||||||||||||||||||
| Family? (F = Feedback message, R = changed R code, M = changed R Module, P = changed Parameters, D = changed Data) | |||||||||||||||||||||||||||||||||||||||||||||||||||||||||||||||||||||||||||||||||||||||||||||||||||||||||||||||||||||||||||||||||||||||||||||||||||||||||||||||||||||||||||||||||||||
| - [Chi-Squared Test, McNemar Test, and Fisher Exact Test] [Workshop 6 1] [2012-11-10 10:48:52] [de03d6ba395ecb425436b99f470cccc0] [Current] - R D [Chi-Squared Test, McNemar Test, and Fisher Exact Test] [workshop 6 a] [2012-11-10 11:59:30] [dbae308bdff61c0f4902cc85498d0d35] - R P [Chi-Squared Test, McNemar Test, and Fisher Exact Test] [workshop 6 b] [2012-11-10 12:22:11] [dbae308bdff61c0f4902cc85498d0d35] - M [Chi-Squared Test, McNemar Test, and Fisher Exact Test] [paper deel 2 chi-...] [2012-11-19 19:17:41] [dbae308bdff61c0f4902cc85498d0d35] - R P [Chi-Squared Test, McNemar Test, and Fisher Exact Test] [workshop 6 c] [2012-11-10 12:51:55] [dbae308bdff61c0f4902cc85498d0d35] - RMPD [Kernel Density Estimation] [workshop 6 d] [2012-11-11 15:22:16] [dbae308bdff61c0f4902cc85498d0d35] - R [Chi-Squared Test, McNemar Test, and Fisher Exact Test] [paper deel 2 chi-...] [2012-11-19 19:01:50] [dbae308bdff61c0f4902cc85498d0d35] - M [Chi-Squared Test, McNemar Test, and Fisher Exact Test] [] [2012-12-20 21:41:54] [74be16979710d4c4e7c6647856088456] - R D [Chi-Squared Test, McNemar Test, and Fisher Exact Test] [Workshop 6 1] [2012-11-10 12:17:04] [e31fe164d58995c48777312ee804d655] - R PD [Chi-Squared Test, McNemar Test, and Fisher Exact Test] [Paper: deel 5 chi...] [2012-12-16 15:08:52] [e31fe164d58995c48777312ee804d655] - R D [Chi-Squared Test, McNemar Test, and Fisher Exact Test] [paper deel 5 chi] [2012-12-16 15:13:41] [dbae308bdff61c0f4902cc85498d0d35] - R P [Chi-Squared Test, McNemar Test, and Fisher Exact Test] [paper deel 5 chi 2] [2012-12-16 15:20:16] [dbae308bdff61c0f4902cc85498d0d35] - P [Chi-Squared Test, McNemar Test, and Fisher Exact Test] [paper deel 5 chi 3] [2012-12-16 15:21:18] [dbae308bdff61c0f4902cc85498d0d35] - RMPD [One-Way-Between-Groups ANOVA- Free Statistics Software (Calculator)] [paper deel 5 a] [2012-12-16 15:36:10] [dbae308bdff61c0f4902cc85498d0d35] - R PD [Chi-Squared Test, McNemar Test, and Fisher Exact Test] [paper deel 5 chi 4] [2012-12-19 17:03:58] [dbae308bdff61c0f4902cc85498d0d35] - P [Chi-Squared Test, McNemar Test, and Fisher Exact Test] [paper deel 5 chi 5] [2012-12-20 18:28:30] [dbae308bdff61c0f4902cc85498d0d35] - R P [Chi-Squared Test, McNemar Test, and Fisher Exact Test] [Paper deel 5: chi...] [2012-12-18 16:45:29] [e31fe164d58995c48777312ee804d655] | |||||||||||||||||||||||||||||||||||||||||||||||||||||||||||||||||||||||||||||||||||||||||||||||||||||||||||||||||||||||||||||||||||||||||||||||||||||||||||||||||||||||||||||||||||||
| Feedback Forum | |||||||||||||||||||||||||||||||||||||||||||||||||||||||||||||||||||||||||||||||||||||||||||||||||||||||||||||||||||||||||||||||||||||||||||||||||||||||||||||||||||||||||||||||||||||
Post a new message | |||||||||||||||||||||||||||||||||||||||||||||||||||||||||||||||||||||||||||||||||||||||||||||||||||||||||||||||||||||||||||||||||||||||||||||||||||||||||||||||||||||||||||||||||||||
Dataset | |||||||||||||||||||||||||||||||||||||||||||||||||||||||||||||||||||||||||||||||||||||||||||||||||||||||||||||||||||||||||||||||||||||||||||||||||||||||||||||||||||||||||||||||||||||
| Dataseries X: | |||||||||||||||||||||||||||||||||||||||||||||||||||||||||||||||||||||||||||||||||||||||||||||||||||||||||||||||||||||||||||||||||||||||||||||||||||||||||||||||||||||||||||||||||||||
'C' 'D' 'C' 'A' 'B' 'A' 'D' 'D' 'D' 'A' 'C' 'D' 'A' 'B' 'A' 'C' 'A' 'C' 'A' 'B' 'A' 'A' 'D' 'A' 'B' 'D' 'A' 'D' 'B' 'C' 'A' 'B' 'A' 'A' 'A' 'C' 'C' 'B' 'C' 'C' 'B' 'D' 'A' 'B' 'A' 'A' 'A' 'D' 'A' 'B' 'A' 'B' 'D' 'A' 'B' 'A' 'A' 'A' 'A' 'B' 'C' 'D' 'C' 'B' 'D' 'C' 'C' 'A' 'A' 'B' 'B' 'A' 'A' 'C' 'D' 'A' 'D' 'A' 'A' 'B' 'A' 'A' 'A' 'C' 'A' 'A' 'A' 'A' 'B' 'A' 'B' 'B' 'A' 'B' 'D' 'A' 'A' 'A' 'D' 'D' 'D' 'A' 'D' 'B' 'A' 'A' 'B' 'A' 'D' 'C' 'A' 'A' 'D' 'A' 'C' 'A' 'A' 'B' 'C' 'C' 'C' 'C' 'D' 'B' 'B' 'A' 'A' 'B' 'D' 'C' 'A' 'B' 'A' 'C' 'A' 'A' 'A' 'D' 'C' 'A' 'C' 'A' 'B' 'A' 'B' 'A' 'C' 'D' 'B' 'B' 'C' 'B' 'D' 'B' 'B' 'D' 'A' 'B' 'A' 'A' 'B' 'A' 'C' 'A' 'D' 'B' 'D' 'A' 'D' 'D' 'A' 'A' 'B' 'A' 'A' 'A' 'D' 'A' 'B' 'C' 'A' 'A' 'A' 'A' 'B' 'D' 'C' 'D' 'C' 'A' 'B' 'C' 'D' 'C' 'A' 'A' 'C' 'C' 'A' 'C' 'C' 'C' 'A' 'D' 'A' 'A' 'A' 'B' 'A' 'D' 'C' 'B' 'C' 'D' 'A' 'C' 'B' 'C' 'D' 'B' 'B' 'B' 'C' 'C' 'A' 'C' 'C' 'C' 'D' 'C' 'D' 'B' 'D' 'A' 'A' 'A' 'A' 'D' 'B' 'D' 'D' 'D' 'D' 'B' 'B' 'A' 'A' 'A' 'C' 'A' 'B' 'B' 'C' 'D' 'C' 'A' 'A' 'A' 'D' 'D' 'D' 'D' 'D' 'A' 'B' 'B' 'C' 'B' 'B' 'A' 'D' 'B' 'D' 'C' 'D' 'A' 'B' 'B' 'D' 'D' 'B' 'C' 'D' 'B' 'D' 'D' 'C' 'B' 'C' 'B' 'A' 'D' 'B' 'D' 'D' 'B' 'C' 'D' 'A' 'A' 'D' 'B' 'A' 'A' 'B' 'B' 'D' 'D' 'A' 'B' 'B' 'B' 'A' 'D' 'D' 'D' 'A' 'C' 'C' 'D' 'A' 'A' 'A' 'B' 'B' 'B' 'D' 'A' 'D' 'B' 'C' 'D' 'A' 'A' 'D' 'C' 'B' 'C' 'D' 'D' 'D' 'A' 'A' 'A' 'D' 'D' 'A' 'B' 'A' 'A' 'C' 'A' 'C' 'A' 'B' 'A' 'A' 'D' 'A' 'D' 'B' 'A' 'A' 'D' 'D' 'B' 'B' 'B' 'C' 'D' 'D' 'A' 'C' 'D' 'D' 'D' 'C' 'A' 'B' 'C' 'A' 'A' 'C' 'A' 'C' 'A' 'D' 'D' 'B' 'A' 'C' 'B' 'C' 'D' 'A' 'C' 'B' 'C' 'A' 'B' 'C' 'D' 'C' 'B' 'D' 'D' 'D' 'A' 'B' 'B' 'D' 'D' 'C' 'A' | |||||||||||||||||||||||||||||||||||||||||||||||||||||||||||||||||||||||||||||||||||||||||||||||||||||||||||||||||||||||||||||||||||||||||||||||||||||||||||||||||||||||||||||||||||||
Tables (Output of Computation) | |||||||||||||||||||||||||||||||||||||||||||||||||||||||||||||||||||||||||||||||||||||||||||||||||||||||||||||||||||||||||||||||||||||||||||||||||||||||||||||||||||||||||||||||||||||
| |||||||||||||||||||||||||||||||||||||||||||||||||||||||||||||||||||||||||||||||||||||||||||||||||||||||||||||||||||||||||||||||||||||||||||||||||||||||||||||||||||||||||||||||||||||
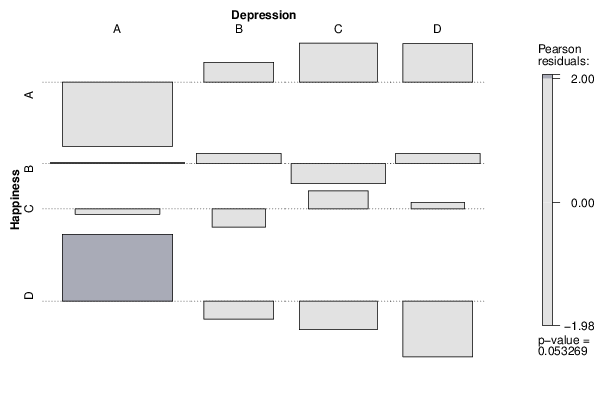
Figures (Output of Computation) | |||||||||||||||||||||||||||||||||||||||||||||||||||||||||||||||||||||||||||||||||||||||||||||||||||||||||||||||||||||||||||||||||||||||||||||||||||||||||||||||||||||||||||||||||||||
Input Parameters & R Code | |||||||||||||||||||||||||||||||||||||||||||||||||||||||||||||||||||||||||||||||||||||||||||||||||||||||||||||||||||||||||||||||||||||||||||||||||||||||||||||||||||||||||||||||||||||
| Parameters (Session): | |||||||||||||||||||||||||||||||||||||||||||||||||||||||||||||||||||||||||||||||||||||||||||||||||||||||||||||||||||||||||||||||||||||||||||||||||||||||||||||||||||||||||||||||||||||
| par1 = 5 ; par2 = 6 ; par3 = Pearson Chi-Squared ; | |||||||||||||||||||||||||||||||||||||||||||||||||||||||||||||||||||||||||||||||||||||||||||||||||||||||||||||||||||||||||||||||||||||||||||||||||||||||||||||||||||||||||||||||||||||
| Parameters (R input): | |||||||||||||||||||||||||||||||||||||||||||||||||||||||||||||||||||||||||||||||||||||||||||||||||||||||||||||||||||||||||||||||||||||||||||||||||||||||||||||||||||||||||||||||||||||
| par1 = 5 ; par2 = 6 ; par3 = Pearson Chi-Squared ; | |||||||||||||||||||||||||||||||||||||||||||||||||||||||||||||||||||||||||||||||||||||||||||||||||||||||||||||||||||||||||||||||||||||||||||||||||||||||||||||||||||||||||||||||||||||
| R code (references can be found in the software module): | |||||||||||||||||||||||||||||||||||||||||||||||||||||||||||||||||||||||||||||||||||||||||||||||||||||||||||||||||||||||||||||||||||||||||||||||||||||||||||||||||||||||||||||||||||||
library(vcd) | |||||||||||||||||||||||||||||||||||||||||||||||||||||||||||||||||||||||||||||||||||||||||||||||||||||||||||||||||||||||||||||||||||||||||||||||||||||||||||||||||||||||||||||||||||||