Free Statistics
of Irreproducible Research!
Description of Statistical Computation | |||||||||||||||||||||||||||||||||||||||
|---|---|---|---|---|---|---|---|---|---|---|---|---|---|---|---|---|---|---|---|---|---|---|---|---|---|---|---|---|---|---|---|---|---|---|---|---|---|---|---|
| Author's title | |||||||||||||||||||||||||||||||||||||||
| Author | *The author of this computation has been verified* | ||||||||||||||||||||||||||||||||||||||
| R Software Module | rwasp_fitdistrnorm.wasp | ||||||||||||||||||||||||||||||||||||||
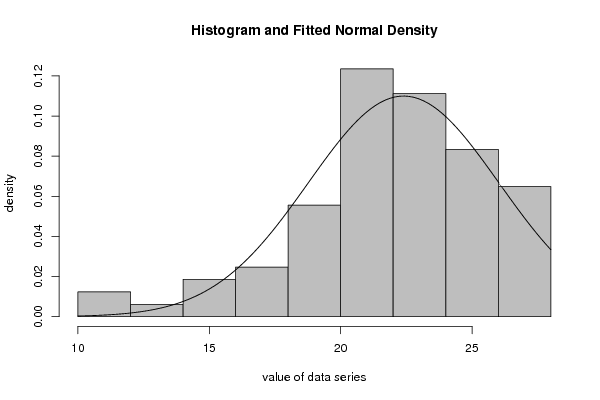
| Title produced by software | Maximum-likelihood Fitting - Normal Distribution | ||||||||||||||||||||||||||||||||||||||
| Date of computation | Tue, 18 Oct 2011 18:45:56 -0400 | ||||||||||||||||||||||||||||||||||||||
| Cite this page as follows | Statistical Computations at FreeStatistics.org, Office for Research Development and Education, URL https://freestatistics.org/blog/index.php?v=date/2011/Oct/18/t1318977970m8nogjpbksogmq0.htm/, Retrieved Fri, 04 Jul 2025 13:20:20 +0000 | ||||||||||||||||||||||||||||||||||||||
| Statistical Computations at FreeStatistics.org, Office for Research Development and Education, URL https://freestatistics.org/blog/index.php?pk=132675, Retrieved Fri, 04 Jul 2025 13:20:20 +0000 | |||||||||||||||||||||||||||||||||||||||
| QR Codes: | |||||||||||||||||||||||||||||||||||||||
|
| |||||||||||||||||||||||||||||||||||||||
| Original text written by user: | |||||||||||||||||||||||||||||||||||||||
| IsPrivate? | No (this computation is public) | ||||||||||||||||||||||||||||||||||||||
| User-defined keywords | |||||||||||||||||||||||||||||||||||||||
| Estimated Impact | 356 | ||||||||||||||||||||||||||||||||||||||
Tree of Dependent Computations | |||||||||||||||||||||||||||||||||||||||
| Family? (F = Feedback message, R = changed R code, M = changed R Module, P = changed Parameters, D = changed Data) | |||||||||||||||||||||||||||||||||||||||
| - [Percentiles] [Intrinsic Motivat...] [2010-10-12 12:10:58] [b98453cac15ba1066b407e146608df68] - RMPD [Kernel Density Estimation] [] [2011-10-18 22:42:23] [b98453cac15ba1066b407e146608df68] - RMPD [Maximum-likelihood Fitting - Normal Distribution] [] [2011-10-18 22:45:56] [d76b387543b13b5e3afd8ff9e5fdc89f] [Current] - R P [Maximum-likelihood Fitting - Normal Distribution] [Histrogram intrin...] [2011-12-19 20:21:52] [c035d973aa8488be257660c2dc4ec375] - R D [Maximum-likelihood Fitting - Normal Distribution] [histogram] [2012-12-01 11:22:44] [93b3e8d0ee7e4ccb504c2c04707a9358] - RMPD [Skewness and Kurtosis Test] [skewness & kurtosis ] [2012-12-01 11:24:42] [93b3e8d0ee7e4ccb504c2c04707a9358] - RMPD [Central Tendency] [central tendency ] [2012-12-01 11:29:11] [93b3e8d0ee7e4ccb504c2c04707a9358] - RMPD [ARIMA Forecasting] [forecast] [2012-12-01 11:42:17] [93b3e8d0ee7e4ccb504c2c04707a9358] - RMP [Maximum-likelihood Fitting - Normal Distribution] [] [2014-10-15 11:27:13] [394a9522c47495260fca596e959e6202] - RM D [Maximum-likelihood Fitting - Normal Distribution] [] [2014-10-15 12:56:59] [5d70ade31d892c55b68fa1af48da4bec] - M [Maximum-likelihood Fitting - Normal Distribution] [] [2014-10-15 12:59:48] [5d70ade31d892c55b68fa1af48da4bec] - RMP [Maximum-likelihood Fitting - Normal Distribution] [WS3-task3-E3] [2014-10-15 13:09:43] [81f624c2f0b20a2549c93e7c3dccf981] - RMPD [Maximum-likelihood Fitting - Normal Distribution] [WS3-task3-AM] [2014-10-15 13:19:58] [81f624c2f0b20a2549c93e7c3dccf981] - RM [Maximum-likelihood Fitting - Normal Distribution] [] [2014-10-15 14:11:54] [eee95947b6243a1febfcd5f41483d733] - RMP [Maximum-likelihood Fitting - Normal Distribution] [Q3] [2014-10-15 14:30:25] [bcf5edf18529a33bd1494456d2c6cb9a] - RMP [Maximum-likelihood Fitting - Normal Distribution] [Vraag 3 E3] [2014-10-15 14:33:08] [36781f05c04c55e165b348994b753b95] - RMP [Maximum-likelihood Fitting - Normal Distribution] [] [2014-10-15 14:44:25] [ae96d02647dd9ad9c105f1fa6642e295] - RMP [Maximum-likelihood Fitting - Normal Distribution] [WS3 Question 3.6] [2014-10-15 14:51:29] [ce9f16fa58bb2303d66047ab4343b505] - RMP [Maximum-likelihood Fitting - Normal Distribution] [] [2014-10-15 14:52:18] [fda96889f4ef6d31c0c28fd64d281011] - RMP [Maximum-likelihood Fitting - Normal Distribution] [] [2014-10-15 16:34:11] [2b9d0c54c8c845c625e475ed5f1f3af1] - RMPD [Maximum-likelihood Fitting - Normal Distribution] [] [2014-10-15 17:42:03] [69bf0eb8b9b38defaaf4848d8c317571] - RMP [Maximum-likelihood Fitting - Normal Distribution] [] [2014-10-15 18:41:52] [1a6d42b46b3d01bc960fcfb45e99fecd] - RMP [Maximum-likelihood Fitting - Normal Distribution] [] [2014-10-15 19:32:03] [99723d3e379f668157309b7b2091b15d] - RM [Maximum-likelihood Fitting - Normal Distribution] [] [2014-10-16 13:57:17] [4c4ebb0b36a379d1d949ba77427e658a] - RM [Maximum-likelihood Fitting - Normal Distribution] [kernel] [2014-10-16 15:41:35] [118a39334d200089014f927b57d44a19] - RM [Maximum-likelihood Fitting - Normal Distribution] [] [2014-10-16 15:59:12] [ce58fb8a0a6d5fe2eedf5e527a9cf2f2] - RM [Maximum-likelihood Fitting - Normal Distribution] [] [2014-10-16 16:05:29] [044144d0728beecdb08e0d94daaff202] - RMP [Maximum-likelihood Fitting - Normal Distribution] [q3 e3 histogram] [2014-10-16 16:11:32] [673773038936aef3a5778d7e6bda5c1e] - RM [Maximum-likelihood Fitting - Normal Distribution] [ws3 Q3] [2014-10-16 16:45:54] [8523551e1e4e3cbe97fa25692e177b2e] - RMPD [Maximum-likelihood Fitting - Normal Distribution] [E1 Histogram] [2014-12-09 09:49:29] [1a6d42b46b3d01bc960fcfb45e99fecd] - M [Maximum-likelihood Fitting - Normal Distribution] [] [2014-12-18 19:41:14] [d69b52d23ca73e15a0c741afa583703c] - RMPD [Maximum-likelihood Fitting - Normal Distribution] [E2 Histogram] [2014-12-09 09:51:16] [1a6d42b46b3d01bc960fcfb45e99fecd] - M [Maximum-likelihood Fitting - Normal Distribution] [] [2014-12-18 19:43:29] [d69b52d23ca73e15a0c741afa583703c] - RMPD [Maximum-likelihood Fitting - Normal Distribution] [E3 Histogram] [2014-12-09 09:52:00] [1a6d42b46b3d01bc960fcfb45e99fecd] - M [Maximum-likelihood Fitting - Normal Distribution] [] [2014-12-18 19:45:59] [d69b52d23ca73e15a0c741afa583703c] | |||||||||||||||||||||||||||||||||||||||
| Feedback Forum | |||||||||||||||||||||||||||||||||||||||
Post a new message | |||||||||||||||||||||||||||||||||||||||
Dataset | |||||||||||||||||||||||||||||||||||||||
| Dataseries X: | |||||||||||||||||||||||||||||||||||||||
23 20 20 21 24 22 23 20 25 23 27 27 22 24 25 22 28 28 27 25 16 28 21 24 27 14 14 27 20 21 22 21 12 20 24 19 28 23 27 22 27 26 22 21 19 24 19 26 22 28 21 23 28 10 24 21 21 24 24 25 25 23 21 16 17 25 24 23 25 23 28 26 22 19 26 18 18 25 27 12 15 21 23 22 21 24 27 22 28 26 10 19 22 21 24 25 21 20 21 24 23 18 24 24 19 20 18 20 27 23 26 23 17 21 25 23 27 24 20 27 21 24 21 15 25 25 22 24 21 22 23 22 20 23 25 23 22 25 26 22 24 24 25 20 26 21 26 21 22 16 26 28 18 25 23 21 20 25 22 21 16 18 | |||||||||||||||||||||||||||||||||||||||
Tables (Output of Computation) | |||||||||||||||||||||||||||||||||||||||
| |||||||||||||||||||||||||||||||||||||||
Figures (Output of Computation) | |||||||||||||||||||||||||||||||||||||||
Input Parameters & R Code | |||||||||||||||||||||||||||||||||||||||
| Parameters (Session): | |||||||||||||||||||||||||||||||||||||||
| par1 = 8 ; par2 = 0 ; | |||||||||||||||||||||||||||||||||||||||
| Parameters (R input): | |||||||||||||||||||||||||||||||||||||||
| par1 = 8 ; par2 = 0 ; | |||||||||||||||||||||||||||||||||||||||
| R code (references can be found in the software module): | |||||||||||||||||||||||||||||||||||||||
library(MASS) | |||||||||||||||||||||||||||||||||||||||