Free Statistics
of Irreproducible Research!
Description of Statistical Computation | |||||||||||||||||||||||||||||||||
|---|---|---|---|---|---|---|---|---|---|---|---|---|---|---|---|---|---|---|---|---|---|---|---|---|---|---|---|---|---|---|---|---|---|
| Author's title | |||||||||||||||||||||||||||||||||
| Author | *The author of this computation has been verified* | ||||||||||||||||||||||||||||||||
| R Software Module | rwasp_density.wasp | ||||||||||||||||||||||||||||||||
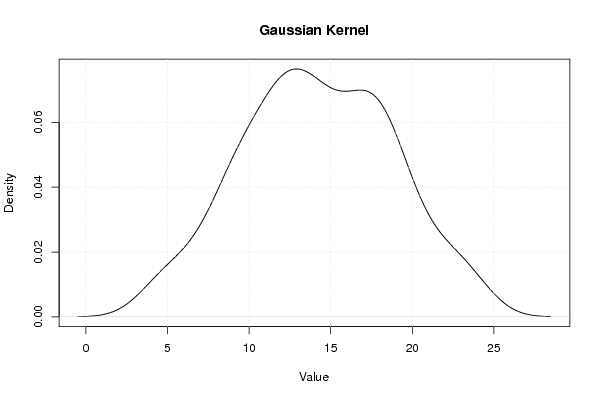
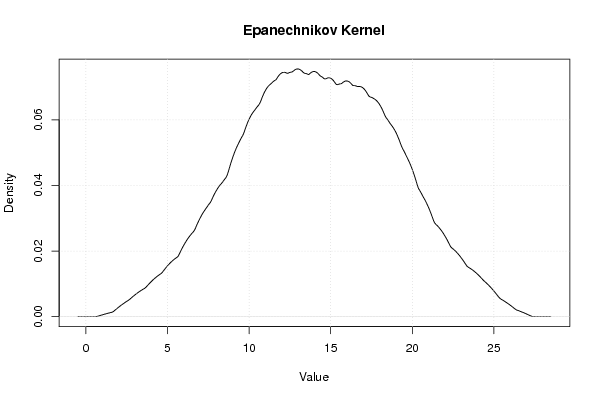
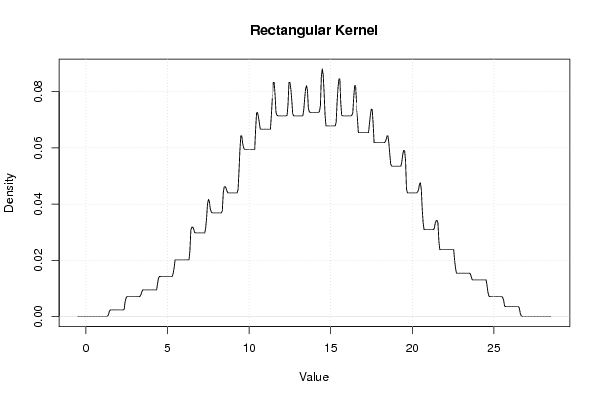
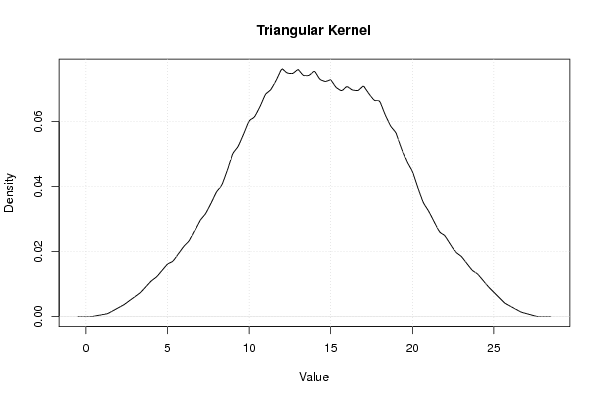
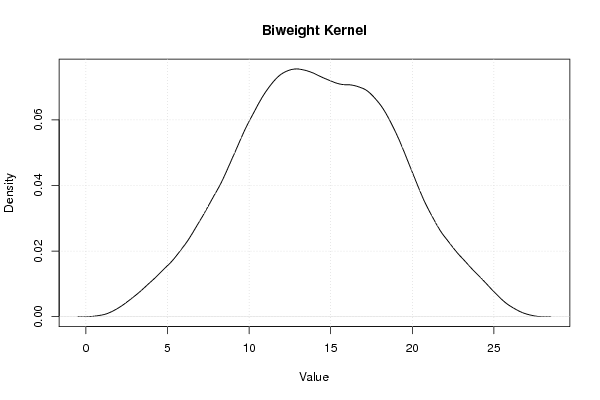
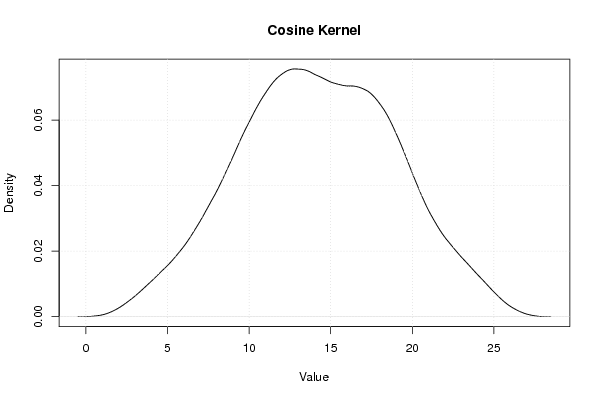
| Title produced by software | Kernel Density Estimation | ||||||||||||||||||||||||||||||||
| Date of computation | Tue, 18 Oct 2011 18:42:23 -0400 | ||||||||||||||||||||||||||||||||
| Cite this page as follows | Statistical Computations at FreeStatistics.org, Office for Research Development and Education, URL https://freestatistics.org/blog/index.php?v=date/2011/Oct/18/t1318977768e33tjr4opza7t39.htm/, Retrieved Sat, 05 Jul 2025 09:17:56 +0000 | ||||||||||||||||||||||||||||||||
| Statistical Computations at FreeStatistics.org, Office for Research Development and Education, URL https://freestatistics.org/blog/index.php?pk=132668, Retrieved Sat, 05 Jul 2025 09:17:56 +0000 | |||||||||||||||||||||||||||||||||
| QR Codes: | |||||||||||||||||||||||||||||||||
|
| |||||||||||||||||||||||||||||||||
| Original text written by user: | |||||||||||||||||||||||||||||||||
| IsPrivate? | No (this computation is public) | ||||||||||||||||||||||||||||||||
| User-defined keywords | |||||||||||||||||||||||||||||||||
| Estimated Impact | 409 | ||||||||||||||||||||||||||||||||
Tree of Dependent Computations | |||||||||||||||||||||||||||||||||
| Family? (F = Feedback message, R = changed R code, M = changed R Module, P = changed Parameters, D = changed Data) | |||||||||||||||||||||||||||||||||
| - [Percentiles] [Intrinsic Motivat...] [2010-10-12 12:10:58] [b98453cac15ba1066b407e146608df68] - RMPD [Kernel Density Estimation] [] [2011-10-18 22:42:23] [d76b387543b13b5e3afd8ff9e5fdc89f] [Current] - D [Kernel Density Estimation] [] [2011-10-18 22:45:17] [b98453cac15ba1066b407e146608df68] - RM [Kernel Density Estimation] [] [2011-10-20 11:26:15] [c4580079d5d2b3f0ba412f27cdc441be] - RMPD [Univariate Explorative Data Analysis] [] [2011-12-02 13:23:17] [c4580079d5d2b3f0ba412f27cdc441be] - RMPD [Tukey lambda PPCC Plot] [] [2011-12-02 13:31:05] [c4580079d5d2b3f0ba412f27cdc441be] - RMPD [One Sample Tests about the Mean] [] [2011-12-02 13:50:43] [c4580079d5d2b3f0ba412f27cdc441be] - R P [One Sample Tests about the Mean] [] [2011-12-02 14:08:17] [c4580079d5d2b3f0ba412f27cdc441be] - RM [Kernel Density Estimation] [Workshop 3 ] [2012-10-19 08:32:06] [b8fff3381cd5ab6dded5825409053f97] - R P [Kernel Density Estimation] [Paper-KDP- EM 3] [2012-12-16 14:11:08] [8a32126242ff0300e413cfb1e4cb76da] - RMPD [Kernel Density Estimation] [] [2014-10-15 12:10:58] [a30ebaf79f34e9d2b1bcdd5006125d11] - RMPD [Notched Boxplots] [] [2014-10-15 12:28:48] [3cc57788b191749bdc089f5fad42e0f8] - RMPD [Notched Boxplots] [] [2014-10-15 12:37:45] [3cc57788b191749bdc089f5fad42e0f8] - RM [Kernel Density Estimation] [] [2014-10-15 13:08:05] [7b576ab45e161dc8fb6fe50455a3800c] - RMP [Kernel Density Estimation] [WS3-task3-E3] [2014-10-15 13:11:12] [81f624c2f0b20a2549c93e7c3dccf981] - RMPD [Kernel Density Estimation] [] [2014-10-15 13:45:31] [d253a55552bf9917a397def3be261e30] - RMP [Kernel Density Estimation] [] [2014-10-15 14:10:24] [eee95947b6243a1febfcd5f41483d733] - RMP [Kernel Density Estimation] [Q3] [2014-10-15 14:27:22] [bcf5edf18529a33bd1494456d2c6cb9a] - RMP [Kernel Density Estimation] [Vraag 3 E3] [2014-10-15 14:31:09] [36781f05c04c55e165b348994b753b95] - RMP [Kernel Density Estimation] [] [2014-10-15 14:42:43] [ae96d02647dd9ad9c105f1fa6642e295] - RMP [Kernel Density Estimation] [WS3 Question 3.5] [2014-10-15 14:49:27] [ce9f16fa58bb2303d66047ab4343b505] - RMP [Kernel Density Estimation] [] [2014-10-15 14:50:28] [b007041690f75f30ec26eb43925b7b35] - RMP [Kernel Density Estimation] [] [2014-10-15 14:51:33] [fda96889f4ef6d31c0c28fd64d281011] - RM [Kernel Density Estimation] [Task 3] [2014-10-15 15:36:04] [1651e47f7f65f3a10bbbb444d4b26be7] - RMP [Kernel Density Estimation] [] [2014-10-15 16:31:30] [2b9d0c54c8c845c625e475ed5f1f3af1] - RM [Kernel Density Estimation] [] [2014-10-15 16:38:05] [80a885d02035c87be624c190e38c794d] - RMP [Kernel Density Estimation] [] [2014-10-15 18:40:47] [1a6d42b46b3d01bc960fcfb45e99fecd] - RMPD [Kernel Density Estimation] [] [2014-10-15 19:23:50] [99723d3e379f668157309b7b2091b15d] - RMP [Kernel Density Estimation] [] [2014-10-15 19:31:32] [99723d3e379f668157309b7b2091b15d] - RM [Kernel Density Estimation] [] [2014-10-16 14:58:23] [6656361aa4da5489a6a45e803df0211c] - RMP [Kernel Density Estimation] [gaus] [2014-10-16 15:40:53] [118a39334d200089014f927b57d44a19] - RM [Kernel Density Estimation] [] [2014-10-16 16:02:33] [044144d0728beecdb08e0d94daaff202] - RM [Kernel Density Estimation] [ws3 Q3] [2014-10-16 16:44:33] [8523551e1e4e3cbe97fa25692e177b2e] - RMPD [Kernel Density Estimation] [W3T3AG] [2014-10-16 17:48:11] [2a42404c3b0fbfc7622e3301a77a3a9b] - RM [Kernel Density Estimation] [] [2014-10-16 18:32:43] [8d160a85bfd9526a7d0e42afc5fb569b] - RMPD [Kernel Density Estimation] [] [2014-10-16 19:04:24] [95c11abf048d3a1e472aeccb09199113] - D [Kernel Density Estimation] [] [2014-10-16 19:46:01] [95c11abf048d3a1e472aeccb09199113] - RMP [Kernel Density Estimation] [Gaussian] [2014-10-16 19:43:09] [3d5212c89039da1a3a24d8e18d23c716] - D [Kernel Density Estimation] [Gaussian] [2014-10-16 19:54:50] [3d5212c89039da1a3a24d8e18d23c716] - RMPD [Kernel Density Estimation] [Gaussian] [2014-10-16 19:48:38] [3d5212c89039da1a3a24d8e18d23c716] - D [Kernel Density Estimation] [Gaussian] [2014-10-16 19:50:20] [3d5212c89039da1a3a24d8e18d23c716] - RMP [Kernel Density Estimation] [] [2014-10-16 19:51:07] [dacad244957cb51472792888970d4390] - RMP [Kernel Density Estimation] [Gaussian] [2014-10-16 19:56:22] [3d5212c89039da1a3a24d8e18d23c716] - RMPD [Kernel Density Estimation] [] [2014-12-15 13:20:00] [fa1b8827d7de91b8b87087311d3d9fa1] - PD [Kernel Density Estimation] [] [2014-12-15 13:27:32] [fa1b8827d7de91b8b87087311d3d9fa1] - RMPD [Maximum-likelihood Fitting - Normal Distribution] [] [2011-10-18 22:45:56] [b98453cac15ba1066b407e146608df68] - R P [Maximum-likelihood Fitting - Normal Distribution] [Histrogram intrin...] [2011-12-19 20:21:52] [c035d973aa8488be257660c2dc4ec375] - R D [Maximum-likelihood Fitting - Normal Distribution] [histogram] [2012-12-01 11:22:44] [93b3e8d0ee7e4ccb504c2c04707a9358] - RMPD [Skewness and Kurtosis Test] [skewness & kurtosis ] [2012-12-01 11:24:42] [93b3e8d0ee7e4ccb504c2c04707a9358] - RMPD [Central Tendency] [central tendency ] [2012-12-01 11:29:11] [93b3e8d0ee7e4ccb504c2c04707a9358] [Truncated] | |||||||||||||||||||||||||||||||||
| Feedback Forum | |||||||||||||||||||||||||||||||||
Post a new message | |||||||||||||||||||||||||||||||||
Dataset | |||||||||||||||||||||||||||||||||
| Dataseries X: | |||||||||||||||||||||||||||||||||
21 15 18 11 8 19 4 20 16 14 10 13 14 8 23 11 9 24 5 15 5 19 6 13 11 17 17 5 9 15 17 17 20 12 7 16 7 14 24 15 15 10 14 18 12 9 9 8 18 10 17 14 16 10 19 10 14 10 4 19 9 12 16 11 18 11 24 17 18 9 19 18 12 23 22 14 14 16 23 7 10 12 12 12 17 21 16 11 14 13 9 19 13 19 13 13 13 14 12 22 11 5 18 19 14 15 12 19 15 17 8 10 12 12 20 12 12 14 6 10 18 18 7 18 9 17 22 11 15 17 15 22 9 13 20 14 14 12 20 20 8 17 9 18 22 10 13 15 18 18 12 12 20 12 16 16 18 16 13 17 13 17 | |||||||||||||||||||||||||||||||||
Tables (Output of Computation) | |||||||||||||||||||||||||||||||||
| |||||||||||||||||||||||||||||||||
Figures (Output of Computation) | |||||||||||||||||||||||||||||||||
Input Parameters & R Code | |||||||||||||||||||||||||||||||||
| Parameters (Session): | |||||||||||||||||||||||||||||||||
| par1 = 0 ; | |||||||||||||||||||||||||||||||||
| Parameters (R input): | |||||||||||||||||||||||||||||||||
| par1 = 0 ; | |||||||||||||||||||||||||||||||||
| R code (references can be found in the software module): | |||||||||||||||||||||||||||||||||
if (par1 == '0') bw <- 'nrd0' | |||||||||||||||||||||||||||||||||