Free Statistics
of Irreproducible Research!
Description of Statistical Computation | |||||||||||||||||||||||||||||||||||||||||||||||||||||||||||||||||||||||||||||||||||||||||||||||||||||||||||||||||||||||||||||||||||||||||||||
|---|---|---|---|---|---|---|---|---|---|---|---|---|---|---|---|---|---|---|---|---|---|---|---|---|---|---|---|---|---|---|---|---|---|---|---|---|---|---|---|---|---|---|---|---|---|---|---|---|---|---|---|---|---|---|---|---|---|---|---|---|---|---|---|---|---|---|---|---|---|---|---|---|---|---|---|---|---|---|---|---|---|---|---|---|---|---|---|---|---|---|---|---|---|---|---|---|---|---|---|---|---|---|---|---|---|---|---|---|---|---|---|---|---|---|---|---|---|---|---|---|---|---|---|---|---|---|---|---|---|---|---|---|---|---|---|---|---|---|---|---|---|
| Author's title | |||||||||||||||||||||||||||||||||||||||||||||||||||||||||||||||||||||||||||||||||||||||||||||||||||||||||||||||||||||||||||||||||||||||||||||
| Author | *The author of this computation has been verified* | ||||||||||||||||||||||||||||||||||||||||||||||||||||||||||||||||||||||||||||||||||||||||||||||||||||||||||||||||||||||||||||||||||||||||||||
| R Software Module | rwasp_notchedbox1.wasp | ||||||||||||||||||||||||||||||||||||||||||||||||||||||||||||||||||||||||||||||||||||||||||||||||||||||||||||||||||||||||||||||||||||||||||||
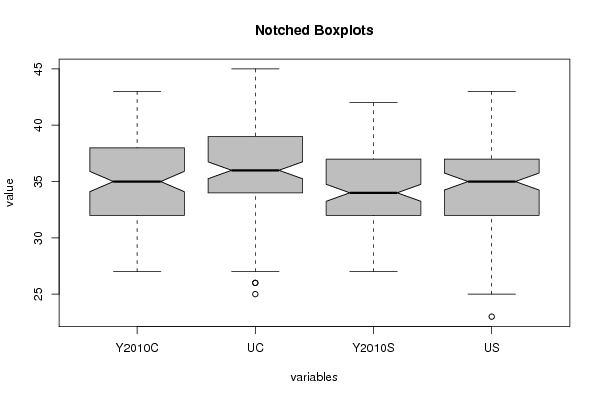
| Title produced by software | Notched Boxplots | ||||||||||||||||||||||||||||||||||||||||||||||||||||||||||||||||||||||||||||||||||||||||||||||||||||||||||||||||||||||||||||||||||||||||||||
| Date of computation | Sun, 03 Oct 2010 17:09:07 +0000 | ||||||||||||||||||||||||||||||||||||||||||||||||||||||||||||||||||||||||||||||||||||||||||||||||||||||||||||||||||||||||||||||||||||||||||||
| Cite this page as follows | Statistical Computations at FreeStatistics.org, Office for Research Development and Education, URL https://freestatistics.org/blog/index.php?v=date/2010/Oct/03/t1286125790zh1nyigt3o8p6zn.htm/, Retrieved Tue, 16 Sep 2025 13:09:45 +0000 | ||||||||||||||||||||||||||||||||||||||||||||||||||||||||||||||||||||||||||||||||||||||||||||||||||||||||||||||||||||||||||||||||||||||||||||
| Statistical Computations at FreeStatistics.org, Office for Research Development and Education, URL https://freestatistics.org/blog/index.php?pk=80351, Retrieved Tue, 16 Sep 2025 13:09:45 +0000 | |||||||||||||||||||||||||||||||||||||||||||||||||||||||||||||||||||||||||||||||||||||||||||||||||||||||||||||||||||||||||||||||||||||||||||||
| QR Codes: | |||||||||||||||||||||||||||||||||||||||||||||||||||||||||||||||||||||||||||||||||||||||||||||||||||||||||||||||||||||||||||||||||||||||||||||
|
| |||||||||||||||||||||||||||||||||||||||||||||||||||||||||||||||||||||||||||||||||||||||||||||||||||||||||||||||||||||||||||||||||||||||||||||
| Original text written by user: | |||||||||||||||||||||||||||||||||||||||||||||||||||||||||||||||||||||||||||||||||||||||||||||||||||||||||||||||||||||||||||||||||||||||||||||
| IsPrivate? | No (this computation is public) | ||||||||||||||||||||||||||||||||||||||||||||||||||||||||||||||||||||||||||||||||||||||||||||||||||||||||||||||||||||||||||||||||||||||||||||
| User-defined keywords | |||||||||||||||||||||||||||||||||||||||||||||||||||||||||||||||||||||||||||||||||||||||||||||||||||||||||||||||||||||||||||||||||||||||||||||
| Estimated Impact | 1461 | ||||||||||||||||||||||||||||||||||||||||||||||||||||||||||||||||||||||||||||||||||||||||||||||||||||||||||||||||||||||||||||||||||||||||||||
Tree of Dependent Computations | |||||||||||||||||||||||||||||||||||||||||||||||||||||||||||||||||||||||||||||||||||||||||||||||||||||||||||||||||||||||||||||||||||||||||||||
| Family? (F = Feedback message, R = changed R code, M = changed R Module, P = changed Parameters, D = changed Data) | |||||||||||||||||||||||||||||||||||||||||||||||||||||||||||||||||||||||||||||||||||||||||||||||||||||||||||||||||||||||||||||||||||||||||||||
| - [Survey Scores] [E-Learn 2008 table 1] [2008-09-07 11:33:54] [b98453cac15ba1066b407e146608df68] F RM D [Survey Scores] [ATTLES] [2010-04-05 12:47:13] [b98453cac15ba1066b407e146608df68] F RMPD [Notched Boxplots] [Compare ATTLES Sc...] [2010-10-03 17:09:07] [d76b387543b13b5e3afd8ff9e5fdc89f] [Current] F [Notched Boxplots] [Connected en Sepa...] [2010-10-08 13:35:40] [aeb27d5c05332f2e597ad139ee63fbe4] F [Notched Boxplots] [] [2010-10-09 11:52:59] [f3d662049ef6875ba0c96bb458434b66] - R [Notched Boxplots] [workshop 2 Task 6] [2013-10-15 10:22:39] [f661ab64c60045a179a329b9ddab9bfe] - [Notched Boxplots] [] [2010-10-09 11:54:16] [1ad9dd03b6c5806e9fe90049663fcef1] - [Notched Boxplots] [] [2010-10-09 12:16:32] [a9671b130b33f9fcb98554992ce4582f] - D [Notched Boxplots] [ATTLES Boxplots] [2010-10-09 12:40:47] [6bc4f9343b7ea3ef5a59412d1f72bb2b] - [Notched Boxplots] [Taak 6: connected...] [2010-10-09 18:44:02] [74deae64b71f9d77c839af86f7c687b5] - [Notched Boxplots] [Task 6 probability] [2010-10-10 09:44:09] [87d60b8864dc39f7ed759c345edfb471] - R [Notched Boxplots] [taak 6] [2011-10-10 08:19:29] [c4580079d5d2b3f0ba412f27cdc441be] - [Notched Boxplots] [taak 6 B] [2011-10-10 08:20:18] [c4580079d5d2b3f0ba412f27cdc441be] - [Notched Boxplots] [Workshop 2 taak 6] [2010-10-11 16:59:13] [1afa3497b02a8d7c9f6727c1b17b89b2] - [Notched Boxplots] [] [2010-10-11 21:00:29] [f4dc4aa51d65be851b8508203d9f6001] F [Notched Boxplots] [work shop 2 task 6] [2010-10-11 22:23:51] [74be16979710d4c4e7c6647856088456] F [Notched Boxplots] [Task 6] [2010-10-11 22:26:13] [48146708a479232c43a8f6e52fbf83b4] - [Notched Boxplots] [Connected Index] [2010-10-12 15:27:17] [abf4ff90b26c6b37be4a30063b404639] - [Notched Boxplots] [] [2010-10-12 20:31:51] [de4adef75375d243bafd27c3fb0ddf4c] - RM [Notched Boxplots] [Workshop 2 - Task 6] [2011-10-06 17:00:30] [fbaf17a8836493f6de0f4e0e997711e1] - R [Notched Boxplots] [] [2011-10-06 21:00:49] [ee8c3a74bf3b349877806e9a50913c60] - R [Notched Boxplots] [Task 6 (ws2)] [2011-10-07 07:56:59] [10b12745961ee885a66356b3bf31ed40] - R [Notched Boxplots] [Workshop 2 taak 6] [2011-10-07 14:57:32] [aa7c7608f809e956d7797134ec926e04] - RM [Notched Boxplots] [] [2011-10-08 13:00:32] [06c08141d7d783218a8164fd2ea166f2] - R [Notched Boxplots] [] [2011-10-08 21:34:56] [a9a952c1cbc7081c25fad93a34aab827] - R [Notched Boxplots] [Task 6] [2011-10-09 12:40:14] [1321c14511baa35aebbc5dda661708fe] - R [Notched Boxplots] [] [2011-10-09 14:22:57] [50e3859e0b739a5118d466e989dfc0cb] - RM [Notched Boxplots] [] [2011-10-09 15:38:13] [90a803f646514fc2f7a5d6de952a552a] - R [Notched Boxplots] [task 6] [2011-10-09 17:26:25] [80bca13c5f9401fbb753952fd2952f4a] - [Notched Boxplots] [Notched boxplots] [2012-12-04 18:42:14] [f8da7216ca6ab56f40bda6dd57b36742] - RM [Notched Boxplots] [] [2011-10-09 17:40:35] [aefb5c2d4042694c5b6b82f93ac1885a] - RM [Notched Boxplots] [task 6] [2011-10-10 12:37:13] [d31984dff2665bea309b726bae3d5241] - R [Notched Boxplots] [task 6] [2011-10-10 12:54:35] [379dab8110dbf77cfcc4b7951c3a599f] - RM [Notched Boxplots] [opdracht 6] [2011-10-10 19:02:18] [8fcdd1f5b88bf5ac5d2a0b8a91219b89] - RM [Notched Boxplots] [] [2011-10-11 08:07:16] [f2efe7b37bd12d7944b0ea184fe3529a] - RM [Notched Boxplots] [Workshop 2 - Task 6] [2011-10-11 08:10:42] [ec29c78521a0445a37e4526edb78f709] - RM [Notched Boxplots] [ws 2 - task 6] [2011-10-11 08:45:26] [7e261c986c934df955dd3ac53e9d45c6] - R [Notched Boxplots] [] [2011-10-11 09:16:26] [ad2d4c5ace9fa07b356a7b5098237581] - M [Notched Boxplots] [WS2: vraag 6] [2011-10-24 16:16:55] [8ce6c7315af51b5eb6923c5fe455d382] - D [Notched Boxplots] [] [2011-12-18 12:01:19] [ad2d4c5ace9fa07b356a7b5098237581] - R [Notched Boxplots] [] [2011-10-11 10:17:38] [18e0b15711387f6270134133fa101957] - R [Notched Boxplots] [] [2011-10-11 10:36:11] [72554d79606dc183296fd485368f0ec1] - R [Notched Boxplots] [vraag 6] [2011-10-11 10:41:02] [c505444e07acba7694d29053ca5d114e] - R P [Notched Boxplots] [] [2011-10-11 14:28:04] [86a47bcc75cd2e0d5b5c9888edc893c2] - RM [Notched Boxplots] [WS 2 - Task 6] [2011-10-11 15:04:33] [74b1e5a3104ff0b2404b2865a63336ad] - R [Notched Boxplots] [Workshop 2 - Fabr...] [2011-10-11 15:04:50] [60c0c94f647e2c90e494ab0f2a2f1926] - R P [Notched Boxplots] [] [2011-10-11 15:29:57] [a1957df0bc37aec4aa3c994e6a08412c] - RM [Notched Boxplots] [Workshop 2 Task 6] [2011-10-11 15:40:48] [59e9c089bdd600b584669dddc48fbcc3] - RM [Notched Boxplots] [WS2 Task 6] [2011-10-11 16:12:30] [ab11d59973a0ec4be849e25906c4cdbf] - R [Notched Boxplots] [Notched Boxplots] [2011-10-11 16:19:43] [f7a862281046b7153543b12c78921b36] - R [Notched Boxplots] [] [2011-10-11 16:45:08] [e21b9c93af4eb9605ecfaf58a559e5ab] [Truncated] | |||||||||||||||||||||||||||||||||||||||||||||||||||||||||||||||||||||||||||||||||||||||||||||||||||||||||||||||||||||||||||||||||||||||||||||
| Feedback Forum | |||||||||||||||||||||||||||||||||||||||||||||||||||||||||||||||||||||||||||||||||||||||||||||||||||||||||||||||||||||||||||||||||||||||||||||
Post a new message | |||||||||||||||||||||||||||||||||||||||||||||||||||||||||||||||||||||||||||||||||||||||||||||||||||||||||||||||||||||||||||||||||||||||||||||
Dataset | |||||||||||||||||||||||||||||||||||||||||||||||||||||||||||||||||||||||||||||||||||||||||||||||||||||||||||||||||||||||||||||||||||||||||||||
| Dataseries X: | |||||||||||||||||||||||||||||||||||||||||||||||||||||||||||||||||||||||||||||||||||||||||||||||||||||||||||||||||||||||||||||||||||||||||||||
41 34 38 30 39 33 32 28 30 29 35 31 31 34 33 35 34 32 37 35 35 35 29 37 39 41 31 39 34 27 36 31 36 40 35 38 37 40 38 37 38 36 31 37 36 40 34 35 38 43 35 37 39 40 38 42 33 33 37 28 32 37 33 37 36 32 32 36 38 26 38 37 39 36 38 33 32 39 32 40 32 38 33 30 31 34 31 36 39 35 38 33 37 41 39 40 39 42 32 37 41 36 32 37 36 39 35 39 33 33 37 35 33 33 33 36 34 36 33 34 31 37 28 36 27 36 32 32 37 34 31 33 34 32 37 27 34 35 30 37 32 39 33 32 29 30 31 31 36 25 33 31 29 29 31 32 35 39 33 37 37 31 32 25 34 26 33 30 38 28 32 37 35 40 33 37 38 32 28 40 37 35 35 35 38 32 39 35 33 41 34 43 36 34 38 32 38 36 32 42 32 38 38 35 32 34 30 27 32 32 33 30 34 34 38 31 32 32 32 36 37 40 32 36 39 43 34 41 29 35 34 34 37 45 36 36 35 36 34 33 30 39 28 35 38 31 34 28 34 36 35 33 31 36 35 38 34 37 31 37 35 40 37 39 36 35 35 34 30 36 27 32 39 32 40 36 35 36 37 36 38 37 36 35 31 42 38 33 34 37 39 42 38 36 41 36 34 36 27 33 39 33 30 36 37 37 37 32 34 35 31 35 28 37 31 38 37 28 27 33 33 33 36 32 37 45 38 38 35 38 37 39 37 43 33 39 32 37 34 39 33 36 31 30 38 40 39 38 33 39 34 38 29 43 32 42 33 32 33 41 31 37 36 31 36 34 32 39 35 44 41 40 32 35 28 31 29 34 30 34 39 37 36 23 37 40 35 28 35 36 31 36 37 44 34 41 32 35 36 29 38 34 36 31 37 40 35 33 36 34 37 35 32 39 28 35 33 36 39 34 40 40 32 40 38 37 35 34 41 35 39 36 36 45 35 35 43 39 42 39 | |||||||||||||||||||||||||||||||||||||||||||||||||||||||||||||||||||||||||||||||||||||||||||||||||||||||||||||||||||||||||||||||||||||||||||||
Tables (Output of Computation) | |||||||||||||||||||||||||||||||||||||||||||||||||||||||||||||||||||||||||||||||||||||||||||||||||||||||||||||||||||||||||||||||||||||||||||||
| |||||||||||||||||||||||||||||||||||||||||||||||||||||||||||||||||||||||||||||||||||||||||||||||||||||||||||||||||||||||||||||||||||||||||||||
Figures (Output of Computation) | |||||||||||||||||||||||||||||||||||||||||||||||||||||||||||||||||||||||||||||||||||||||||||||||||||||||||||||||||||||||||||||||||||||||||||||
Input Parameters & R Code | |||||||||||||||||||||||||||||||||||||||||||||||||||||||||||||||||||||||||||||||||||||||||||||||||||||||||||||||||||||||||||||||||||||||||||||
| Parameters (Session): | |||||||||||||||||||||||||||||||||||||||||||||||||||||||||||||||||||||||||||||||||||||||||||||||||||||||||||||||||||||||||||||||||||||||||||||
| par1 = grey ; | |||||||||||||||||||||||||||||||||||||||||||||||||||||||||||||||||||||||||||||||||||||||||||||||||||||||||||||||||||||||||||||||||||||||||||||
| Parameters (R input): | |||||||||||||||||||||||||||||||||||||||||||||||||||||||||||||||||||||||||||||||||||||||||||||||||||||||||||||||||||||||||||||||||||||||||||||
| par1 = grey ; | |||||||||||||||||||||||||||||||||||||||||||||||||||||||||||||||||||||||||||||||||||||||||||||||||||||||||||||||||||||||||||||||||||||||||||||
| R code (references can be found in the software module): | |||||||||||||||||||||||||||||||||||||||||||||||||||||||||||||||||||||||||||||||||||||||||||||||||||||||||||||||||||||||||||||||||||||||||||||
z <- as.data.frame(t(y)) | |||||||||||||||||||||||||||||||||||||||||||||||||||||||||||||||||||||||||||||||||||||||||||||||||||||||||||||||||||||||||||||||||||||||||||||