Free Statistics

of Irreproducible Research!

Author's title

Author*The author of this computation has been verified*
R Software Modulerwasp_multipleregression.wasp
Title produced by softwareMultiple Regression
Date of computationTue, 21 Dec 2010 11:31:18 +0000
Cite this page as followsStatistical Computations at FreeStatistics.org, Office for Research Development and Education, URL https://freestatistics.org/blog/index.php?v=date/2010/Dec/21/t1292930981yzkmpmuue4gv6lv.htm/, Retrieved Wed, 08 May 2024 14:12:53 +0000
Statistical Computations at FreeStatistics.org, Office for Research Development and Education, URL https://freestatistics.org/blog/index.php?pk=113291, Retrieved Wed, 08 May 2024 14:12:53 +0000
QR Codes:

Original text written by user:
IsPrivate?No (this computation is public)
User-defined keywords
Estimated Impact150
Family? (F = Feedback message, R = changed R code, M = changed R Module, P = changed Parameters, D = changed Data)
-     [Bivariate Data Series] [Bivariate dataset] [2008-01-05 23:51:08] [74be16979710d4c4e7c6647856088456]
F RMPD  [Univariate Explorative Data Analysis] [Colombia Coffee] [2008-01-07 14:21:11] [74be16979710d4c4e7c6647856088456]
- RMPD    [Univariate Explorative Data Analysis] [Workshop 6, Tutor...] [2010-11-07 12:24:29] [8ffb4cfa64b4677df0d2c448735a40bb]
- R P       [Univariate Explorative Data Analysis] [WS6 2. Technique 2] [2010-11-11 18:06:41] [afe9379cca749d06b3d6872e02cc47ed]
- RMPD        [Multiple Regression] [Apple Inc - Multi...] [2010-12-11 10:33:09] [afe9379cca749d06b3d6872e02cc47ed]
-    D          [Multiple Regression] [WS10 Multiple Reg...] [2010-12-13 13:48:19] [afe9379cca749d06b3d6872e02cc47ed]
-    D            [Multiple Regression] [Paper - Multiple ...] [2010-12-21 11:10:31] [18fa53e8b37a5effc0c5f8a5122cdd2d]
-   P                 [Multiple Regression] [Paper - Multiple ...] [2010-12-21 11:31:18] [89d441ae0711e9b79b5d358f420c1317] [Current]
Feedback Forum

Post a new message
Dataseries X:
105.31	1576.23	29.29	710.45
105.63	1546.37	28.99	720
106.02	1545.05	28.91	720
105.85	1552.34	29.29	720
106.57	1594.3	30.96	754.78
106.48	1605.78	30.57	802.73
106.60	1673.21	30.59	845.24
106.75	1612.94	31.39	893.91
106.69	1566.34	31.28	931.43
106.69	1530.17	31.1	940
106.93	1582.54	31.7	947.73
107.21	1702.16	32.57	960
107.88	1701.93	32.49	996.96
108.84	1811.15	32.46	1000
108.96	1924.2	32.3	1000
109.52	2034.25	32.97	1000
108.45	2011.13	32.9	1013.04
108.67	2013.04	32.93	1095.24
108.96	2151.67	33.72	1159.09
108.76	1902.09	33.33	1200
107.85	1944.01	33.44	1200
108.78	1916.67	33.89	1282.61
107.51	1967.31	34.34	1513.64
108.83	2119.88	33.56	1669.05
111.54	2216.38	32.67	1700
111.74	2522.83	32.57	1700
112.04	2647.64	33.23	1700
111.74	2631.23	32.85	1665.91
111.81	2693.41	32.61	1650
111.86	3021.76	32.57	1650
114.23	2953.67	32.98	1619.57
114.80	2796.8	31.33	1599.05
115.17	2672.05	29.8	1572.73
115.11	2251.23	28.06	1470
114.43	2046.08	25.47	1268
114.66	2420.04	24.65	1217.39
115.11	2608.89	23.94	1154.09
117.74	2660.47	23.89	984
118.18	2493.98	23.54	900
118.56	2541.7	24.28	900
117.63	2554.6	25.51	916.67
117.71	2699.61	27.03	957.73
117.46	2805.48	27.09	966.09
117.37	2956.66	27.3	980
117.34	3149.51	27.11	990.91
117.09	3372.5	26.39	1000.91
116.65	3379.33	27.54	1042.38
116.71	3517.54	26.85	1142.61
116.82	3527.34	26.82	1214.29
117.33	3281.06	25.9	1218
117.95	3089.65	24.96	1202.61
123.53	3222.76	25.4	1200
124.91	3165.76	24.38	1228.57
125.99	3232.43	24.73	1195.91
126.29	3229.54	25.43	1180
125.68	3071.74	26.04	1210.91
125.52	2850.17	25.59	1272.27


Summary of computational transaction
Raw Inputview raw input (R code)
Raw Outputview raw output of R engine
Computing time15 seconds
R Server'Sir Ronald Aylmer Fisher' @ 193.190.124.24

\begin{tabular}{lllllllll}
\hline
Summary of computational transaction \tabularnewline
Raw Input & view raw input (R code)  \tabularnewline
Raw Output & view raw output of R engine  \tabularnewline
Computing time & 15 seconds \tabularnewline
R Server & 'Sir Ronald Aylmer Fisher' @ 193.190.124.24 \tabularnewline
\hline
\end{tabular}
%Source: https://freestatistics.org/blog/index.php?pk=113291&T=0

[TABLE]
[ROW][C]Summary of computational transaction[/C][/ROW]
[ROW][C]Raw Input[/C][C]view raw input (R code) [/C][/ROW]
[ROW][C]Raw Output[/C][C]view raw output of R engine [/C][/ROW]
[ROW][C]Computing time[/C][C]15 seconds[/C][/ROW]
[ROW][C]R Server[/C][C]'Sir Ronald Aylmer Fisher' @ 193.190.124.24[/C][/ROW]
[/TABLE]
Source: https://freestatistics.org/blog/index.php?pk=113291&T=0

Globally Unique Identifier (entire table): ba.freestatistics.org/blog/index.php?pk=113291&T=0

As an alternative you can also use a QR Code:  

The GUIDs for individual cells are displayed in the table below:

Summary of computational transaction
Raw Inputview raw input (R code)
Raw Outputview raw output of R engine
Computing time15 seconds
R Server'Sir Ronald Aylmer Fisher' @ 193.190.124.24


Multiple Linear Regression - Estimated Regression Equation
PC&S[t] = + 114.483839993239 -0.00127267457636996PCacao[t] -0.282970517890051PSuiker[t] -2.24120575866206e-06PNoten[t] + 0.346487091120247t + e[t]

\begin{tabular}{lllllllll}
\hline
Multiple Linear Regression - Estimated Regression Equation \tabularnewline
PC&S[t] =  +  114.483839993239 -0.00127267457636996PCacao[t] -0.282970517890051PSuiker[t] -2.24120575866206e-06PNoten[t] +  0.346487091120247t  + e[t] \tabularnewline
\hline
\end{tabular}
%Source: https://freestatistics.org/blog/index.php?pk=113291&T=1

[TABLE]
[ROW][C]Multiple Linear Regression - Estimated Regression Equation[/C][/ROW]
[ROW][C]PC&S[t] =  +  114.483839993239 -0.00127267457636996PCacao[t] -0.282970517890051PSuiker[t] -2.24120575866206e-06PNoten[t] +  0.346487091120247t  + e[t][/C][/ROW]
[/TABLE]
Source: https://freestatistics.org/blog/index.php?pk=113291&T=1

Globally Unique Identifier (entire table): ba.freestatistics.org/blog/index.php?pk=113291&T=1

As an alternative you can also use a QR Code:  

The GUIDs for individual cells are displayed in the table below:

Multiple Linear Regression - Estimated Regression Equation
PC&S[t] = + 114.483839993239 -0.00127267457636996PCacao[t] -0.282970517890051PSuiker[t] -2.24120575866206e-06PNoten[t] + 0.346487091120247t + e[t]


Multiple Linear Regression - Ordinary Least Squares
VariableParameterS.D.T-STATH0: parameter = 02-tail p-value1-tail p-value
(Intercept)114.4838399932393.78714530.229600
PCacao-0.001272674576369960.001009-1.26150.2127430.106371
PSuiker-0.2829705178900510.138112-2.04890.0455380.022769
PNoten-2.24120575866206e-060.001228-0.00180.998550.499275
t0.3464870911202470.0478697.238200

\begin{tabular}{lllllllll}
\hline
Multiple Linear Regression - Ordinary Least Squares \tabularnewline
Variable & Parameter & S.D. & T-STATH0: parameter = 0 & 2-tail p-value & 1-tail p-value \tabularnewline
(Intercept) & 114.483839993239 & 3.787145 & 30.2296 & 0 & 0 \tabularnewline
PCacao & -0.00127267457636996 & 0.001009 & -1.2615 & 0.212743 & 0.106371 \tabularnewline
PSuiker & -0.282970517890051 & 0.138112 & -2.0489 & 0.045538 & 0.022769 \tabularnewline
PNoten & -2.24120575866206e-06 & 0.001228 & -0.0018 & 0.99855 & 0.499275 \tabularnewline
t & 0.346487091120247 & 0.047869 & 7.2382 & 0 & 0 \tabularnewline
\hline
\end{tabular}
%Source: https://freestatistics.org/blog/index.php?pk=113291&T=2

[TABLE]
[ROW][C]Multiple Linear Regression - Ordinary Least Squares[/C][/ROW]
[ROW][C]Variable[/C][C]Parameter[/C][C]S.D.[/C][C]T-STATH0: parameter = 0[/C][C]2-tail p-value[/C][C]1-tail p-value[/C][/ROW]
[ROW][C](Intercept)[/C][C]114.483839993239[/C][C]3.787145[/C][C]30.2296[/C][C]0[/C][C]0[/C][/ROW]
[ROW][C]PCacao[/C][C]-0.00127267457636996[/C][C]0.001009[/C][C]-1.2615[/C][C]0.212743[/C][C]0.106371[/C][/ROW]
[ROW][C]PSuiker[/C][C]-0.282970517890051[/C][C]0.138112[/C][C]-2.0489[/C][C]0.045538[/C][C]0.022769[/C][/ROW]
[ROW][C]PNoten[/C][C]-2.24120575866206e-06[/C][C]0.001228[/C][C]-0.0018[/C][C]0.99855[/C][C]0.499275[/C][/ROW]
[ROW][C]t[/C][C]0.346487091120247[/C][C]0.047869[/C][C]7.2382[/C][C]0[/C][C]0[/C][/ROW]
[/TABLE]
Source: https://freestatistics.org/blog/index.php?pk=113291&T=2

Globally Unique Identifier (entire table): ba.freestatistics.org/blog/index.php?pk=113291&T=2

As an alternative you can also use a QR Code:  

The GUIDs for individual cells are displayed in the table below:

Multiple Linear Regression - Ordinary Least Squares
VariableParameterS.D.T-STATH0: parameter = 02-tail p-value1-tail p-value
(Intercept)114.4838399932393.78714530.229600
PCacao-0.001272674576369960.001009-1.26150.2127430.106371
PSuiker-0.2829705178900510.138112-2.04890.0455380.022769
PNoten-2.24120575866206e-060.001228-0.00180.998550.499275
t0.3464870911202470.0478697.238200


Multiple Linear Regression - Regression Statistics
Multiple R0.961530690665013
R-squared0.924541269090738
Adjusted R-squared0.918736751328487
F-TEST (value)159.279600297442
F-TEST (DF numerator)4
F-TEST (DF denominator)52
p-value0
Multiple Linear Regression - Residual Statistics
Residual Standard Deviation1.70114158048657
Sum Squared Residuals150.481899196738

\begin{tabular}{lllllllll}
\hline
Multiple Linear Regression - Regression Statistics \tabularnewline
Multiple R & 0.961530690665013 \tabularnewline
R-squared & 0.924541269090738 \tabularnewline
Adjusted R-squared & 0.918736751328487 \tabularnewline
F-TEST (value) & 159.279600297442 \tabularnewline
F-TEST (DF numerator) & 4 \tabularnewline
F-TEST (DF denominator) & 52 \tabularnewline
p-value & 0 \tabularnewline
Multiple Linear Regression - Residual Statistics \tabularnewline
Residual Standard Deviation & 1.70114158048657 \tabularnewline
Sum Squared Residuals & 150.481899196738 \tabularnewline
\hline
\end{tabular}
%Source: https://freestatistics.org/blog/index.php?pk=113291&T=3

[TABLE]
[ROW][C]Multiple Linear Regression - Regression Statistics[/C][/ROW]
[ROW][C]Multiple R[/C][C]0.961530690665013[/C][/ROW]
[ROW][C]R-squared[/C][C]0.924541269090738[/C][/ROW]
[ROW][C]Adjusted R-squared[/C][C]0.918736751328487[/C][/ROW]
[ROW][C]F-TEST (value)[/C][C]159.279600297442[/C][/ROW]
[ROW][C]F-TEST (DF numerator)[/C][C]4[/C][/ROW]
[ROW][C]F-TEST (DF denominator)[/C][C]52[/C][/ROW]
[ROW][C]p-value[/C][C]0[/C][/ROW]
[ROW][C]Multiple Linear Regression - Residual Statistics[/C][/ROW]
[ROW][C]Residual Standard Deviation[/C][C]1.70114158048657[/C][/ROW]
[ROW][C]Sum Squared Residuals[/C][C]150.481899196738[/C][/ROW]
[/TABLE]
Source: https://freestatistics.org/blog/index.php?pk=113291&T=3

Globally Unique Identifier (entire table): ba.freestatistics.org/blog/index.php?pk=113291&T=3

As an alternative you can also use a QR Code:  

The GUIDs for individual cells are displayed in the table below:

Multiple Linear Regression - Regression Statistics
Multiple R0.961530690665013
R-squared0.924541269090738
Adjusted R-squared0.918736751328487
F-TEST (value)159.279600297442
F-TEST (DF numerator)4
F-TEST (DF denominator)52
p-value0
Multiple Linear Regression - Residual Statistics
Residual Standard Deviation1.70114158048657
Sum Squared Residuals150.481899196738


Multiple Linear Regression - Actuals, Interpolation, and Residuals
Time or IndexActualsInterpolationForecastResidualsPrediction Error
1105.31104.5345005032170.77549949678294
2105.63105.0038594090400.626140590960301
3106.02105.3746640720320.645335927968043
4105.85105.6043445686920.24565543130775
5106.57105.4247915205751.14520847942466
6106.48105.8669193437200.613080656280156
7106.6106.1218353041410.478164695859128
8106.75106.3185409981830.431459001817385
9106.69106.755377391490-0.0653773914895447
10106.69107.198812608124-0.50881260812395
11106.93107.308850096425-0.378850096425148
12107.21107.256888004561-0.0468880045610305
13107.88107.6262226173000.253777382699796
14108.84107.8421904934610.99780950653949
15108.96108.0900770065850.869922993415447
16109.52108.1069160135891.41308398641105
17108.45108.502606051844-0.0526060518440726
18108.67108.837988991873-0.16798899187339
19108.96108.7843553963510.175644603649353
20108.76109.558743422491-0.798743422490829
21107.85109.820753238402-1.97075323840175
22108.78110.074513373382-1.2945133733817
23107.51110.228697705138-2.71869770513762
24108.83110.601381534308-1.77138153430839
25111.54111.0768299244130.463170075587152
26111.74111.0616029433940.678397056606462
27112.04111.0624869788300.977513021170394
28111.74111.5374638592510.202536140749375
29111.81111.872764627089-0.0627646270894136
30111.86111.8126878417740.0473121582258109
31114.23112.1298816323562.10011836764422
32114.8113.1429605283321.65703947166806
33115.17114.0812176537621.08878234623832
34115.11115.455870600306-0.345870600306207
35114.43116.796793245667-2.36679324566722
36114.66116.899500204301-2.23950020430146
37115.11117.206693637701-2.09669363770069
38117.74117.5020659067540.237934093246223
39118.18118.1596685306390.0203314693609084
40118.56118.2360254077360.323974592263670
41117.63118.218003898917-0.588003898916652
42117.71117.949733238616-0.239733238616165
43117.46118.144485304783-0.684485304782579
44117.37118.239114469518-0.86911446951819
45117.34118.393906215430-1.05390621542977
46117.09118.660315963589-1.57031596358853
47116.65118.672601648976-2.0226016489758
48116.71119.038217408187-2.32821740818691
49116.82119.380560754367-2.56056075436665
50117.33120.300806701741-2.97080670174077
51117.95121.156923212497-3.20692321249726
52123.53121.2095034124322.32049658756769
53124.91121.9170988514052.99290114859502
54125.99122.0797702450373.9102297549628
55126.29122.2318916607444.05810833925627
56125.68122.6065255084323.07347449156778
57125.52123.3621983181042.15780168189606

\begin{tabular}{lllllllll}
\hline
Multiple Linear Regression - Actuals, Interpolation, and Residuals \tabularnewline
Time or Index & Actuals & InterpolationForecast & ResidualsPrediction Error \tabularnewline
1 & 105.31 & 104.534500503217 & 0.77549949678294 \tabularnewline
2 & 105.63 & 105.003859409040 & 0.626140590960301 \tabularnewline
3 & 106.02 & 105.374664072032 & 0.645335927968043 \tabularnewline
4 & 105.85 & 105.604344568692 & 0.24565543130775 \tabularnewline
5 & 106.57 & 105.424791520575 & 1.14520847942466 \tabularnewline
6 & 106.48 & 105.866919343720 & 0.613080656280156 \tabularnewline
7 & 106.6 & 106.121835304141 & 0.478164695859128 \tabularnewline
8 & 106.75 & 106.318540998183 & 0.431459001817385 \tabularnewline
9 & 106.69 & 106.755377391490 & -0.0653773914895447 \tabularnewline
10 & 106.69 & 107.198812608124 & -0.50881260812395 \tabularnewline
11 & 106.93 & 107.308850096425 & -0.378850096425148 \tabularnewline
12 & 107.21 & 107.256888004561 & -0.0468880045610305 \tabularnewline
13 & 107.88 & 107.626222617300 & 0.253777382699796 \tabularnewline
14 & 108.84 & 107.842190493461 & 0.99780950653949 \tabularnewline
15 & 108.96 & 108.090077006585 & 0.869922993415447 \tabularnewline
16 & 109.52 & 108.106916013589 & 1.41308398641105 \tabularnewline
17 & 108.45 & 108.502606051844 & -0.0526060518440726 \tabularnewline
18 & 108.67 & 108.837988991873 & -0.16798899187339 \tabularnewline
19 & 108.96 & 108.784355396351 & 0.175644603649353 \tabularnewline
20 & 108.76 & 109.558743422491 & -0.798743422490829 \tabularnewline
21 & 107.85 & 109.820753238402 & -1.97075323840175 \tabularnewline
22 & 108.78 & 110.074513373382 & -1.2945133733817 \tabularnewline
23 & 107.51 & 110.228697705138 & -2.71869770513762 \tabularnewline
24 & 108.83 & 110.601381534308 & -1.77138153430839 \tabularnewline
25 & 111.54 & 111.076829924413 & 0.463170075587152 \tabularnewline
26 & 111.74 & 111.061602943394 & 0.678397056606462 \tabularnewline
27 & 112.04 & 111.062486978830 & 0.977513021170394 \tabularnewline
28 & 111.74 & 111.537463859251 & 0.202536140749375 \tabularnewline
29 & 111.81 & 111.872764627089 & -0.0627646270894136 \tabularnewline
30 & 111.86 & 111.812687841774 & 0.0473121582258109 \tabularnewline
31 & 114.23 & 112.129881632356 & 2.10011836764422 \tabularnewline
32 & 114.8 & 113.142960528332 & 1.65703947166806 \tabularnewline
33 & 115.17 & 114.081217653762 & 1.08878234623832 \tabularnewline
34 & 115.11 & 115.455870600306 & -0.345870600306207 \tabularnewline
35 & 114.43 & 116.796793245667 & -2.36679324566722 \tabularnewline
36 & 114.66 & 116.899500204301 & -2.23950020430146 \tabularnewline
37 & 115.11 & 117.206693637701 & -2.09669363770069 \tabularnewline
38 & 117.74 & 117.502065906754 & 0.237934093246223 \tabularnewline
39 & 118.18 & 118.159668530639 & 0.0203314693609084 \tabularnewline
40 & 118.56 & 118.236025407736 & 0.323974592263670 \tabularnewline
41 & 117.63 & 118.218003898917 & -0.588003898916652 \tabularnewline
42 & 117.71 & 117.949733238616 & -0.239733238616165 \tabularnewline
43 & 117.46 & 118.144485304783 & -0.684485304782579 \tabularnewline
44 & 117.37 & 118.239114469518 & -0.86911446951819 \tabularnewline
45 & 117.34 & 118.393906215430 & -1.05390621542977 \tabularnewline
46 & 117.09 & 118.660315963589 & -1.57031596358853 \tabularnewline
47 & 116.65 & 118.672601648976 & -2.0226016489758 \tabularnewline
48 & 116.71 & 119.038217408187 & -2.32821740818691 \tabularnewline
49 & 116.82 & 119.380560754367 & -2.56056075436665 \tabularnewline
50 & 117.33 & 120.300806701741 & -2.97080670174077 \tabularnewline
51 & 117.95 & 121.156923212497 & -3.20692321249726 \tabularnewline
52 & 123.53 & 121.209503412432 & 2.32049658756769 \tabularnewline
53 & 124.91 & 121.917098851405 & 2.99290114859502 \tabularnewline
54 & 125.99 & 122.079770245037 & 3.9102297549628 \tabularnewline
55 & 126.29 & 122.231891660744 & 4.05810833925627 \tabularnewline
56 & 125.68 & 122.606525508432 & 3.07347449156778 \tabularnewline
57 & 125.52 & 123.362198318104 & 2.15780168189606 \tabularnewline
\hline
\end{tabular}
%Source: https://freestatistics.org/blog/index.php?pk=113291&T=4

[TABLE]
[ROW][C]Multiple Linear Regression - Actuals, Interpolation, and Residuals[/C][/ROW]
[ROW][C]Time or Index[/C][C]Actuals[/C][C]InterpolationForecast[/C][C]ResidualsPrediction Error[/C][/ROW]
[ROW][C]1[/C][C]105.31[/C][C]104.534500503217[/C][C]0.77549949678294[/C][/ROW]
[ROW][C]2[/C][C]105.63[/C][C]105.003859409040[/C][C]0.626140590960301[/C][/ROW]
[ROW][C]3[/C][C]106.02[/C][C]105.374664072032[/C][C]0.645335927968043[/C][/ROW]
[ROW][C]4[/C][C]105.85[/C][C]105.604344568692[/C][C]0.24565543130775[/C][/ROW]
[ROW][C]5[/C][C]106.57[/C][C]105.424791520575[/C][C]1.14520847942466[/C][/ROW]
[ROW][C]6[/C][C]106.48[/C][C]105.866919343720[/C][C]0.613080656280156[/C][/ROW]
[ROW][C]7[/C][C]106.6[/C][C]106.121835304141[/C][C]0.478164695859128[/C][/ROW]
[ROW][C]8[/C][C]106.75[/C][C]106.318540998183[/C][C]0.431459001817385[/C][/ROW]
[ROW][C]9[/C][C]106.69[/C][C]106.755377391490[/C][C]-0.0653773914895447[/C][/ROW]
[ROW][C]10[/C][C]106.69[/C][C]107.198812608124[/C][C]-0.50881260812395[/C][/ROW]
[ROW][C]11[/C][C]106.93[/C][C]107.308850096425[/C][C]-0.378850096425148[/C][/ROW]
[ROW][C]12[/C][C]107.21[/C][C]107.256888004561[/C][C]-0.0468880045610305[/C][/ROW]
[ROW][C]13[/C][C]107.88[/C][C]107.626222617300[/C][C]0.253777382699796[/C][/ROW]
[ROW][C]14[/C][C]108.84[/C][C]107.842190493461[/C][C]0.99780950653949[/C][/ROW]
[ROW][C]15[/C][C]108.96[/C][C]108.090077006585[/C][C]0.869922993415447[/C][/ROW]
[ROW][C]16[/C][C]109.52[/C][C]108.106916013589[/C][C]1.41308398641105[/C][/ROW]
[ROW][C]17[/C][C]108.45[/C][C]108.502606051844[/C][C]-0.0526060518440726[/C][/ROW]
[ROW][C]18[/C][C]108.67[/C][C]108.837988991873[/C][C]-0.16798899187339[/C][/ROW]
[ROW][C]19[/C][C]108.96[/C][C]108.784355396351[/C][C]0.175644603649353[/C][/ROW]
[ROW][C]20[/C][C]108.76[/C][C]109.558743422491[/C][C]-0.798743422490829[/C][/ROW]
[ROW][C]21[/C][C]107.85[/C][C]109.820753238402[/C][C]-1.97075323840175[/C][/ROW]
[ROW][C]22[/C][C]108.78[/C][C]110.074513373382[/C][C]-1.2945133733817[/C][/ROW]
[ROW][C]23[/C][C]107.51[/C][C]110.228697705138[/C][C]-2.71869770513762[/C][/ROW]
[ROW][C]24[/C][C]108.83[/C][C]110.601381534308[/C][C]-1.77138153430839[/C][/ROW]
[ROW][C]25[/C][C]111.54[/C][C]111.076829924413[/C][C]0.463170075587152[/C][/ROW]
[ROW][C]26[/C][C]111.74[/C][C]111.061602943394[/C][C]0.678397056606462[/C][/ROW]
[ROW][C]27[/C][C]112.04[/C][C]111.062486978830[/C][C]0.977513021170394[/C][/ROW]
[ROW][C]28[/C][C]111.74[/C][C]111.537463859251[/C][C]0.202536140749375[/C][/ROW]
[ROW][C]29[/C][C]111.81[/C][C]111.872764627089[/C][C]-0.0627646270894136[/C][/ROW]
[ROW][C]30[/C][C]111.86[/C][C]111.812687841774[/C][C]0.0473121582258109[/C][/ROW]
[ROW][C]31[/C][C]114.23[/C][C]112.129881632356[/C][C]2.10011836764422[/C][/ROW]
[ROW][C]32[/C][C]114.8[/C][C]113.142960528332[/C][C]1.65703947166806[/C][/ROW]
[ROW][C]33[/C][C]115.17[/C][C]114.081217653762[/C][C]1.08878234623832[/C][/ROW]
[ROW][C]34[/C][C]115.11[/C][C]115.455870600306[/C][C]-0.345870600306207[/C][/ROW]
[ROW][C]35[/C][C]114.43[/C][C]116.796793245667[/C][C]-2.36679324566722[/C][/ROW]
[ROW][C]36[/C][C]114.66[/C][C]116.899500204301[/C][C]-2.23950020430146[/C][/ROW]
[ROW][C]37[/C][C]115.11[/C][C]117.206693637701[/C][C]-2.09669363770069[/C][/ROW]
[ROW][C]38[/C][C]117.74[/C][C]117.502065906754[/C][C]0.237934093246223[/C][/ROW]
[ROW][C]39[/C][C]118.18[/C][C]118.159668530639[/C][C]0.0203314693609084[/C][/ROW]
[ROW][C]40[/C][C]118.56[/C][C]118.236025407736[/C][C]0.323974592263670[/C][/ROW]
[ROW][C]41[/C][C]117.63[/C][C]118.218003898917[/C][C]-0.588003898916652[/C][/ROW]
[ROW][C]42[/C][C]117.71[/C][C]117.949733238616[/C][C]-0.239733238616165[/C][/ROW]
[ROW][C]43[/C][C]117.46[/C][C]118.144485304783[/C][C]-0.684485304782579[/C][/ROW]
[ROW][C]44[/C][C]117.37[/C][C]118.239114469518[/C][C]-0.86911446951819[/C][/ROW]
[ROW][C]45[/C][C]117.34[/C][C]118.393906215430[/C][C]-1.05390621542977[/C][/ROW]
[ROW][C]46[/C][C]117.09[/C][C]118.660315963589[/C][C]-1.57031596358853[/C][/ROW]
[ROW][C]47[/C][C]116.65[/C][C]118.672601648976[/C][C]-2.0226016489758[/C][/ROW]
[ROW][C]48[/C][C]116.71[/C][C]119.038217408187[/C][C]-2.32821740818691[/C][/ROW]
[ROW][C]49[/C][C]116.82[/C][C]119.380560754367[/C][C]-2.56056075436665[/C][/ROW]
[ROW][C]50[/C][C]117.33[/C][C]120.300806701741[/C][C]-2.97080670174077[/C][/ROW]
[ROW][C]51[/C][C]117.95[/C][C]121.156923212497[/C][C]-3.20692321249726[/C][/ROW]
[ROW][C]52[/C][C]123.53[/C][C]121.209503412432[/C][C]2.32049658756769[/C][/ROW]
[ROW][C]53[/C][C]124.91[/C][C]121.917098851405[/C][C]2.99290114859502[/C][/ROW]
[ROW][C]54[/C][C]125.99[/C][C]122.079770245037[/C][C]3.9102297549628[/C][/ROW]
[ROW][C]55[/C][C]126.29[/C][C]122.231891660744[/C][C]4.05810833925627[/C][/ROW]
[ROW][C]56[/C][C]125.68[/C][C]122.606525508432[/C][C]3.07347449156778[/C][/ROW]
[ROW][C]57[/C][C]125.52[/C][C]123.362198318104[/C][C]2.15780168189606[/C][/ROW]
[/TABLE]
Source: https://freestatistics.org/blog/index.php?pk=113291&T=4

Globally Unique Identifier (entire table): ba.freestatistics.org/blog/index.php?pk=113291&T=4

As an alternative you can also use a QR Code:  

The GUIDs for individual cells are displayed in the table below:

Multiple Linear Regression - Actuals, Interpolation, and Residuals
Time or IndexActualsInterpolationForecastResidualsPrediction Error
1105.31104.5345005032170.77549949678294
2105.63105.0038594090400.626140590960301
3106.02105.3746640720320.645335927968043
4105.85105.6043445686920.24565543130775
5106.57105.4247915205751.14520847942466
6106.48105.8669193437200.613080656280156
7106.6106.1218353041410.478164695859128
8106.75106.3185409981830.431459001817385
9106.69106.755377391490-0.0653773914895447
10106.69107.198812608124-0.50881260812395
11106.93107.308850096425-0.378850096425148
12107.21107.256888004561-0.0468880045610305
13107.88107.6262226173000.253777382699796
14108.84107.8421904934610.99780950653949
15108.96108.0900770065850.869922993415447
16109.52108.1069160135891.41308398641105
17108.45108.502606051844-0.0526060518440726
18108.67108.837988991873-0.16798899187339
19108.96108.7843553963510.175644603649353
20108.76109.558743422491-0.798743422490829
21107.85109.820753238402-1.97075323840175
22108.78110.074513373382-1.2945133733817
23107.51110.228697705138-2.71869770513762
24108.83110.601381534308-1.77138153430839
25111.54111.0768299244130.463170075587152
26111.74111.0616029433940.678397056606462
27112.04111.0624869788300.977513021170394
28111.74111.5374638592510.202536140749375
29111.81111.872764627089-0.0627646270894136
30111.86111.8126878417740.0473121582258109
31114.23112.1298816323562.10011836764422
32114.8113.1429605283321.65703947166806
33115.17114.0812176537621.08878234623832
34115.11115.455870600306-0.345870600306207
35114.43116.796793245667-2.36679324566722
36114.66116.899500204301-2.23950020430146
37115.11117.206693637701-2.09669363770069
38117.74117.5020659067540.237934093246223
39118.18118.1596685306390.0203314693609084
40118.56118.2360254077360.323974592263670
41117.63118.218003898917-0.588003898916652
42117.71117.949733238616-0.239733238616165
43117.46118.144485304783-0.684485304782579
44117.37118.239114469518-0.86911446951819
45117.34118.393906215430-1.05390621542977
46117.09118.660315963589-1.57031596358853
47116.65118.672601648976-2.0226016489758
48116.71119.038217408187-2.32821740818691
49116.82119.380560754367-2.56056075436665
50117.33120.300806701741-2.97080670174077
51117.95121.156923212497-3.20692321249726
52123.53121.2095034124322.32049658756769
53124.91121.9170988514052.99290114859502
54125.99122.0797702450373.9102297549628
55126.29122.2318916607444.05810833925627
56125.68122.6065255084323.07347449156778
57125.52123.3621983181042.15780168189606


Goldfeld-Quandt test for Heteroskedasticity
p-valuesAlternative Hypothesis
breakpoint indexgreater2-sidedless
80.002302723329224570.004605446658449130.997697276670775
90.0002557971594645560.0005115943189291130.999744202840535
102.88664277776235e-055.7732855555247e-050.999971133572222
114.07588686519579e-068.15177373039158e-060.999995924113135
128.81895071005226e-071.76379014201045e-060.99999911810493
134.4128112650421e-078.8256225300842e-070.999999558718873
145.64768328883484e-071.12953665776697e-060.999999435231671
151.12910206613842e-072.25820413227684e-070.999999887089793
162.43438275864899e-084.86876551729798e-080.999999975656172
177.17216596785843e-071.43443319357169e-060.999999282783403
184.54277969692796e-079.08555939385591e-070.99999954572203
192.04521869029783e-074.09043738059565e-070.999999795478131
204.64900870217136e-089.29801740434271e-080.999999953509913
212.20095792742159e-074.40191585484318e-070.999999779904207
225.57595775695688e-081.11519155139138e-070.999999944240422
232.16250269472570e-084.32500538945139e-080.999999978374973
241.40116957136468e-072.80233914272935e-070.999999859883043
251.21907644925330e-052.43815289850660e-050.999987809235507
264.3173862274851e-068.6347724549702e-060.999995682613772
271.46423530523163e-062.92847061046326e-060.999998535764695
286.12565901134586e-071.22513180226917e-060.999999387434099
293.11779952191577e-076.23559904383153e-070.999999688220048
306.17172151943033e-071.23434430388607e-060.999999382827848
311.19057353756621e-062.38114707513242e-060.999998809426462
322.98584941040099e-065.97169882080197e-060.99999701415059
331.80058738310612e-053.60117476621223e-050.999981994126169
340.000127543935648370.000255087871296740.999872456064352
350.0001775218493580870.0003550436987161730.999822478150642
360.0005182928958770120.001036585791754020.999481707104123
370.001321574065126290.002643148130252590.998678425934874
380.004733511884381120.009467023768762240.995266488115619
390.003344414105553310.006688828211106610.996655585894447
400.002178445650559790.004356891301119580.99782155434944
410.001166533035288590.002333066070577180.998833466964711
420.001111182492376680.002222364984753350.998888817507623
430.001326055808208570.002652111616417150.998673944191791
440.006278830105109860.01255766021021970.99372116989489
450.08159086329742240.1631817265948450.918409136702578
460.08410296386975450.1682059277395090.915897036130246
470.1656661403661310.3313322807322620.834333859633869
480.2050401984552160.4100803969104330.794959801544784
490.1659237288868230.3318474577736460.834076271113177

\begin{tabular}{lllllllll}
\hline
Goldfeld-Quandt test for Heteroskedasticity \tabularnewline
p-values & Alternative Hypothesis \tabularnewline
breakpoint index & greater & 2-sided & less \tabularnewline
8 & 0.00230272332922457 & 0.00460544665844913 & 0.997697276670775 \tabularnewline
9 & 0.000255797159464556 & 0.000511594318929113 & 0.999744202840535 \tabularnewline
10 & 2.88664277776235e-05 & 5.7732855555247e-05 & 0.999971133572222 \tabularnewline
11 & 4.07588686519579e-06 & 8.15177373039158e-06 & 0.999995924113135 \tabularnewline
12 & 8.81895071005226e-07 & 1.76379014201045e-06 & 0.99999911810493 \tabularnewline
13 & 4.4128112650421e-07 & 8.8256225300842e-07 & 0.999999558718873 \tabularnewline
14 & 5.64768328883484e-07 & 1.12953665776697e-06 & 0.999999435231671 \tabularnewline
15 & 1.12910206613842e-07 & 2.25820413227684e-07 & 0.999999887089793 \tabularnewline
16 & 2.43438275864899e-08 & 4.86876551729798e-08 & 0.999999975656172 \tabularnewline
17 & 7.17216596785843e-07 & 1.43443319357169e-06 & 0.999999282783403 \tabularnewline
18 & 4.54277969692796e-07 & 9.08555939385591e-07 & 0.99999954572203 \tabularnewline
19 & 2.04521869029783e-07 & 4.09043738059565e-07 & 0.999999795478131 \tabularnewline
20 & 4.64900870217136e-08 & 9.29801740434271e-08 & 0.999999953509913 \tabularnewline
21 & 2.20095792742159e-07 & 4.40191585484318e-07 & 0.999999779904207 \tabularnewline
22 & 5.57595775695688e-08 & 1.11519155139138e-07 & 0.999999944240422 \tabularnewline
23 & 2.16250269472570e-08 & 4.32500538945139e-08 & 0.999999978374973 \tabularnewline
24 & 1.40116957136468e-07 & 2.80233914272935e-07 & 0.999999859883043 \tabularnewline
25 & 1.21907644925330e-05 & 2.43815289850660e-05 & 0.999987809235507 \tabularnewline
26 & 4.3173862274851e-06 & 8.6347724549702e-06 & 0.999995682613772 \tabularnewline
27 & 1.46423530523163e-06 & 2.92847061046326e-06 & 0.999998535764695 \tabularnewline
28 & 6.12565901134586e-07 & 1.22513180226917e-06 & 0.999999387434099 \tabularnewline
29 & 3.11779952191577e-07 & 6.23559904383153e-07 & 0.999999688220048 \tabularnewline
30 & 6.17172151943033e-07 & 1.23434430388607e-06 & 0.999999382827848 \tabularnewline
31 & 1.19057353756621e-06 & 2.38114707513242e-06 & 0.999998809426462 \tabularnewline
32 & 2.98584941040099e-06 & 5.97169882080197e-06 & 0.99999701415059 \tabularnewline
33 & 1.80058738310612e-05 & 3.60117476621223e-05 & 0.999981994126169 \tabularnewline
34 & 0.00012754393564837 & 0.00025508787129674 & 0.999872456064352 \tabularnewline
35 & 0.000177521849358087 & 0.000355043698716173 & 0.999822478150642 \tabularnewline
36 & 0.000518292895877012 & 0.00103658579175402 & 0.999481707104123 \tabularnewline
37 & 0.00132157406512629 & 0.00264314813025259 & 0.998678425934874 \tabularnewline
38 & 0.00473351188438112 & 0.00946702376876224 & 0.995266488115619 \tabularnewline
39 & 0.00334441410555331 & 0.00668882821110661 & 0.996655585894447 \tabularnewline
40 & 0.00217844565055979 & 0.00435689130111958 & 0.99782155434944 \tabularnewline
41 & 0.00116653303528859 & 0.00233306607057718 & 0.998833466964711 \tabularnewline
42 & 0.00111118249237668 & 0.00222236498475335 & 0.998888817507623 \tabularnewline
43 & 0.00132605580820857 & 0.00265211161641715 & 0.998673944191791 \tabularnewline
44 & 0.00627883010510986 & 0.0125576602102197 & 0.99372116989489 \tabularnewline
45 & 0.0815908632974224 & 0.163181726594845 & 0.918409136702578 \tabularnewline
46 & 0.0841029638697545 & 0.168205927739509 & 0.915897036130246 \tabularnewline
47 & 0.165666140366131 & 0.331332280732262 & 0.834333859633869 \tabularnewline
48 & 0.205040198455216 & 0.410080396910433 & 0.794959801544784 \tabularnewline
49 & 0.165923728886823 & 0.331847457773646 & 0.834076271113177 \tabularnewline
\hline
\end{tabular}
%Source: https://freestatistics.org/blog/index.php?pk=113291&T=5

[TABLE]
[ROW][C]Goldfeld-Quandt test for Heteroskedasticity[/C][/ROW]
[ROW][C]p-values[/C][C]Alternative Hypothesis[/C][/ROW]
[ROW][C]breakpoint index[/C][C]greater[/C][C]2-sided[/C][C]less[/C][/ROW]
[ROW][C]8[/C][C]0.00230272332922457[/C][C]0.00460544665844913[/C][C]0.997697276670775[/C][/ROW]
[ROW][C]9[/C][C]0.000255797159464556[/C][C]0.000511594318929113[/C][C]0.999744202840535[/C][/ROW]
[ROW][C]10[/C][C]2.88664277776235e-05[/C][C]5.7732855555247e-05[/C][C]0.999971133572222[/C][/ROW]
[ROW][C]11[/C][C]4.07588686519579e-06[/C][C]8.15177373039158e-06[/C][C]0.999995924113135[/C][/ROW]
[ROW][C]12[/C][C]8.81895071005226e-07[/C][C]1.76379014201045e-06[/C][C]0.99999911810493[/C][/ROW]
[ROW][C]13[/C][C]4.4128112650421e-07[/C][C]8.8256225300842e-07[/C][C]0.999999558718873[/C][/ROW]
[ROW][C]14[/C][C]5.64768328883484e-07[/C][C]1.12953665776697e-06[/C][C]0.999999435231671[/C][/ROW]
[ROW][C]15[/C][C]1.12910206613842e-07[/C][C]2.25820413227684e-07[/C][C]0.999999887089793[/C][/ROW]
[ROW][C]16[/C][C]2.43438275864899e-08[/C][C]4.86876551729798e-08[/C][C]0.999999975656172[/C][/ROW]
[ROW][C]17[/C][C]7.17216596785843e-07[/C][C]1.43443319357169e-06[/C][C]0.999999282783403[/C][/ROW]
[ROW][C]18[/C][C]4.54277969692796e-07[/C][C]9.08555939385591e-07[/C][C]0.99999954572203[/C][/ROW]
[ROW][C]19[/C][C]2.04521869029783e-07[/C][C]4.09043738059565e-07[/C][C]0.999999795478131[/C][/ROW]
[ROW][C]20[/C][C]4.64900870217136e-08[/C][C]9.29801740434271e-08[/C][C]0.999999953509913[/C][/ROW]
[ROW][C]21[/C][C]2.20095792742159e-07[/C][C]4.40191585484318e-07[/C][C]0.999999779904207[/C][/ROW]
[ROW][C]22[/C][C]5.57595775695688e-08[/C][C]1.11519155139138e-07[/C][C]0.999999944240422[/C][/ROW]
[ROW][C]23[/C][C]2.16250269472570e-08[/C][C]4.32500538945139e-08[/C][C]0.999999978374973[/C][/ROW]
[ROW][C]24[/C][C]1.40116957136468e-07[/C][C]2.80233914272935e-07[/C][C]0.999999859883043[/C][/ROW]
[ROW][C]25[/C][C]1.21907644925330e-05[/C][C]2.43815289850660e-05[/C][C]0.999987809235507[/C][/ROW]
[ROW][C]26[/C][C]4.3173862274851e-06[/C][C]8.6347724549702e-06[/C][C]0.999995682613772[/C][/ROW]
[ROW][C]27[/C][C]1.46423530523163e-06[/C][C]2.92847061046326e-06[/C][C]0.999998535764695[/C][/ROW]
[ROW][C]28[/C][C]6.12565901134586e-07[/C][C]1.22513180226917e-06[/C][C]0.999999387434099[/C][/ROW]
[ROW][C]29[/C][C]3.11779952191577e-07[/C][C]6.23559904383153e-07[/C][C]0.999999688220048[/C][/ROW]
[ROW][C]30[/C][C]6.17172151943033e-07[/C][C]1.23434430388607e-06[/C][C]0.999999382827848[/C][/ROW]
[ROW][C]31[/C][C]1.19057353756621e-06[/C][C]2.38114707513242e-06[/C][C]0.999998809426462[/C][/ROW]
[ROW][C]32[/C][C]2.98584941040099e-06[/C][C]5.97169882080197e-06[/C][C]0.99999701415059[/C][/ROW]
[ROW][C]33[/C][C]1.80058738310612e-05[/C][C]3.60117476621223e-05[/C][C]0.999981994126169[/C][/ROW]
[ROW][C]34[/C][C]0.00012754393564837[/C][C]0.00025508787129674[/C][C]0.999872456064352[/C][/ROW]
[ROW][C]35[/C][C]0.000177521849358087[/C][C]0.000355043698716173[/C][C]0.999822478150642[/C][/ROW]
[ROW][C]36[/C][C]0.000518292895877012[/C][C]0.00103658579175402[/C][C]0.999481707104123[/C][/ROW]
[ROW][C]37[/C][C]0.00132157406512629[/C][C]0.00264314813025259[/C][C]0.998678425934874[/C][/ROW]
[ROW][C]38[/C][C]0.00473351188438112[/C][C]0.00946702376876224[/C][C]0.995266488115619[/C][/ROW]
[ROW][C]39[/C][C]0.00334441410555331[/C][C]0.00668882821110661[/C][C]0.996655585894447[/C][/ROW]
[ROW][C]40[/C][C]0.00217844565055979[/C][C]0.00435689130111958[/C][C]0.99782155434944[/C][/ROW]
[ROW][C]41[/C][C]0.00116653303528859[/C][C]0.00233306607057718[/C][C]0.998833466964711[/C][/ROW]
[ROW][C]42[/C][C]0.00111118249237668[/C][C]0.00222236498475335[/C][C]0.998888817507623[/C][/ROW]
[ROW][C]43[/C][C]0.00132605580820857[/C][C]0.00265211161641715[/C][C]0.998673944191791[/C][/ROW]
[ROW][C]44[/C][C]0.00627883010510986[/C][C]0.0125576602102197[/C][C]0.99372116989489[/C][/ROW]
[ROW][C]45[/C][C]0.0815908632974224[/C][C]0.163181726594845[/C][C]0.918409136702578[/C][/ROW]
[ROW][C]46[/C][C]0.0841029638697545[/C][C]0.168205927739509[/C][C]0.915897036130246[/C][/ROW]
[ROW][C]47[/C][C]0.165666140366131[/C][C]0.331332280732262[/C][C]0.834333859633869[/C][/ROW]
[ROW][C]48[/C][C]0.205040198455216[/C][C]0.410080396910433[/C][C]0.794959801544784[/C][/ROW]
[ROW][C]49[/C][C]0.165923728886823[/C][C]0.331847457773646[/C][C]0.834076271113177[/C][/ROW]
[/TABLE]
Source: https://freestatistics.org/blog/index.php?pk=113291&T=5

Globally Unique Identifier (entire table): ba.freestatistics.org/blog/index.php?pk=113291&T=5

As an alternative you can also use a QR Code:  

The GUIDs for individual cells are displayed in the table below:

Goldfeld-Quandt test for Heteroskedasticity
p-valuesAlternative Hypothesis
breakpoint indexgreater2-sidedless
80.002302723329224570.004605446658449130.997697276670775
90.0002557971594645560.0005115943189291130.999744202840535
102.88664277776235e-055.7732855555247e-050.999971133572222
114.07588686519579e-068.15177373039158e-060.999995924113135
128.81895071005226e-071.76379014201045e-060.99999911810493
134.4128112650421e-078.8256225300842e-070.999999558718873
145.64768328883484e-071.12953665776697e-060.999999435231671
151.12910206613842e-072.25820413227684e-070.999999887089793
162.43438275864899e-084.86876551729798e-080.999999975656172
177.17216596785843e-071.43443319357169e-060.999999282783403
184.54277969692796e-079.08555939385591e-070.99999954572203
192.04521869029783e-074.09043738059565e-070.999999795478131
204.64900870217136e-089.29801740434271e-080.999999953509913
212.20095792742159e-074.40191585484318e-070.999999779904207
225.57595775695688e-081.11519155139138e-070.999999944240422
232.16250269472570e-084.32500538945139e-080.999999978374973
241.40116957136468e-072.80233914272935e-070.999999859883043
251.21907644925330e-052.43815289850660e-050.999987809235507
264.3173862274851e-068.6347724549702e-060.999995682613772
271.46423530523163e-062.92847061046326e-060.999998535764695
286.12565901134586e-071.22513180226917e-060.999999387434099
293.11779952191577e-076.23559904383153e-070.999999688220048
306.17172151943033e-071.23434430388607e-060.999999382827848
311.19057353756621e-062.38114707513242e-060.999998809426462
322.98584941040099e-065.97169882080197e-060.99999701415059
331.80058738310612e-053.60117476621223e-050.999981994126169
340.000127543935648370.000255087871296740.999872456064352
350.0001775218493580870.0003550436987161730.999822478150642
360.0005182928958770120.001036585791754020.999481707104123
370.001321574065126290.002643148130252590.998678425934874
380.004733511884381120.009467023768762240.995266488115619
390.003344414105553310.006688828211106610.996655585894447
400.002178445650559790.004356891301119580.99782155434944
410.001166533035288590.002333066070577180.998833466964711
420.001111182492376680.002222364984753350.998888817507623
430.001326055808208570.002652111616417150.998673944191791
440.006278830105109860.01255766021021970.99372116989489
450.08159086329742240.1631817265948450.918409136702578
460.08410296386975450.1682059277395090.915897036130246
470.1656661403661310.3313322807322620.834333859633869
480.2050401984552160.4100803969104330.794959801544784
490.1659237288868230.3318474577736460.834076271113177


Meta Analysis of Goldfeld-Quandt test for Heteroskedasticity
Description# significant tests% significant testsOK/NOK
1% type I error level360.857142857142857NOK
5% type I error level370.880952380952381NOK
10% type I error level370.880952380952381NOK

\begin{tabular}{lllllllll}
\hline
Meta Analysis of Goldfeld-Quandt test for Heteroskedasticity \tabularnewline
Description & # significant tests & % significant tests & OK/NOK \tabularnewline
1% type I error level & 36 & 0.857142857142857 & NOK \tabularnewline
5% type I error level & 37 & 0.880952380952381 & NOK \tabularnewline
10% type I error level & 37 & 0.880952380952381 & NOK \tabularnewline
\hline
\end{tabular}
%Source: https://freestatistics.org/blog/index.php?pk=113291&T=6

[TABLE]
[ROW][C]Meta Analysis of Goldfeld-Quandt test for Heteroskedasticity[/C][/ROW]
[ROW][C]Description[/C][C]# significant tests[/C][C]% significant tests[/C][C]OK/NOK[/C][/ROW]
[ROW][C]1% type I error level[/C][C]36[/C][C]0.857142857142857[/C][C]NOK[/C][/ROW]
[ROW][C]5% type I error level[/C][C]37[/C][C]0.880952380952381[/C][C]NOK[/C][/ROW]
[ROW][C]10% type I error level[/C][C]37[/C][C]0.880952380952381[/C][C]NOK[/C][/ROW]
[/TABLE]
Source: https://freestatistics.org/blog/index.php?pk=113291&T=6

Globally Unique Identifier (entire table): ba.freestatistics.org/blog/index.php?pk=113291&T=6

As an alternative you can also use a QR Code:  

The GUIDs for individual cells are displayed in the table below:

Meta Analysis of Goldfeld-Quandt test for Heteroskedasticity
Description# significant tests% significant testsOK/NOK
1% type I error level360.857142857142857NOK
5% type I error level370.880952380952381NOK
10% type I error level370.880952380952381NOK


Parameters (Session):
par1 = 1 ; par2 = Do not include Seasonal Dummies ; par3 = Linear Trend ;
Parameters (R input):
par1 = 1 ; par2 = Do not include Seasonal Dummies ; par3 = Linear Trend ;
R code (references can be found in the software module):
library(lattice)
library(lmtest)
n25 <- 25 #minimum number of obs. for Goldfeld-Quandt test
par1 <- as.numeric(par1)
x <- t(y)
k <- length(x[1,])
n <- length(x[,1])
x1 <- cbind(x[,par1], x[,1:k!=par1])
mycolnames <- c(colnames(x)[par1], colnames(x)[1:k!=par1])
colnames(x1) <- mycolnames #colnames(x)[par1]
x <- x1
if (par3 == 'First Differences'){
x2 <- array(0, dim=c(n-1,k), dimnames=list(1:(n-1), paste('(1-B)',colnames(x),sep='')))
for (i in 1:n-1) {
for (j in 1:k) {
x2[i,j] <- x[i+1,j] - x[i,j]
}
}
x <- x2
}
if (par2 == 'Include Monthly Dummies'){
x2 <- array(0, dim=c(n,11), dimnames=list(1:n, paste('M', seq(1:11), sep ='')))
for (i in 1:11){
x2[seq(i,n,12),i] <- 1
}
x <- cbind(x, x2)
}
if (par2 == 'Include Quarterly Dummies'){
x2 <- array(0, dim=c(n,3), dimnames=list(1:n, paste('Q', seq(1:3), sep ='')))
for (i in 1:3){
x2[seq(i,n,4),i] <- 1
}
x <- cbind(x, x2)
}
k <- length(x[1,])
if (par3 == 'Linear Trend'){
x <- cbind(x, c(1:n))
colnames(x)[k+1] <- 't'
}
x
k <- length(x[1,])
df <- as.data.frame(x)
(mylm <- lm(df))
(mysum <- summary(mylm))
if (n > n25) {
kp3 <- k + 3
nmkm3 <- n - k - 3
gqarr <- array(NA, dim=c(nmkm3-kp3+1,3))
numgqtests <- 0
numsignificant1 <- 0
numsignificant5 <- 0
numsignificant10 <- 0
for (mypoint in kp3:nmkm3) {
j <- 0
numgqtests <- numgqtests + 1
for (myalt in c('greater', 'two.sided', 'less')) {
j <- j + 1
gqarr[mypoint-kp3+1,j] <- gqtest(mylm, point=mypoint, alternative=myalt)$p.value
}
if (gqarr[mypoint-kp3+1,2] < 0.01) numsignificant1 <- numsignificant1 + 1
if (gqarr[mypoint-kp3+1,2] < 0.05) numsignificant5 <- numsignificant5 + 1
if (gqarr[mypoint-kp3+1,2] < 0.10) numsignificant10 <- numsignificant10 + 1
}
gqarr
}
bitmap(file='test0.png')
plot(x[,1], type='l', main='Actuals and Interpolation', ylab='value of Actuals and Interpolation (dots)', xlab='time or index')
points(x[,1]-mysum$resid)
grid()
dev.off()
bitmap(file='test1.png')
plot(mysum$resid, type='b', pch=19, main='Residuals', ylab='value of Residuals', xlab='time or index')
grid()
dev.off()
bitmap(file='test2.png')
hist(mysum$resid, main='Residual Histogram', xlab='values of Residuals')
grid()
dev.off()
bitmap(file='test3.png')
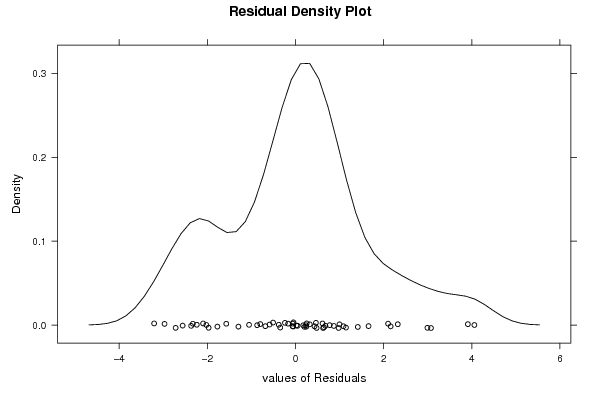
densityplot(~mysum$resid,col='black',main='Residual Density Plot', xlab='values of Residuals')
dev.off()
bitmap(file='test4.png')
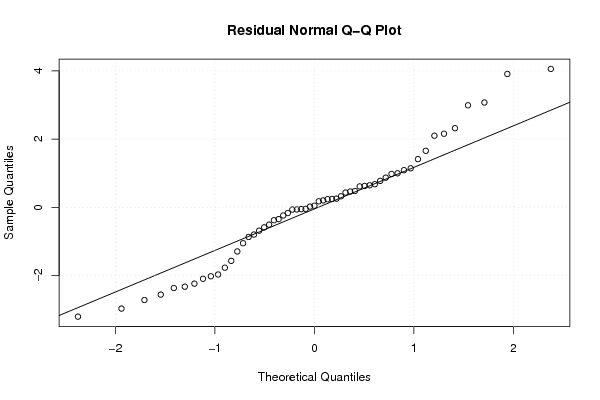
qqnorm(mysum$resid, main='Residual Normal Q-Q Plot')
qqline(mysum$resid)
grid()
dev.off()
(myerror <- as.ts(mysum$resid))
bitmap(file='test5.png')
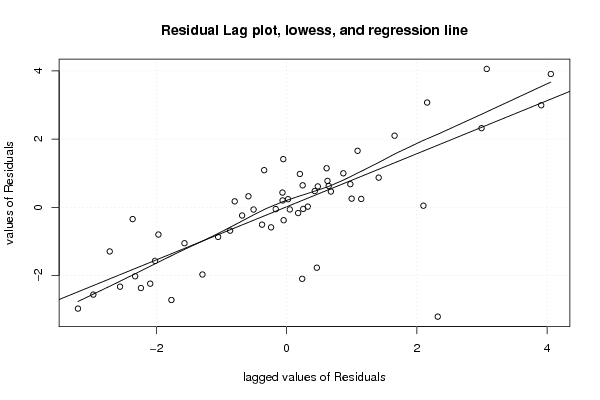
dum <- cbind(lag(myerror,k=1),myerror)
dum
dum1 <- dum[2:length(myerror),]
dum1
z <- as.data.frame(dum1)
z
plot(z,main=paste('Residual Lag plot, lowess, and regression line'), ylab='values of Residuals', xlab='lagged values of Residuals')
lines(lowess(z))
abline(lm(z))
grid()
dev.off()
bitmap(file='test6.png')
acf(mysum$resid, lag.max=length(mysum$resid)/2, main='Residual Autocorrelation Function')
grid()
dev.off()
bitmap(file='test7.png')
pacf(mysum$resid, lag.max=length(mysum$resid)/2, main='Residual Partial Autocorrelation Function')
grid()
dev.off()
bitmap(file='test8.png')
opar <- par(mfrow = c(2,2), oma = c(0, 0, 1.1, 0))
plot(mylm, las = 1, sub='Residual Diagnostics')
par(opar)
dev.off()
if (n > n25) {
bitmap(file='test9.png')
plot(kp3:nmkm3,gqarr[,2], main='Goldfeld-Quandt test',ylab='2-sided p-value',xlab='breakpoint')
grid()
dev.off()
}
load(file='createtable')
a<-table.start()
a<-table.row.start(a)
a<-table.element(a, 'Multiple Linear Regression - Estimated Regression Equation', 1, TRUE)
a<-table.row.end(a)
myeq <- colnames(x)[1]
myeq <- paste(myeq, '[t] = ', sep='')
for (i in 1:k){
if (mysum$coefficients[i,1] > 0) myeq <- paste(myeq, '+', '')
myeq <- paste(myeq, mysum$coefficients[i,1], sep=' ')
if (rownames(mysum$coefficients)[i] != '(Intercept)') {
myeq <- paste(myeq, rownames(mysum$coefficients)[i], sep='')
if (rownames(mysum$coefficients)[i] != 't') myeq <- paste(myeq, '[t]', sep='')
}
}
myeq <- paste(myeq, ' + e[t]')
a<-table.row.start(a)
a<-table.element(a, myeq)
a<-table.row.end(a)
a<-table.end(a)
table.save(a,file='mytable1.tab')
a<-table.start()
a<-table.row.start(a)
a<-table.element(a,hyperlink('ols1.htm','Multiple Linear Regression - Ordinary Least Squares',''), 6, TRUE)
a<-table.row.end(a)
a<-table.row.start(a)
a<-table.element(a,'Variable',header=TRUE)
a<-table.element(a,'Parameter',header=TRUE)
a<-table.element(a,'S.D.',header=TRUE)
a<-table.element(a,'T-STAT
H0: parameter = 0',header=TRUE)
a<-table.element(a,'2-tail p-value',header=TRUE)
a<-table.element(a,'1-tail p-value',header=TRUE)
a<-table.row.end(a)
for (i in 1:k){
a<-table.row.start(a)
a<-table.element(a,rownames(mysum$coefficients)[i],header=TRUE)
a<-table.element(a,mysum$coefficients[i,1])
a<-table.element(a, round(mysum$coefficients[i,2],6))
a<-table.element(a, round(mysum$coefficients[i,3],4))
a<-table.element(a, round(mysum$coefficients[i,4],6))
a<-table.element(a, round(mysum$coefficients[i,4]/2,6))
a<-table.row.end(a)
}
a<-table.end(a)
table.save(a,file='mytable2.tab')
a<-table.start()
a<-table.row.start(a)
a<-table.element(a, 'Multiple Linear Regression - Regression Statistics', 2, TRUE)
a<-table.row.end(a)
a<-table.row.start(a)
a<-table.element(a, 'Multiple R',1,TRUE)
a<-table.element(a, sqrt(mysum$r.squared))
a<-table.row.end(a)
a<-table.row.start(a)
a<-table.element(a, 'R-squared',1,TRUE)
a<-table.element(a, mysum$r.squared)
a<-table.row.end(a)
a<-table.row.start(a)
a<-table.element(a, 'Adjusted R-squared',1,TRUE)
a<-table.element(a, mysum$adj.r.squared)
a<-table.row.end(a)
a<-table.row.start(a)
a<-table.element(a, 'F-TEST (value)',1,TRUE)
a<-table.element(a, mysum$fstatistic[1])
a<-table.row.end(a)
a<-table.row.start(a)
a<-table.element(a, 'F-TEST (DF numerator)',1,TRUE)
a<-table.element(a, mysum$fstatistic[2])
a<-table.row.end(a)
a<-table.row.start(a)
a<-table.element(a, 'F-TEST (DF denominator)',1,TRUE)
a<-table.element(a, mysum$fstatistic[3])
a<-table.row.end(a)
a<-table.row.start(a)
a<-table.element(a, 'p-value',1,TRUE)
a<-table.element(a, 1-pf(mysum$fstatistic[1],mysum$fstatistic[2],mysum$fstatistic[3]))
a<-table.row.end(a)
a<-table.row.start(a)
a<-table.element(a, 'Multiple Linear Regression - Residual Statistics', 2, TRUE)
a<-table.row.end(a)
a<-table.row.start(a)
a<-table.element(a, 'Residual Standard Deviation',1,TRUE)
a<-table.element(a, mysum$sigma)
a<-table.row.end(a)
a<-table.row.start(a)
a<-table.element(a, 'Sum Squared Residuals',1,TRUE)
a<-table.element(a, sum(myerror*myerror))
a<-table.row.end(a)
a<-table.end(a)
table.save(a,file='mytable3.tab')
a<-table.start()
a<-table.row.start(a)
a<-table.element(a, 'Multiple Linear Regression - Actuals, Interpolation, and Residuals', 4, TRUE)
a<-table.row.end(a)
a<-table.row.start(a)
a<-table.element(a, 'Time or Index', 1, TRUE)
a<-table.element(a, 'Actuals', 1, TRUE)
a<-table.element(a, 'Interpolation
Forecast', 1, TRUE)
a<-table.element(a, 'Residuals
Prediction Error', 1, TRUE)
a<-table.row.end(a)
for (i in 1:n) {
a<-table.row.start(a)
a<-table.element(a,i, 1, TRUE)
a<-table.element(a,x[i])
a<-table.element(a,x[i]-mysum$resid[i])
a<-table.element(a,mysum$resid[i])
a<-table.row.end(a)
}
a<-table.end(a)
table.save(a,file='mytable4.tab')
if (n > n25) {
a<-table.start()
a<-table.row.start(a)
a<-table.element(a,'Goldfeld-Quandt test for Heteroskedasticity',4,TRUE)
a<-table.row.end(a)
a<-table.row.start(a)
a<-table.element(a,'p-values',header=TRUE)
a<-table.element(a,'Alternative Hypothesis',3,header=TRUE)
a<-table.row.end(a)
a<-table.row.start(a)
a<-table.element(a,'breakpoint index',header=TRUE)
a<-table.element(a,'greater',header=TRUE)
a<-table.element(a,'2-sided',header=TRUE)
a<-table.element(a,'less',header=TRUE)
a<-table.row.end(a)
for (mypoint in kp3:nmkm3) {
a<-table.row.start(a)
a<-table.element(a,mypoint,header=TRUE)
a<-table.element(a,gqarr[mypoint-kp3+1,1])
a<-table.element(a,gqarr[mypoint-kp3+1,2])
a<-table.element(a,gqarr[mypoint-kp3+1,3])
a<-table.row.end(a)
}
a<-table.end(a)
table.save(a,file='mytable5.tab')
a<-table.start()
a<-table.row.start(a)
a<-table.element(a,'Meta Analysis of Goldfeld-Quandt test for Heteroskedasticity',4,TRUE)
a<-table.row.end(a)
a<-table.row.start(a)
a<-table.element(a,'Description',header=TRUE)
a<-table.element(a,'# significant tests',header=TRUE)
a<-table.element(a,'% significant tests',header=TRUE)
a<-table.element(a,'OK/NOK',header=TRUE)
a<-table.row.end(a)
a<-table.row.start(a)
a<-table.element(a,'1% type I error level',header=TRUE)
a<-table.element(a,numsignificant1)
a<-table.element(a,numsignificant1/numgqtests)
if (numsignificant1/numgqtests < 0.01) dum <- 'OK' else dum <- 'NOK'
a<-table.element(a,dum)
a<-table.row.end(a)
a<-table.row.start(a)
a<-table.element(a,'5% type I error level',header=TRUE)
a<-table.element(a,numsignificant5)
a<-table.element(a,numsignificant5/numgqtests)
if (numsignificant5/numgqtests < 0.05) dum <- 'OK' else dum <- 'NOK'
a<-table.element(a,dum)
a<-table.row.end(a)
a<-table.row.start(a)
a<-table.element(a,'10% type I error level',header=TRUE)
a<-table.element(a,numsignificant10)
a<-table.element(a,numsignificant10/numgqtests)
if (numsignificant10/numgqtests < 0.1) dum <- 'OK' else dum <- 'NOK'
a<-table.element(a,dum)
a<-table.row.end(a)
a<-table.end(a)
table.save(a,file='mytable6.tab')
}