Free Statistics

of Irreproducible Research!

Author's title

Author*The author of this computation has been verified*
R Software Modulerwasp_multipleregression.wasp
Title produced by softwareMultiple Regression
Date of computationTue, 21 Dec 2010 11:10:31 +0000
Cite this page as followsStatistical Computations at FreeStatistics.org, Office for Research Development and Education, URL https://freestatistics.org/blog/index.php?v=date/2010/Dec/21/t1292929727bnwqn6dvmwqy2jx.htm/, Retrieved Wed, 08 May 2024 20:46:18 +0000
Statistical Computations at FreeStatistics.org, Office for Research Development and Education, URL https://freestatistics.org/blog/index.php?pk=113272, Retrieved Wed, 08 May 2024 20:46:18 +0000
QR Codes:

Original text written by user:
IsPrivate?No (this computation is public)
User-defined keywords
Estimated Impact17
Family? (F = Feedback message, R = changed R code, M = changed R Module, P = changed Parameters, D = changed Data)
-     [Bivariate Data Series] [Bivariate dataset] [2008-01-05 23:51:08] [74be16979710d4c4e7c6647856088456]
F RMPD  [Univariate Explorative Data Analysis] [Colombia Coffee] [2008-01-07 14:21:11] [74be16979710d4c4e7c6647856088456]
- RMPD    [Univariate Explorative Data Analysis] [Workshop 6, Tutor...] [2010-11-07 12:24:29] [8ffb4cfa64b4677df0d2c448735a40bb]
- R P       [Univariate Explorative Data Analysis] [WS6 2. Technique 2] [2010-11-11 18:06:41] [afe9379cca749d06b3d6872e02cc47ed]
- RMPD        [Multiple Regression] [Apple Inc - Multi...] [2010-12-11 10:33:09] [afe9379cca749d06b3d6872e02cc47ed]
-    D          [Multiple Regression] [WS10 Multiple Reg...] [2010-12-13 13:48:19] [afe9379cca749d06b3d6872e02cc47ed]
-    D              [Multiple Regression] [Paper - Multiple ...] [2010-12-21 11:10:31] [89d441ae0711e9b79b5d358f420c1317] [Current]
-    D                [Multiple Regression] [Paper - Multiple ...] [2010-12-21 11:18:37] [18fa53e8b37a5effc0c5f8a5122cdd2d]
-   P                 [Multiple Regression] [Paper - Multiple ...] [2010-12-21 11:31:18] [18fa53e8b37a5effc0c5f8a5122cdd2d]
-   PD                [Multiple Regression] [Paper - Multiple ...] [2010-12-21 11:34:09] [18fa53e8b37a5effc0c5f8a5122cdd2d]
-   P                   [Multiple Regression] [Paper - Multiple ...] [2010-12-21 11:39:48] [18fa53e8b37a5effc0c5f8a5122cdd2d]
Feedback Forum

Post a new message
Dataseries X:
105.31	1576.23	29.29	710.45
105.63	1546.37	28.99	720
106.02	1545.05	28.91	720
105.85	1552.34	29.29	720
106.57	1594.3	30.96	754.78
106.48	1605.78	30.57	802.73
106.60	1673.21	30.59	845.24
106.75	1612.94	31.39	893.91
106.69	1566.34	31.28	931.43
106.69	1530.17	31.1	940
106.93	1582.54	31.7	947.73
107.21	1702.16	32.57	960
107.88	1701.93	32.49	996.96
108.84	1811.15	32.46	1000
108.96	1924.2	32.3	1000
109.52	2034.25	32.97	1000
108.45	2011.13	32.9	1013.04
108.67	2013.04	32.93	1095.24
108.96	2151.67	33.72	1159.09
108.76	1902.09	33.33	1200
107.85	1944.01	33.44	1200
108.78	1916.67	33.89	1282.61
107.51	1967.31	34.34	1513.64
108.83	2119.88	33.56	1669.05
111.54	2216.38	32.67	1700
111.74	2522.83	32.57	1700
112.04	2647.64	33.23	1700
111.74	2631.23	32.85	1665.91
111.81	2693.41	32.61	1650
111.86	3021.76	32.57	1650
114.23	2953.67	32.98	1619.57
114.80	2796.8	31.33	1599.05
115.17	2672.05	29.8	1572.73
115.11	2251.23	28.06	1470
114.43	2046.08	25.47	1268
114.66	2420.04	24.65	1217.39
115.11	2608.89	23.94	1154.09
117.74	2660.47	23.89	984
118.18	2493.98	23.54	900
118.56	2541.7	24.28	900
117.63	2554.6	25.51	916.67
117.71	2699.61	27.03	957.73
117.46	2805.48	27.09	966.09
117.37	2956.66	27.3	980
117.34	3149.51	27.11	990.91
117.09	3372.5	26.39	1000.91
116.65	3379.33	27.54	1042.38
116.71	3517.54	26.85	1142.61
116.82	3527.34	26.82	1214.29
117.33	3281.06	25.9	1218
117.95	3089.65	24.96	1202.61
123.53	3222.76	25.4	1200
124.91	3165.76	24.38	1228.57
125.99	3232.43	24.73	1195.91
126.29	3229.54	25.43	1180
125.68	3071.74	26.04	1210.91
125.52	2850.17	25.59	1272.27


Summary of computational transaction
Raw Inputview raw input (R code)
Raw Outputview raw output of R engine
Computing time18 seconds
R Server'George Udny Yule' @ 72.249.76.132

\begin{tabular}{lllllllll}
\hline
Summary of computational transaction \tabularnewline
Raw Input & view raw input (R code)  \tabularnewline
Raw Output & view raw output of R engine  \tabularnewline
Computing time & 18 seconds \tabularnewline
R Server & 'George Udny Yule' @ 72.249.76.132 \tabularnewline
\hline
\end{tabular}
%Source: https://freestatistics.org/blog/index.php?pk=113272&T=0

[TABLE]
[ROW][C]Summary of computational transaction[/C][/ROW]
[ROW][C]Raw Input[/C][C]view raw input (R code) [/C][/ROW]
[ROW][C]Raw Output[/C][C]view raw output of R engine [/C][/ROW]
[ROW][C]Computing time[/C][C]18 seconds[/C][/ROW]
[ROW][C]R Server[/C][C]'George Udny Yule' @ 72.249.76.132[/C][/ROW]
[/TABLE]
Source: https://freestatistics.org/blog/index.php?pk=113272&T=0

Globally Unique Identifier (entire table): ba.freestatistics.org/blog/index.php?pk=113272&T=0

As an alternative you can also use a QR Code:  

The GUIDs for individual cells are displayed in the table below:

Summary of computational transaction
Raw Inputview raw input (R code)
Raw Outputview raw output of R engine
Computing time18 seconds
R Server'George Udny Yule' @ 72.249.76.132


Multiple Linear Regression - Estimated Regression Equation
PC&S[t] = + 125.283502689994 + 0.00463126562262942PCacao[t] -0.933123751644972PSuiker[t] + 0.00360428981886122PNoten[t] + e[t]

\begin{tabular}{lllllllll}
\hline
Multiple Linear Regression - Estimated Regression Equation \tabularnewline
PC&S[t] =  +  125.283502689994 +  0.00463126562262942PCacao[t] -0.933123751644972PSuiker[t] +  0.00360428981886122PNoten[t]  + e[t] \tabularnewline
\hline
\end{tabular}
%Source: https://freestatistics.org/blog/index.php?pk=113272&T=1

[TABLE]
[ROW][C]Multiple Linear Regression - Estimated Regression Equation[/C][/ROW]
[ROW][C]PC&S[t] =  +  125.283502689994 +  0.00463126562262942PCacao[t] -0.933123751644972PSuiker[t] +  0.00360428981886122PNoten[t]  + e[t][/C][/ROW]
[/TABLE]
Source: https://freestatistics.org/blog/index.php?pk=113272&T=1

Globally Unique Identifier (entire table): ba.freestatistics.org/blog/index.php?pk=113272&T=1

As an alternative you can also use a QR Code:  

The GUIDs for individual cells are displayed in the table below:

Multiple Linear Regression - Estimated Regression Equation
PC&S[t] = + 125.283502689994 + 0.00463126562262942PCacao[t] -0.933123751644972PSuiker[t] + 0.00360428981886122PNoten[t] + e[t]


Multiple Linear Regression - Ordinary Least Squares
VariableParameterS.D.T-STATH0: parameter = 02-tail p-value1-tail p-value
(Intercept)125.2835026899944.88516525.645700
PCacao0.004631265622629420.0008335.55881e-060
PSuiker-0.9331237516449720.147239-6.337500
PNoten0.003604289818861220.0015742.28920.0260820.013041

\begin{tabular}{lllllllll}
\hline
Multiple Linear Regression - Ordinary Least Squares \tabularnewline
Variable & Parameter & S.D. & T-STATH0: parameter = 0 & 2-tail p-value & 1-tail p-value \tabularnewline
(Intercept) & 125.283502689994 & 4.885165 & 25.6457 & 0 & 0 \tabularnewline
PCacao & 0.00463126562262942 & 0.000833 & 5.5588 & 1e-06 & 0 \tabularnewline
PSuiker & -0.933123751644972 & 0.147239 & -6.3375 & 0 & 0 \tabularnewline
PNoten & 0.00360428981886122 & 0.001574 & 2.2892 & 0.026082 & 0.013041 \tabularnewline
\hline
\end{tabular}
%Source: https://freestatistics.org/blog/index.php?pk=113272&T=2

[TABLE]
[ROW][C]Multiple Linear Regression - Ordinary Least Squares[/C][/ROW]
[ROW][C]Variable[/C][C]Parameter[/C][C]S.D.[/C][C]T-STATH0: parameter = 0[/C][C]2-tail p-value[/C][C]1-tail p-value[/C][/ROW]
[ROW][C](Intercept)[/C][C]125.283502689994[/C][C]4.885165[/C][C]25.6457[/C][C]0[/C][C]0[/C][/ROW]
[ROW][C]PCacao[/C][C]0.00463126562262942[/C][C]0.000833[/C][C]5.5588[/C][C]1e-06[/C][C]0[/C][/ROW]
[ROW][C]PSuiker[/C][C]-0.933123751644972[/C][C]0.147239[/C][C]-6.3375[/C][C]0[/C][C]0[/C][/ROW]
[ROW][C]PNoten[/C][C]0.00360428981886122[/C][C]0.001574[/C][C]2.2892[/C][C]0.026082[/C][C]0.013041[/C][/ROW]
[/TABLE]
Source: https://freestatistics.org/blog/index.php?pk=113272&T=2

Globally Unique Identifier (entire table): ba.freestatistics.org/blog/index.php?pk=113272&T=2

As an alternative you can also use a QR Code:  

The GUIDs for individual cells are displayed in the table below:

Multiple Linear Regression - Ordinary Least Squares
VariableParameterS.D.T-STATH0: parameter = 02-tail p-value1-tail p-value
(Intercept)125.2835026899944.88516525.645700
PCacao0.004631265622629420.0008335.55881e-060
PSuiker-0.9331237516449720.147239-6.337500
PNoten0.003604289818861220.0015742.28920.0260820.013041


Multiple Linear Regression - Regression Statistics
Multiple R0.921148485925745
R-squared0.848514533123293
Adjusted R-squared0.8399398840548
F-TEST (value)98.9561819201584
F-TEST (DF numerator)3
F-TEST (DF denominator)53
p-value0
Multiple Linear Regression - Residual Statistics
Residual Standard Deviation2.38745356518327
Sum Squared Residuals302.096529873035

\begin{tabular}{lllllllll}
\hline
Multiple Linear Regression - Regression Statistics \tabularnewline
Multiple R & 0.921148485925745 \tabularnewline
R-squared & 0.848514533123293 \tabularnewline
Adjusted R-squared & 0.8399398840548 \tabularnewline
F-TEST (value) & 98.9561819201584 \tabularnewline
F-TEST (DF numerator) & 3 \tabularnewline
F-TEST (DF denominator) & 53 \tabularnewline
p-value & 0 \tabularnewline
Multiple Linear Regression - Residual Statistics \tabularnewline
Residual Standard Deviation & 2.38745356518327 \tabularnewline
Sum Squared Residuals & 302.096529873035 \tabularnewline
\hline
\end{tabular}
%Source: https://freestatistics.org/blog/index.php?pk=113272&T=3

[TABLE]
[ROW][C]Multiple Linear Regression - Regression Statistics[/C][/ROW]
[ROW][C]Multiple R[/C][C]0.921148485925745[/C][/ROW]
[ROW][C]R-squared[/C][C]0.848514533123293[/C][/ROW]
[ROW][C]Adjusted R-squared[/C][C]0.8399398840548[/C][/ROW]
[ROW][C]F-TEST (value)[/C][C]98.9561819201584[/C][/ROW]
[ROW][C]F-TEST (DF numerator)[/C][C]3[/C][/ROW]
[ROW][C]F-TEST (DF denominator)[/C][C]53[/C][/ROW]
[ROW][C]p-value[/C][C]0[/C][/ROW]
[ROW][C]Multiple Linear Regression - Residual Statistics[/C][/ROW]
[ROW][C]Residual Standard Deviation[/C][C]2.38745356518327[/C][/ROW]
[ROW][C]Sum Squared Residuals[/C][C]302.096529873035[/C][/ROW]
[/TABLE]
Source: https://freestatistics.org/blog/index.php?pk=113272&T=3

Globally Unique Identifier (entire table): ba.freestatistics.org/blog/index.php?pk=113272&T=3

As an alternative you can also use a QR Code:  

The GUIDs for individual cells are displayed in the table below:

Multiple Linear Regression - Regression Statistics
Multiple R0.921148485925745
R-squared0.848514533123293
Adjusted R-squared0.8399398840548
F-TEST (value)98.9561819201584
F-TEST (DF numerator)3
F-TEST (DF denominator)53
p-value0
Multiple Linear Regression - Residual Statistics
Residual Standard Deviation2.38745356518327
Sum Squared Residuals302.096529873035


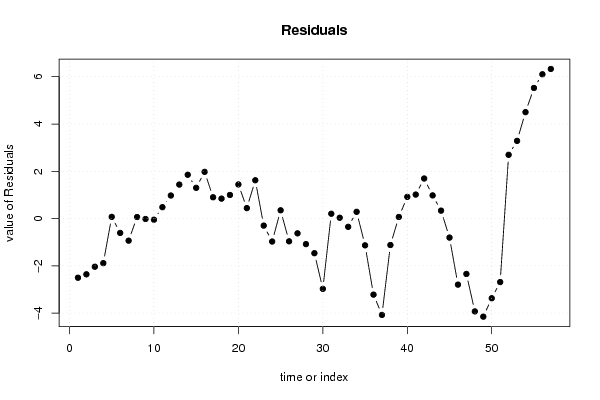
Multiple Linear Regression - Actuals, Interpolation, and Residuals
Time or IndexActualsInterpolationForecastResidualsPrediction Error
1105.31107.812915518479-2.50291551847936
2105.63107.988984020252-2.35898402025168
3106.02108.057520649761-2.03752064976142
4105.85107.736695550525-1.88669555052529
5106.57106.4980639907040.0719360092962835
6106.48107.087974880007-0.607974880007427
7106.6107.534817006108-0.93481700610823
8106.75106.6846124112000.0653875887996543
9106.69106.706671999870-0.0166719998704360
10106.69106.738010161344-0.0480101613436659
11106.93106.4485364513140.481463548686425
12107.21106.2349354172390.975064582761179
13107.88106.4417346779821.43826532201768
14108.84106.9865122628851.85348773711541
15108.96107.6593766417861.30062335821395
16109.52107.5438545099541.97614549004572
17108.45107.5490982506120.900901749387815
18108.67107.8262228785120.84377712148755
19108.96107.9612213729120.998778627087663
20108.76107.3167198584481.44328014155237
21107.85107.4082189006670.441781099332684
22108.78107.1594447922411.62055520775949
23107.51107.806765471982-0.296765471981723
24108.83109.801336875059-0.971336875058603
25111.54111.19028691650.349713083499884
26111.74112.702850641719-0.962850641719412
27112.04112.665017227994-0.625017227994101
28111.74112.820734944827-1.08073494482687
29111.81113.275312490619-1.46531249061867
30111.86114.833313507875-2.97331350787485
31114.23114.0257113542680.204288645732377
32114.8114.7648988791770.0351011208230774
33115.17115.519962924738-0.349962924738275
34115.11114.8244003601940.285599639805998
35114.43115.563020191062-1.13302019106208
36114.66117.877676651917-3.2176766519169
37115.11119.186657482884-4.07665748288448
38117.74118.859140695992-1.11914069599185
39118.18118.1119142507720.0680857492283319
40118.56117.6424066700660.917593329933734
41117.63116.6144912933551.01550870664471
42117.71116.0157151587551.69428484124513
43117.46116.4801716880100.979828311990368
44117.37117.0345061083740.335493891626348
45117.34118.144261998434-0.804261998434062
46117.09119.884879918997-2.79487991899719
47116.65118.992889047596-2.34288904759620
48116.71120.638089626479-3.92808962647932
49116.82120.969825236346-4.14982523634641
50117.33120.701082905547-3.37108290554658
51117.95120.636278658953-2.68627865895307
52123.53120.8327647788302.69723522116974
53124.91121.6235434251433.28645657485687
54125.99121.4880004856444.50199951435591
55126.29120.7640852508255.52591474917489
56125.68119.5754746453726.10452535462825
57125.52119.1903900328916.32960996710867

\begin{tabular}{lllllllll}
\hline
Multiple Linear Regression - Actuals, Interpolation, and Residuals \tabularnewline
Time or Index & Actuals & InterpolationForecast & ResidualsPrediction Error \tabularnewline
1 & 105.31 & 107.812915518479 & -2.50291551847936 \tabularnewline
2 & 105.63 & 107.988984020252 & -2.35898402025168 \tabularnewline
3 & 106.02 & 108.057520649761 & -2.03752064976142 \tabularnewline
4 & 105.85 & 107.736695550525 & -1.88669555052529 \tabularnewline
5 & 106.57 & 106.498063990704 & 0.0719360092962835 \tabularnewline
6 & 106.48 & 107.087974880007 & -0.607974880007427 \tabularnewline
7 & 106.6 & 107.534817006108 & -0.93481700610823 \tabularnewline
8 & 106.75 & 106.684612411200 & 0.0653875887996543 \tabularnewline
9 & 106.69 & 106.706671999870 & -0.0166719998704360 \tabularnewline
10 & 106.69 & 106.738010161344 & -0.0480101613436659 \tabularnewline
11 & 106.93 & 106.448536451314 & 0.481463548686425 \tabularnewline
12 & 107.21 & 106.234935417239 & 0.975064582761179 \tabularnewline
13 & 107.88 & 106.441734677982 & 1.43826532201768 \tabularnewline
14 & 108.84 & 106.986512262885 & 1.85348773711541 \tabularnewline
15 & 108.96 & 107.659376641786 & 1.30062335821395 \tabularnewline
16 & 109.52 & 107.543854509954 & 1.97614549004572 \tabularnewline
17 & 108.45 & 107.549098250612 & 0.900901749387815 \tabularnewline
18 & 108.67 & 107.826222878512 & 0.84377712148755 \tabularnewline
19 & 108.96 & 107.961221372912 & 0.998778627087663 \tabularnewline
20 & 108.76 & 107.316719858448 & 1.44328014155237 \tabularnewline
21 & 107.85 & 107.408218900667 & 0.441781099332684 \tabularnewline
22 & 108.78 & 107.159444792241 & 1.62055520775949 \tabularnewline
23 & 107.51 & 107.806765471982 & -0.296765471981723 \tabularnewline
24 & 108.83 & 109.801336875059 & -0.971336875058603 \tabularnewline
25 & 111.54 & 111.1902869165 & 0.349713083499884 \tabularnewline
26 & 111.74 & 112.702850641719 & -0.962850641719412 \tabularnewline
27 & 112.04 & 112.665017227994 & -0.625017227994101 \tabularnewline
28 & 111.74 & 112.820734944827 & -1.08073494482687 \tabularnewline
29 & 111.81 & 113.275312490619 & -1.46531249061867 \tabularnewline
30 & 111.86 & 114.833313507875 & -2.97331350787485 \tabularnewline
31 & 114.23 & 114.025711354268 & 0.204288645732377 \tabularnewline
32 & 114.8 & 114.764898879177 & 0.0351011208230774 \tabularnewline
33 & 115.17 & 115.519962924738 & -0.349962924738275 \tabularnewline
34 & 115.11 & 114.824400360194 & 0.285599639805998 \tabularnewline
35 & 114.43 & 115.563020191062 & -1.13302019106208 \tabularnewline
36 & 114.66 & 117.877676651917 & -3.2176766519169 \tabularnewline
37 & 115.11 & 119.186657482884 & -4.07665748288448 \tabularnewline
38 & 117.74 & 118.859140695992 & -1.11914069599185 \tabularnewline
39 & 118.18 & 118.111914250772 & 0.0680857492283319 \tabularnewline
40 & 118.56 & 117.642406670066 & 0.917593329933734 \tabularnewline
41 & 117.63 & 116.614491293355 & 1.01550870664471 \tabularnewline
42 & 117.71 & 116.015715158755 & 1.69428484124513 \tabularnewline
43 & 117.46 & 116.480171688010 & 0.979828311990368 \tabularnewline
44 & 117.37 & 117.034506108374 & 0.335493891626348 \tabularnewline
45 & 117.34 & 118.144261998434 & -0.804261998434062 \tabularnewline
46 & 117.09 & 119.884879918997 & -2.79487991899719 \tabularnewline
47 & 116.65 & 118.992889047596 & -2.34288904759620 \tabularnewline
48 & 116.71 & 120.638089626479 & -3.92808962647932 \tabularnewline
49 & 116.82 & 120.969825236346 & -4.14982523634641 \tabularnewline
50 & 117.33 & 120.701082905547 & -3.37108290554658 \tabularnewline
51 & 117.95 & 120.636278658953 & -2.68627865895307 \tabularnewline
52 & 123.53 & 120.832764778830 & 2.69723522116974 \tabularnewline
53 & 124.91 & 121.623543425143 & 3.28645657485687 \tabularnewline
54 & 125.99 & 121.488000485644 & 4.50199951435591 \tabularnewline
55 & 126.29 & 120.764085250825 & 5.52591474917489 \tabularnewline
56 & 125.68 & 119.575474645372 & 6.10452535462825 \tabularnewline
57 & 125.52 & 119.190390032891 & 6.32960996710867 \tabularnewline
\hline
\end{tabular}
%Source: https://freestatistics.org/blog/index.php?pk=113272&T=4

[TABLE]
[ROW][C]Multiple Linear Regression - Actuals, Interpolation, and Residuals[/C][/ROW]
[ROW][C]Time or Index[/C][C]Actuals[/C][C]InterpolationForecast[/C][C]ResidualsPrediction Error[/C][/ROW]
[ROW][C]1[/C][C]105.31[/C][C]107.812915518479[/C][C]-2.50291551847936[/C][/ROW]
[ROW][C]2[/C][C]105.63[/C][C]107.988984020252[/C][C]-2.35898402025168[/C][/ROW]
[ROW][C]3[/C][C]106.02[/C][C]108.057520649761[/C][C]-2.03752064976142[/C][/ROW]
[ROW][C]4[/C][C]105.85[/C][C]107.736695550525[/C][C]-1.88669555052529[/C][/ROW]
[ROW][C]5[/C][C]106.57[/C][C]106.498063990704[/C][C]0.0719360092962835[/C][/ROW]
[ROW][C]6[/C][C]106.48[/C][C]107.087974880007[/C][C]-0.607974880007427[/C][/ROW]
[ROW][C]7[/C][C]106.6[/C][C]107.534817006108[/C][C]-0.93481700610823[/C][/ROW]
[ROW][C]8[/C][C]106.75[/C][C]106.684612411200[/C][C]0.0653875887996543[/C][/ROW]
[ROW][C]9[/C][C]106.69[/C][C]106.706671999870[/C][C]-0.0166719998704360[/C][/ROW]
[ROW][C]10[/C][C]106.69[/C][C]106.738010161344[/C][C]-0.0480101613436659[/C][/ROW]
[ROW][C]11[/C][C]106.93[/C][C]106.448536451314[/C][C]0.481463548686425[/C][/ROW]
[ROW][C]12[/C][C]107.21[/C][C]106.234935417239[/C][C]0.975064582761179[/C][/ROW]
[ROW][C]13[/C][C]107.88[/C][C]106.441734677982[/C][C]1.43826532201768[/C][/ROW]
[ROW][C]14[/C][C]108.84[/C][C]106.986512262885[/C][C]1.85348773711541[/C][/ROW]
[ROW][C]15[/C][C]108.96[/C][C]107.659376641786[/C][C]1.30062335821395[/C][/ROW]
[ROW][C]16[/C][C]109.52[/C][C]107.543854509954[/C][C]1.97614549004572[/C][/ROW]
[ROW][C]17[/C][C]108.45[/C][C]107.549098250612[/C][C]0.900901749387815[/C][/ROW]
[ROW][C]18[/C][C]108.67[/C][C]107.826222878512[/C][C]0.84377712148755[/C][/ROW]
[ROW][C]19[/C][C]108.96[/C][C]107.961221372912[/C][C]0.998778627087663[/C][/ROW]
[ROW][C]20[/C][C]108.76[/C][C]107.316719858448[/C][C]1.44328014155237[/C][/ROW]
[ROW][C]21[/C][C]107.85[/C][C]107.408218900667[/C][C]0.441781099332684[/C][/ROW]
[ROW][C]22[/C][C]108.78[/C][C]107.159444792241[/C][C]1.62055520775949[/C][/ROW]
[ROW][C]23[/C][C]107.51[/C][C]107.806765471982[/C][C]-0.296765471981723[/C][/ROW]
[ROW][C]24[/C][C]108.83[/C][C]109.801336875059[/C][C]-0.971336875058603[/C][/ROW]
[ROW][C]25[/C][C]111.54[/C][C]111.1902869165[/C][C]0.349713083499884[/C][/ROW]
[ROW][C]26[/C][C]111.74[/C][C]112.702850641719[/C][C]-0.962850641719412[/C][/ROW]
[ROW][C]27[/C][C]112.04[/C][C]112.665017227994[/C][C]-0.625017227994101[/C][/ROW]
[ROW][C]28[/C][C]111.74[/C][C]112.820734944827[/C][C]-1.08073494482687[/C][/ROW]
[ROW][C]29[/C][C]111.81[/C][C]113.275312490619[/C][C]-1.46531249061867[/C][/ROW]
[ROW][C]30[/C][C]111.86[/C][C]114.833313507875[/C][C]-2.97331350787485[/C][/ROW]
[ROW][C]31[/C][C]114.23[/C][C]114.025711354268[/C][C]0.204288645732377[/C][/ROW]
[ROW][C]32[/C][C]114.8[/C][C]114.764898879177[/C][C]0.0351011208230774[/C][/ROW]
[ROW][C]33[/C][C]115.17[/C][C]115.519962924738[/C][C]-0.349962924738275[/C][/ROW]
[ROW][C]34[/C][C]115.11[/C][C]114.824400360194[/C][C]0.285599639805998[/C][/ROW]
[ROW][C]35[/C][C]114.43[/C][C]115.563020191062[/C][C]-1.13302019106208[/C][/ROW]
[ROW][C]36[/C][C]114.66[/C][C]117.877676651917[/C][C]-3.2176766519169[/C][/ROW]
[ROW][C]37[/C][C]115.11[/C][C]119.186657482884[/C][C]-4.07665748288448[/C][/ROW]
[ROW][C]38[/C][C]117.74[/C][C]118.859140695992[/C][C]-1.11914069599185[/C][/ROW]
[ROW][C]39[/C][C]118.18[/C][C]118.111914250772[/C][C]0.0680857492283319[/C][/ROW]
[ROW][C]40[/C][C]118.56[/C][C]117.642406670066[/C][C]0.917593329933734[/C][/ROW]
[ROW][C]41[/C][C]117.63[/C][C]116.614491293355[/C][C]1.01550870664471[/C][/ROW]
[ROW][C]42[/C][C]117.71[/C][C]116.015715158755[/C][C]1.69428484124513[/C][/ROW]
[ROW][C]43[/C][C]117.46[/C][C]116.480171688010[/C][C]0.979828311990368[/C][/ROW]
[ROW][C]44[/C][C]117.37[/C][C]117.034506108374[/C][C]0.335493891626348[/C][/ROW]
[ROW][C]45[/C][C]117.34[/C][C]118.144261998434[/C][C]-0.804261998434062[/C][/ROW]
[ROW][C]46[/C][C]117.09[/C][C]119.884879918997[/C][C]-2.79487991899719[/C][/ROW]
[ROW][C]47[/C][C]116.65[/C][C]118.992889047596[/C][C]-2.34288904759620[/C][/ROW]
[ROW][C]48[/C][C]116.71[/C][C]120.638089626479[/C][C]-3.92808962647932[/C][/ROW]
[ROW][C]49[/C][C]116.82[/C][C]120.969825236346[/C][C]-4.14982523634641[/C][/ROW]
[ROW][C]50[/C][C]117.33[/C][C]120.701082905547[/C][C]-3.37108290554658[/C][/ROW]
[ROW][C]51[/C][C]117.95[/C][C]120.636278658953[/C][C]-2.68627865895307[/C][/ROW]
[ROW][C]52[/C][C]123.53[/C][C]120.832764778830[/C][C]2.69723522116974[/C][/ROW]
[ROW][C]53[/C][C]124.91[/C][C]121.623543425143[/C][C]3.28645657485687[/C][/ROW]
[ROW][C]54[/C][C]125.99[/C][C]121.488000485644[/C][C]4.50199951435591[/C][/ROW]
[ROW][C]55[/C][C]126.29[/C][C]120.764085250825[/C][C]5.52591474917489[/C][/ROW]
[ROW][C]56[/C][C]125.68[/C][C]119.575474645372[/C][C]6.10452535462825[/C][/ROW]
[ROW][C]57[/C][C]125.52[/C][C]119.190390032891[/C][C]6.32960996710867[/C][/ROW]
[/TABLE]
Source: https://freestatistics.org/blog/index.php?pk=113272&T=4

Globally Unique Identifier (entire table): ba.freestatistics.org/blog/index.php?pk=113272&T=4

As an alternative you can also use a QR Code:  

The GUIDs for individual cells are displayed in the table below:

Multiple Linear Regression - Actuals, Interpolation, and Residuals
Time or IndexActualsInterpolationForecastResidualsPrediction Error
1105.31107.812915518479-2.50291551847936
2105.63107.988984020252-2.35898402025168
3106.02108.057520649761-2.03752064976142
4105.85107.736695550525-1.88669555052529
5106.57106.4980639907040.0719360092962835
6106.48107.087974880007-0.607974880007427
7106.6107.534817006108-0.93481700610823
8106.75106.6846124112000.0653875887996543
9106.69106.706671999870-0.0166719998704360
10106.69106.738010161344-0.0480101613436659
11106.93106.4485364513140.481463548686425
12107.21106.2349354172390.975064582761179
13107.88106.4417346779821.43826532201768
14108.84106.9865122628851.85348773711541
15108.96107.6593766417861.30062335821395
16109.52107.5438545099541.97614549004572
17108.45107.5490982506120.900901749387815
18108.67107.8262228785120.84377712148755
19108.96107.9612213729120.998778627087663
20108.76107.3167198584481.44328014155237
21107.85107.4082189006670.441781099332684
22108.78107.1594447922411.62055520775949
23107.51107.806765471982-0.296765471981723
24108.83109.801336875059-0.971336875058603
25111.54111.19028691650.349713083499884
26111.74112.702850641719-0.962850641719412
27112.04112.665017227994-0.625017227994101
28111.74112.820734944827-1.08073494482687
29111.81113.275312490619-1.46531249061867
30111.86114.833313507875-2.97331350787485
31114.23114.0257113542680.204288645732377
32114.8114.7648988791770.0351011208230774
33115.17115.519962924738-0.349962924738275
34115.11114.8244003601940.285599639805998
35114.43115.563020191062-1.13302019106208
36114.66117.877676651917-3.2176766519169
37115.11119.186657482884-4.07665748288448
38117.74118.859140695992-1.11914069599185
39118.18118.1119142507720.0680857492283319
40118.56117.6424066700660.917593329933734
41117.63116.6144912933551.01550870664471
42117.71116.0157151587551.69428484124513
43117.46116.4801716880100.979828311990368
44117.37117.0345061083740.335493891626348
45117.34118.144261998434-0.804261998434062
46117.09119.884879918997-2.79487991899719
47116.65118.992889047596-2.34288904759620
48116.71120.638089626479-3.92808962647932
49116.82120.969825236346-4.14982523634641
50117.33120.701082905547-3.37108290554658
51117.95120.636278658953-2.68627865895307
52123.53120.8327647788302.69723522116974
53124.91121.6235434251433.28645657485687
54125.99121.4880004856444.50199951435591
55126.29120.7640852508255.52591474917489
56125.68119.5754746453726.10452535462825
57125.52119.1903900328916.32960996710867


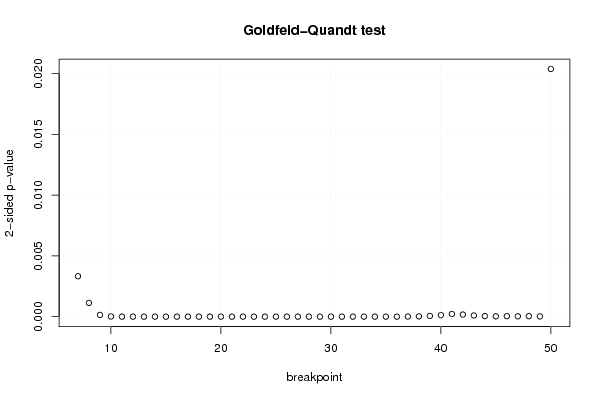
Goldfeld-Quandt test for Heteroskedasticity
p-valuesAlternative Hypothesis
breakpoint indexgreater2-sidedless
70.001662415379140450.003324830758280890.99833758462086
80.0005649959278089710.001129991855617940.99943500407219
97.1135137782968e-050.0001422702755659360.999928864862217
107.35714506815169e-061.47142901363034e-050.999992642854932
116.97563621693086e-071.39512724338617e-060.999999302436378
126.86078948639749e-081.37215789727950e-070.999999931392105
133.13939630109891e-086.27879260219782e-080.999999968606037
144.55372555287114e-089.10745110574227e-080.999999954462744
155.36821179239029e-091.07364235847806e-080.999999994631788
166.33243574274573e-101.26648714854915e-090.999999999366756
171.76259491296416e-093.52518982592833e-090.999999998237405
188.90041852530964e-101.78008370506193e-090.999999999109958
199.43750827635279e-101.88750165527056e-090.99999999905625
201.50693980052910e-103.01387960105821e-100.999999999849306
211.72391456069711e-103.44782912139422e-100.999999999827609
223.38880524818412e-116.77761049636824e-110.999999999966112
232.67308595052285e-115.34617190104571e-110.99999999997327
241.43559717483360e-112.87119434966720e-110.999999999985644
251.71641823075746e-093.43283646151491e-090.999999998283582
263.80291424345624e-107.60582848691247e-100.999999999619709
278.49697167464967e-111.69939433492993e-100.99999999991503
281.88609949904134e-113.77219899808268e-110.999999999981139
294.35474736322384e-128.70949472644768e-120.999999999995645
307.80430854151456e-121.56086170830291e-110.999999999992196
318.26561014076434e-121.65312202815287e-110.999999999991734
321.06322631866251e-102.12645263732502e-100.999999999893677
331.15430202102741e-092.30860404205482e-090.999999998845698
341.82109689903559e-083.64219379807119e-080.999999981789031
352.03606150027954e-084.07212300055907e-080.999999979639385
369.11034397865411e-081.82206879573082e-070.99999990889656
374.8729114376511e-069.7458228753022e-060.999995127088562
381.13156852060907e-052.26313704121815e-050.999988684314794
392.92486560716031e-055.84973121432062e-050.999970751343928
405.92465862641786e-050.0001184931725283570.999940753413736
410.0001110873115842170.0002221746231684350.999888912688416
428.70156477070206e-050.0001740312954140410.999912984352293
434.82396208772871e-059.64792417545743e-050.999951760379123
442.18232340800261e-054.36464681600522e-050.99997817676592
451.17237066870381e-052.34474133740761e-050.999988276293313
461.76564099198493e-053.53128198396986e-050.99998234359008
471.36888120321300e-052.73776240642600e-050.999986311187968
481.81965296429609e-053.63930592859217e-050.999981803470357
491.09645851939741e-052.19291703879482e-050.999989035414806
500.01019407947701540.02038815895403080.989805920522985

\begin{tabular}{lllllllll}
\hline
Goldfeld-Quandt test for Heteroskedasticity \tabularnewline
p-values & Alternative Hypothesis \tabularnewline
breakpoint index & greater & 2-sided & less \tabularnewline
7 & 0.00166241537914045 & 0.00332483075828089 & 0.99833758462086 \tabularnewline
8 & 0.000564995927808971 & 0.00112999185561794 & 0.99943500407219 \tabularnewline
9 & 7.1135137782968e-05 & 0.000142270275565936 & 0.999928864862217 \tabularnewline
10 & 7.35714506815169e-06 & 1.47142901363034e-05 & 0.999992642854932 \tabularnewline
11 & 6.97563621693086e-07 & 1.39512724338617e-06 & 0.999999302436378 \tabularnewline
12 & 6.86078948639749e-08 & 1.37215789727950e-07 & 0.999999931392105 \tabularnewline
13 & 3.13939630109891e-08 & 6.27879260219782e-08 & 0.999999968606037 \tabularnewline
14 & 4.55372555287114e-08 & 9.10745110574227e-08 & 0.999999954462744 \tabularnewline
15 & 5.36821179239029e-09 & 1.07364235847806e-08 & 0.999999994631788 \tabularnewline
16 & 6.33243574274573e-10 & 1.26648714854915e-09 & 0.999999999366756 \tabularnewline
17 & 1.76259491296416e-09 & 3.52518982592833e-09 & 0.999999998237405 \tabularnewline
18 & 8.90041852530964e-10 & 1.78008370506193e-09 & 0.999999999109958 \tabularnewline
19 & 9.43750827635279e-10 & 1.88750165527056e-09 & 0.99999999905625 \tabularnewline
20 & 1.50693980052910e-10 & 3.01387960105821e-10 & 0.999999999849306 \tabularnewline
21 & 1.72391456069711e-10 & 3.44782912139422e-10 & 0.999999999827609 \tabularnewline
22 & 3.38880524818412e-11 & 6.77761049636824e-11 & 0.999999999966112 \tabularnewline
23 & 2.67308595052285e-11 & 5.34617190104571e-11 & 0.99999999997327 \tabularnewline
24 & 1.43559717483360e-11 & 2.87119434966720e-11 & 0.999999999985644 \tabularnewline
25 & 1.71641823075746e-09 & 3.43283646151491e-09 & 0.999999998283582 \tabularnewline
26 & 3.80291424345624e-10 & 7.60582848691247e-10 & 0.999999999619709 \tabularnewline
27 & 8.49697167464967e-11 & 1.69939433492993e-10 & 0.99999999991503 \tabularnewline
28 & 1.88609949904134e-11 & 3.77219899808268e-11 & 0.999999999981139 \tabularnewline
29 & 4.35474736322384e-12 & 8.70949472644768e-12 & 0.999999999995645 \tabularnewline
30 & 7.80430854151456e-12 & 1.56086170830291e-11 & 0.999999999992196 \tabularnewline
31 & 8.26561014076434e-12 & 1.65312202815287e-11 & 0.999999999991734 \tabularnewline
32 & 1.06322631866251e-10 & 2.12645263732502e-10 & 0.999999999893677 \tabularnewline
33 & 1.15430202102741e-09 & 2.30860404205482e-09 & 0.999999998845698 \tabularnewline
34 & 1.82109689903559e-08 & 3.64219379807119e-08 & 0.999999981789031 \tabularnewline
35 & 2.03606150027954e-08 & 4.07212300055907e-08 & 0.999999979639385 \tabularnewline
36 & 9.11034397865411e-08 & 1.82206879573082e-07 & 0.99999990889656 \tabularnewline
37 & 4.8729114376511e-06 & 9.7458228753022e-06 & 0.999995127088562 \tabularnewline
38 & 1.13156852060907e-05 & 2.26313704121815e-05 & 0.999988684314794 \tabularnewline
39 & 2.92486560716031e-05 & 5.84973121432062e-05 & 0.999970751343928 \tabularnewline
40 & 5.92465862641786e-05 & 0.000118493172528357 & 0.999940753413736 \tabularnewline
41 & 0.000111087311584217 & 0.000222174623168435 & 0.999888912688416 \tabularnewline
42 & 8.70156477070206e-05 & 0.000174031295414041 & 0.999912984352293 \tabularnewline
43 & 4.82396208772871e-05 & 9.64792417545743e-05 & 0.999951760379123 \tabularnewline
44 & 2.18232340800261e-05 & 4.36464681600522e-05 & 0.99997817676592 \tabularnewline
45 & 1.17237066870381e-05 & 2.34474133740761e-05 & 0.999988276293313 \tabularnewline
46 & 1.76564099198493e-05 & 3.53128198396986e-05 & 0.99998234359008 \tabularnewline
47 & 1.36888120321300e-05 & 2.73776240642600e-05 & 0.999986311187968 \tabularnewline
48 & 1.81965296429609e-05 & 3.63930592859217e-05 & 0.999981803470357 \tabularnewline
49 & 1.09645851939741e-05 & 2.19291703879482e-05 & 0.999989035414806 \tabularnewline
50 & 0.0101940794770154 & 0.0203881589540308 & 0.989805920522985 \tabularnewline
\hline
\end{tabular}
%Source: https://freestatistics.org/blog/index.php?pk=113272&T=5

[TABLE]
[ROW][C]Goldfeld-Quandt test for Heteroskedasticity[/C][/ROW]
[ROW][C]p-values[/C][C]Alternative Hypothesis[/C][/ROW]
[ROW][C]breakpoint index[/C][C]greater[/C][C]2-sided[/C][C]less[/C][/ROW]
[ROW][C]7[/C][C]0.00166241537914045[/C][C]0.00332483075828089[/C][C]0.99833758462086[/C][/ROW]
[ROW][C]8[/C][C]0.000564995927808971[/C][C]0.00112999185561794[/C][C]0.99943500407219[/C][/ROW]
[ROW][C]9[/C][C]7.1135137782968e-05[/C][C]0.000142270275565936[/C][C]0.999928864862217[/C][/ROW]
[ROW][C]10[/C][C]7.35714506815169e-06[/C][C]1.47142901363034e-05[/C][C]0.999992642854932[/C][/ROW]
[ROW][C]11[/C][C]6.97563621693086e-07[/C][C]1.39512724338617e-06[/C][C]0.999999302436378[/C][/ROW]
[ROW][C]12[/C][C]6.86078948639749e-08[/C][C]1.37215789727950e-07[/C][C]0.999999931392105[/C][/ROW]
[ROW][C]13[/C][C]3.13939630109891e-08[/C][C]6.27879260219782e-08[/C][C]0.999999968606037[/C][/ROW]
[ROW][C]14[/C][C]4.55372555287114e-08[/C][C]9.10745110574227e-08[/C][C]0.999999954462744[/C][/ROW]
[ROW][C]15[/C][C]5.36821179239029e-09[/C][C]1.07364235847806e-08[/C][C]0.999999994631788[/C][/ROW]
[ROW][C]16[/C][C]6.33243574274573e-10[/C][C]1.26648714854915e-09[/C][C]0.999999999366756[/C][/ROW]
[ROW][C]17[/C][C]1.76259491296416e-09[/C][C]3.52518982592833e-09[/C][C]0.999999998237405[/C][/ROW]
[ROW][C]18[/C][C]8.90041852530964e-10[/C][C]1.78008370506193e-09[/C][C]0.999999999109958[/C][/ROW]
[ROW][C]19[/C][C]9.43750827635279e-10[/C][C]1.88750165527056e-09[/C][C]0.99999999905625[/C][/ROW]
[ROW][C]20[/C][C]1.50693980052910e-10[/C][C]3.01387960105821e-10[/C][C]0.999999999849306[/C][/ROW]
[ROW][C]21[/C][C]1.72391456069711e-10[/C][C]3.44782912139422e-10[/C][C]0.999999999827609[/C][/ROW]
[ROW][C]22[/C][C]3.38880524818412e-11[/C][C]6.77761049636824e-11[/C][C]0.999999999966112[/C][/ROW]
[ROW][C]23[/C][C]2.67308595052285e-11[/C][C]5.34617190104571e-11[/C][C]0.99999999997327[/C][/ROW]
[ROW][C]24[/C][C]1.43559717483360e-11[/C][C]2.87119434966720e-11[/C][C]0.999999999985644[/C][/ROW]
[ROW][C]25[/C][C]1.71641823075746e-09[/C][C]3.43283646151491e-09[/C][C]0.999999998283582[/C][/ROW]
[ROW][C]26[/C][C]3.80291424345624e-10[/C][C]7.60582848691247e-10[/C][C]0.999999999619709[/C][/ROW]
[ROW][C]27[/C][C]8.49697167464967e-11[/C][C]1.69939433492993e-10[/C][C]0.99999999991503[/C][/ROW]
[ROW][C]28[/C][C]1.88609949904134e-11[/C][C]3.77219899808268e-11[/C][C]0.999999999981139[/C][/ROW]
[ROW][C]29[/C][C]4.35474736322384e-12[/C][C]8.70949472644768e-12[/C][C]0.999999999995645[/C][/ROW]
[ROW][C]30[/C][C]7.80430854151456e-12[/C][C]1.56086170830291e-11[/C][C]0.999999999992196[/C][/ROW]
[ROW][C]31[/C][C]8.26561014076434e-12[/C][C]1.65312202815287e-11[/C][C]0.999999999991734[/C][/ROW]
[ROW][C]32[/C][C]1.06322631866251e-10[/C][C]2.12645263732502e-10[/C][C]0.999999999893677[/C][/ROW]
[ROW][C]33[/C][C]1.15430202102741e-09[/C][C]2.30860404205482e-09[/C][C]0.999999998845698[/C][/ROW]
[ROW][C]34[/C][C]1.82109689903559e-08[/C][C]3.64219379807119e-08[/C][C]0.999999981789031[/C][/ROW]
[ROW][C]35[/C][C]2.03606150027954e-08[/C][C]4.07212300055907e-08[/C][C]0.999999979639385[/C][/ROW]
[ROW][C]36[/C][C]9.11034397865411e-08[/C][C]1.82206879573082e-07[/C][C]0.99999990889656[/C][/ROW]
[ROW][C]37[/C][C]4.8729114376511e-06[/C][C]9.7458228753022e-06[/C][C]0.999995127088562[/C][/ROW]
[ROW][C]38[/C][C]1.13156852060907e-05[/C][C]2.26313704121815e-05[/C][C]0.999988684314794[/C][/ROW]
[ROW][C]39[/C][C]2.92486560716031e-05[/C][C]5.84973121432062e-05[/C][C]0.999970751343928[/C][/ROW]
[ROW][C]40[/C][C]5.92465862641786e-05[/C][C]0.000118493172528357[/C][C]0.999940753413736[/C][/ROW]
[ROW][C]41[/C][C]0.000111087311584217[/C][C]0.000222174623168435[/C][C]0.999888912688416[/C][/ROW]
[ROW][C]42[/C][C]8.70156477070206e-05[/C][C]0.000174031295414041[/C][C]0.999912984352293[/C][/ROW]
[ROW][C]43[/C][C]4.82396208772871e-05[/C][C]9.64792417545743e-05[/C][C]0.999951760379123[/C][/ROW]
[ROW][C]44[/C][C]2.18232340800261e-05[/C][C]4.36464681600522e-05[/C][C]0.99997817676592[/C][/ROW]
[ROW][C]45[/C][C]1.17237066870381e-05[/C][C]2.34474133740761e-05[/C][C]0.999988276293313[/C][/ROW]
[ROW][C]46[/C][C]1.76564099198493e-05[/C][C]3.53128198396986e-05[/C][C]0.99998234359008[/C][/ROW]
[ROW][C]47[/C][C]1.36888120321300e-05[/C][C]2.73776240642600e-05[/C][C]0.999986311187968[/C][/ROW]
[ROW][C]48[/C][C]1.81965296429609e-05[/C][C]3.63930592859217e-05[/C][C]0.999981803470357[/C][/ROW]
[ROW][C]49[/C][C]1.09645851939741e-05[/C][C]2.19291703879482e-05[/C][C]0.999989035414806[/C][/ROW]
[ROW][C]50[/C][C]0.0101940794770154[/C][C]0.0203881589540308[/C][C]0.989805920522985[/C][/ROW]
[/TABLE]
Source: https://freestatistics.org/blog/index.php?pk=113272&T=5

Globally Unique Identifier (entire table): ba.freestatistics.org/blog/index.php?pk=113272&T=5

As an alternative you can also use a QR Code:  

The GUIDs for individual cells are displayed in the table below:

Goldfeld-Quandt test for Heteroskedasticity
p-valuesAlternative Hypothesis
breakpoint indexgreater2-sidedless
70.001662415379140450.003324830758280890.99833758462086
80.0005649959278089710.001129991855617940.99943500407219
97.1135137782968e-050.0001422702755659360.999928864862217
107.35714506815169e-061.47142901363034e-050.999992642854932
116.97563621693086e-071.39512724338617e-060.999999302436378
126.86078948639749e-081.37215789727950e-070.999999931392105
133.13939630109891e-086.27879260219782e-080.999999968606037
144.55372555287114e-089.10745110574227e-080.999999954462744
155.36821179239029e-091.07364235847806e-080.999999994631788
166.33243574274573e-101.26648714854915e-090.999999999366756
171.76259491296416e-093.52518982592833e-090.999999998237405
188.90041852530964e-101.78008370506193e-090.999999999109958
199.43750827635279e-101.88750165527056e-090.99999999905625
201.50693980052910e-103.01387960105821e-100.999999999849306
211.72391456069711e-103.44782912139422e-100.999999999827609
223.38880524818412e-116.77761049636824e-110.999999999966112
232.67308595052285e-115.34617190104571e-110.99999999997327
241.43559717483360e-112.87119434966720e-110.999999999985644
251.71641823075746e-093.43283646151491e-090.999999998283582
263.80291424345624e-107.60582848691247e-100.999999999619709
278.49697167464967e-111.69939433492993e-100.99999999991503
281.88609949904134e-113.77219899808268e-110.999999999981139
294.35474736322384e-128.70949472644768e-120.999999999995645
307.80430854151456e-121.56086170830291e-110.999999999992196
318.26561014076434e-121.65312202815287e-110.999999999991734
321.06322631866251e-102.12645263732502e-100.999999999893677
331.15430202102741e-092.30860404205482e-090.999999998845698
341.82109689903559e-083.64219379807119e-080.999999981789031
352.03606150027954e-084.07212300055907e-080.999999979639385
369.11034397865411e-081.82206879573082e-070.99999990889656
374.8729114376511e-069.7458228753022e-060.999995127088562
381.13156852060907e-052.26313704121815e-050.999988684314794
392.92486560716031e-055.84973121432062e-050.999970751343928
405.92465862641786e-050.0001184931725283570.999940753413736
410.0001110873115842170.0002221746231684350.999888912688416
428.70156477070206e-050.0001740312954140410.999912984352293
434.82396208772871e-059.64792417545743e-050.999951760379123
442.18232340800261e-054.36464681600522e-050.99997817676592
451.17237066870381e-052.34474133740761e-050.999988276293313
461.76564099198493e-053.53128198396986e-050.99998234359008
471.36888120321300e-052.73776240642600e-050.999986311187968
481.81965296429609e-053.63930592859217e-050.999981803470357
491.09645851939741e-052.19291703879482e-050.999989035414806
500.01019407947701540.02038815895403080.989805920522985


Meta Analysis of Goldfeld-Quandt test for Heteroskedasticity
Description# significant tests% significant testsOK/NOK
1% type I error level430.977272727272727NOK
5% type I error level441NOK
10% type I error level441NOK

\begin{tabular}{lllllllll}
\hline
Meta Analysis of Goldfeld-Quandt test for Heteroskedasticity \tabularnewline
Description & # significant tests & % significant tests & OK/NOK \tabularnewline
1% type I error level & 43 & 0.977272727272727 & NOK \tabularnewline
5% type I error level & 44 & 1 & NOK \tabularnewline
10% type I error level & 44 & 1 & NOK \tabularnewline
\hline
\end{tabular}
%Source: https://freestatistics.org/blog/index.php?pk=113272&T=6

[TABLE]
[ROW][C]Meta Analysis of Goldfeld-Quandt test for Heteroskedasticity[/C][/ROW]
[ROW][C]Description[/C][C]# significant tests[/C][C]% significant tests[/C][C]OK/NOK[/C][/ROW]
[ROW][C]1% type I error level[/C][C]43[/C][C]0.977272727272727[/C][C]NOK[/C][/ROW]
[ROW][C]5% type I error level[/C][C]44[/C][C]1[/C][C]NOK[/C][/ROW]
[ROW][C]10% type I error level[/C][C]44[/C][C]1[/C][C]NOK[/C][/ROW]
[/TABLE]
Source: https://freestatistics.org/blog/index.php?pk=113272&T=6

Globally Unique Identifier (entire table): ba.freestatistics.org/blog/index.php?pk=113272&T=6

As an alternative you can also use a QR Code:  

The GUIDs for individual cells are displayed in the table below:

Meta Analysis of Goldfeld-Quandt test for Heteroskedasticity
Description# significant tests% significant testsOK/NOK
1% type I error level430.977272727272727NOK
5% type I error level441NOK
10% type I error level441NOK


Parameters (Session):
par1 = 1 ; par2 = Do not include Seasonal Dummies ; par3 = No Linear Trend ;
Parameters (R input):
par1 = 1 ; par2 = Do not include Seasonal Dummies ; par3 = No Linear Trend ;
R code (references can be found in the software module):
library(lattice)
library(lmtest)
n25 <- 25 #minimum number of obs. for Goldfeld-Quandt test
par1 <- as.numeric(par1)
x <- t(y)
k <- length(x[1,])
n <- length(x[,1])
x1 <- cbind(x[,par1], x[,1:k!=par1])
mycolnames <- c(colnames(x)[par1], colnames(x)[1:k!=par1])
colnames(x1) <- mycolnames #colnames(x)[par1]
x <- x1
if (par3 == 'First Differences'){
x2 <- array(0, dim=c(n-1,k), dimnames=list(1:(n-1), paste('(1-B)',colnames(x),sep='')))
for (i in 1:n-1) {
for (j in 1:k) {
x2[i,j] <- x[i+1,j] - x[i,j]
}
}
x <- x2
}
if (par2 == 'Include Monthly Dummies'){
x2 <- array(0, dim=c(n,11), dimnames=list(1:n, paste('M', seq(1:11), sep ='')))
for (i in 1:11){
x2[seq(i,n,12),i] <- 1
}
x <- cbind(x, x2)
}
if (par2 == 'Include Quarterly Dummies'){
x2 <- array(0, dim=c(n,3), dimnames=list(1:n, paste('Q', seq(1:3), sep ='')))
for (i in 1:3){
x2[seq(i,n,4),i] <- 1
}
x <- cbind(x, x2)
}
k <- length(x[1,])
if (par3 == 'Linear Trend'){
x <- cbind(x, c(1:n))
colnames(x)[k+1] <- 't'
}
x
k <- length(x[1,])
df <- as.data.frame(x)
(mylm <- lm(df))
(mysum <- summary(mylm))
if (n > n25) {
kp3 <- k + 3
nmkm3 <- n - k - 3
gqarr <- array(NA, dim=c(nmkm3-kp3+1,3))
numgqtests <- 0
numsignificant1 <- 0
numsignificant5 <- 0
numsignificant10 <- 0
for (mypoint in kp3:nmkm3) {
j <- 0
numgqtests <- numgqtests + 1
for (myalt in c('greater', 'two.sided', 'less')) {
j <- j + 1
gqarr[mypoint-kp3+1,j] <- gqtest(mylm, point=mypoint, alternative=myalt)$p.value
}
if (gqarr[mypoint-kp3+1,2] < 0.01) numsignificant1 <- numsignificant1 + 1
if (gqarr[mypoint-kp3+1,2] < 0.05) numsignificant5 <- numsignificant5 + 1
if (gqarr[mypoint-kp3+1,2] < 0.10) numsignificant10 <- numsignificant10 + 1
}
gqarr
}
bitmap(file='test0.png')
plot(x[,1], type='l', main='Actuals and Interpolation', ylab='value of Actuals and Interpolation (dots)', xlab='time or index')
points(x[,1]-mysum$resid)
grid()
dev.off()
bitmap(file='test1.png')
plot(mysum$resid, type='b', pch=19, main='Residuals', ylab='value of Residuals', xlab='time or index')
grid()
dev.off()
bitmap(file='test2.png')
hist(mysum$resid, main='Residual Histogram', xlab='values of Residuals')
grid()
dev.off()
bitmap(file='test3.png')
densityplot(~mysum$resid,col='black',main='Residual Density Plot', xlab='values of Residuals')
dev.off()
bitmap(file='test4.png')
qqnorm(mysum$resid, main='Residual Normal Q-Q Plot')
qqline(mysum$resid)
grid()
dev.off()
(myerror <- as.ts(mysum$resid))
bitmap(file='test5.png')
dum <- cbind(lag(myerror,k=1),myerror)
dum
dum1 <- dum[2:length(myerror),]
dum1
z <- as.data.frame(dum1)
z
plot(z,main=paste('Residual Lag plot, lowess, and regression line'), ylab='values of Residuals', xlab='lagged values of Residuals')
lines(lowess(z))
abline(lm(z))
grid()
dev.off()
bitmap(file='test6.png')
acf(mysum$resid, lag.max=length(mysum$resid)/2, main='Residual Autocorrelation Function')
grid()
dev.off()
bitmap(file='test7.png')
pacf(mysum$resid, lag.max=length(mysum$resid)/2, main='Residual Partial Autocorrelation Function')
grid()
dev.off()
bitmap(file='test8.png')
opar <- par(mfrow = c(2,2), oma = c(0, 0, 1.1, 0))
plot(mylm, las = 1, sub='Residual Diagnostics')
par(opar)
dev.off()
if (n > n25) {
bitmap(file='test9.png')
plot(kp3:nmkm3,gqarr[,2], main='Goldfeld-Quandt test',ylab='2-sided p-value',xlab='breakpoint')
grid()
dev.off()
}
load(file='createtable')
a<-table.start()
a<-table.row.start(a)
a<-table.element(a, 'Multiple Linear Regression - Estimated Regression Equation', 1, TRUE)
a<-table.row.end(a)
myeq <- colnames(x)[1]
myeq <- paste(myeq, '[t] = ', sep='')
for (i in 1:k){
if (mysum$coefficients[i,1] > 0) myeq <- paste(myeq, '+', '')
myeq <- paste(myeq, mysum$coefficients[i,1], sep=' ')
if (rownames(mysum$coefficients)[i] != '(Intercept)') {
myeq <- paste(myeq, rownames(mysum$coefficients)[i], sep='')
if (rownames(mysum$coefficients)[i] != 't') myeq <- paste(myeq, '[t]', sep='')
}
}
myeq <- paste(myeq, ' + e[t]')
a<-table.row.start(a)
a<-table.element(a, myeq)
a<-table.row.end(a)
a<-table.end(a)
table.save(a,file='mytable1.tab')
a<-table.start()
a<-table.row.start(a)
a<-table.element(a,hyperlink('ols1.htm','Multiple Linear Regression - Ordinary Least Squares',''), 6, TRUE)
a<-table.row.end(a)
a<-table.row.start(a)
a<-table.element(a,'Variable',header=TRUE)
a<-table.element(a,'Parameter',header=TRUE)
a<-table.element(a,'S.D.',header=TRUE)
a<-table.element(a,'T-STAT
H0: parameter = 0',header=TRUE)
a<-table.element(a,'2-tail p-value',header=TRUE)
a<-table.element(a,'1-tail p-value',header=TRUE)
a<-table.row.end(a)
for (i in 1:k){
a<-table.row.start(a)
a<-table.element(a,rownames(mysum$coefficients)[i],header=TRUE)
a<-table.element(a,mysum$coefficients[i,1])
a<-table.element(a, round(mysum$coefficients[i,2],6))
a<-table.element(a, round(mysum$coefficients[i,3],4))
a<-table.element(a, round(mysum$coefficients[i,4],6))
a<-table.element(a, round(mysum$coefficients[i,4]/2,6))
a<-table.row.end(a)
}
a<-table.end(a)
table.save(a,file='mytable2.tab')
a<-table.start()
a<-table.row.start(a)
a<-table.element(a, 'Multiple Linear Regression - Regression Statistics', 2, TRUE)
a<-table.row.end(a)
a<-table.row.start(a)
a<-table.element(a, 'Multiple R',1,TRUE)
a<-table.element(a, sqrt(mysum$r.squared))
a<-table.row.end(a)
a<-table.row.start(a)
a<-table.element(a, 'R-squared',1,TRUE)
a<-table.element(a, mysum$r.squared)
a<-table.row.end(a)
a<-table.row.start(a)
a<-table.element(a, 'Adjusted R-squared',1,TRUE)
a<-table.element(a, mysum$adj.r.squared)
a<-table.row.end(a)
a<-table.row.start(a)
a<-table.element(a, 'F-TEST (value)',1,TRUE)
a<-table.element(a, mysum$fstatistic[1])
a<-table.row.end(a)
a<-table.row.start(a)
a<-table.element(a, 'F-TEST (DF numerator)',1,TRUE)
a<-table.element(a, mysum$fstatistic[2])
a<-table.row.end(a)
a<-table.row.start(a)
a<-table.element(a, 'F-TEST (DF denominator)',1,TRUE)
a<-table.element(a, mysum$fstatistic[3])
a<-table.row.end(a)
a<-table.row.start(a)
a<-table.element(a, 'p-value',1,TRUE)
a<-table.element(a, 1-pf(mysum$fstatistic[1],mysum$fstatistic[2],mysum$fstatistic[3]))
a<-table.row.end(a)
a<-table.row.start(a)
a<-table.element(a, 'Multiple Linear Regression - Residual Statistics', 2, TRUE)
a<-table.row.end(a)
a<-table.row.start(a)
a<-table.element(a, 'Residual Standard Deviation',1,TRUE)
a<-table.element(a, mysum$sigma)
a<-table.row.end(a)
a<-table.row.start(a)
a<-table.element(a, 'Sum Squared Residuals',1,TRUE)
a<-table.element(a, sum(myerror*myerror))
a<-table.row.end(a)
a<-table.end(a)
table.save(a,file='mytable3.tab')
a<-table.start()
a<-table.row.start(a)
a<-table.element(a, 'Multiple Linear Regression - Actuals, Interpolation, and Residuals', 4, TRUE)
a<-table.row.end(a)
a<-table.row.start(a)
a<-table.element(a, 'Time or Index', 1, TRUE)
a<-table.element(a, 'Actuals', 1, TRUE)
a<-table.element(a, 'Interpolation
Forecast', 1, TRUE)
a<-table.element(a, 'Residuals
Prediction Error', 1, TRUE)
a<-table.row.end(a)
for (i in 1:n) {
a<-table.row.start(a)
a<-table.element(a,i, 1, TRUE)
a<-table.element(a,x[i])
a<-table.element(a,x[i]-mysum$resid[i])
a<-table.element(a,mysum$resid[i])
a<-table.row.end(a)
}
a<-table.end(a)
table.save(a,file='mytable4.tab')
if (n > n25) {
a<-table.start()
a<-table.row.start(a)
a<-table.element(a,'Goldfeld-Quandt test for Heteroskedasticity',4,TRUE)
a<-table.row.end(a)
a<-table.row.start(a)
a<-table.element(a,'p-values',header=TRUE)
a<-table.element(a,'Alternative Hypothesis',3,header=TRUE)
a<-table.row.end(a)
a<-table.row.start(a)
a<-table.element(a,'breakpoint index',header=TRUE)
a<-table.element(a,'greater',header=TRUE)
a<-table.element(a,'2-sided',header=TRUE)
a<-table.element(a,'less',header=TRUE)
a<-table.row.end(a)
for (mypoint in kp3:nmkm3) {
a<-table.row.start(a)
a<-table.element(a,mypoint,header=TRUE)
a<-table.element(a,gqarr[mypoint-kp3+1,1])
a<-table.element(a,gqarr[mypoint-kp3+1,2])
a<-table.element(a,gqarr[mypoint-kp3+1,3])
a<-table.row.end(a)
}
a<-table.end(a)
table.save(a,file='mytable5.tab')
a<-table.start()
a<-table.row.start(a)
a<-table.element(a,'Meta Analysis of Goldfeld-Quandt test for Heteroskedasticity',4,TRUE)
a<-table.row.end(a)
a<-table.row.start(a)
a<-table.element(a,'Description',header=TRUE)
a<-table.element(a,'# significant tests',header=TRUE)
a<-table.element(a,'% significant tests',header=TRUE)
a<-table.element(a,'OK/NOK',header=TRUE)
a<-table.row.end(a)
a<-table.row.start(a)
a<-table.element(a,'1% type I error level',header=TRUE)
a<-table.element(a,numsignificant1)
a<-table.element(a,numsignificant1/numgqtests)
if (numsignificant1/numgqtests < 0.01) dum <- 'OK' else dum <- 'NOK'
a<-table.element(a,dum)
a<-table.row.end(a)
a<-table.row.start(a)
a<-table.element(a,'5% type I error level',header=TRUE)
a<-table.element(a,numsignificant5)
a<-table.element(a,numsignificant5/numgqtests)
if (numsignificant5/numgqtests < 0.05) dum <- 'OK' else dum <- 'NOK'
a<-table.element(a,dum)
a<-table.row.end(a)
a<-table.row.start(a)
a<-table.element(a,'10% type I error level',header=TRUE)
a<-table.element(a,numsignificant10)
a<-table.element(a,numsignificant10/numgqtests)
if (numsignificant10/numgqtests < 0.1) dum <- 'OK' else dum <- 'NOK'
a<-table.element(a,dum)
a<-table.row.end(a)
a<-table.end(a)
table.save(a,file='mytable6.tab')
}