Free Statistics

of Irreproducible Research!

Author's title

Author*The author of this computation has been verified*
R Software Modulerwasp_arimabackwardselection.wasp
Title produced by softwareARIMA Backward Selection
Date of computationTue, 14 Dec 2010 13:51:17 +0000
Cite this page as followsStatistical Computations at FreeStatistics.org, Office for Research Development and Education, URL https://freestatistics.org/blog/index.php?v=date/2010/Dec/14/t12923346077avfexrswdyhrju.htm/, Retrieved Mon, 29 Apr 2024 03:57:59 +0000
Statistical Computations at FreeStatistics.org, Office for Research Development and Education, URL https://freestatistics.org/blog/index.php?pk=109649, Retrieved Mon, 29 Apr 2024 03:57:59 +0000
QR Codes:

Original text written by user:
IsPrivate?No (this computation is public)
User-defined keywords
Estimated Impact165
Family? (F = Feedback message, R = changed R code, M = changed R Module, P = changed Parameters, D = changed Data)
-     [Univariate Explorative Data Analysis] [Monthly US soldie...] [2010-11-02 12:07:39] [b98453cac15ba1066b407e146608df68]
- RMP   [Spectral Analysis] [Soldiers] [2010-11-29 09:50:20] [b98453cac15ba1066b407e146608df68]
-    D    [Spectral Analysis] [ws 9] [2010-12-14 12:45:12] [20c5a34fea7ed3b9b27ff444f2eb4dfe]
-   P       [Spectral Analysis] [ws 9] [2010-12-14 13:12:01] [20c5a34fea7ed3b9b27ff444f2eb4dfe]
- RM          [Standard Deviation-Mean Plot] [] [2010-12-14 13:28:34] [20c5a34fea7ed3b9b27ff444f2eb4dfe]
- RM              [ARIMA Backward Selection] [] [2010-12-14 13:51:17] [76f6fcd790878de142f355e7238b5c71] [Current]
Feedback Forum

Post a new message
Dataseries X:
921365
987921
1132614
1332224
1418133
1411549
1695920
1636173
1539653
1395314
1127575
1036076
989236
1008380
1207763
1368839
1469798
1498721
1761769
1653214
1599104
1421179
1163995
1037735
1015407
1039210
1258049
1469445
1552346
1549144
1785895
1662335
1629440
1467430
1202209
1076982
1039367
1063449
1335135
1491602
1591972
1641248
1898849
1798580
1762444
1622044
1368955
1262973
1195650
1269530
1479279
1607819
1712466
1721766
1949843
1821326
1757802
1590367
1260647
1149235
1016367
1027885
1262159
1520854
1544144
1564709
1821776
1741365
1623386
1498658
1241822
1136029


Summary of computational transaction
Raw Inputview raw input (R code)
Raw Outputview raw output of R engine
Computing time22 seconds
R Server'Gwilym Jenkins' @ 72.249.127.135

\begin{tabular}{lllllllll}
\hline
Summary of computational transaction \tabularnewline
Raw Input & view raw input (R code)  \tabularnewline
Raw Output & view raw output of R engine  \tabularnewline
Computing time & 22 seconds \tabularnewline
R Server & 'Gwilym Jenkins' @ 72.249.127.135 \tabularnewline
\hline
\end{tabular}
%Source: https://freestatistics.org/blog/index.php?pk=109649&T=0

[TABLE]
[ROW][C]Summary of computational transaction[/C][/ROW]
[ROW][C]Raw Input[/C][C]view raw input (R code) [/C][/ROW]
[ROW][C]Raw Output[/C][C]view raw output of R engine [/C][/ROW]
[ROW][C]Computing time[/C][C]22 seconds[/C][/ROW]
[ROW][C]R Server[/C][C]'Gwilym Jenkins' @ 72.249.127.135[/C][/ROW]
[/TABLE]
Source: https://freestatistics.org/blog/index.php?pk=109649&T=0

Globally Unique Identifier (entire table): ba.freestatistics.org/blog/index.php?pk=109649&T=0

As an alternative you can also use a QR Code:  

The GUIDs for individual cells are displayed in the table below:

Summary of computational transaction
Raw Inputview raw input (R code)
Raw Outputview raw output of R engine
Computing time22 seconds
R Server'Gwilym Jenkins' @ 72.249.127.135


ARIMA Parameter Estimation and Backward Selection
Iterationar1ar2ar3ma1sar1sar2sma1
Estimates ( 1 )0.42770.11660.1414-0.6490.10770.1133-0.9986
(p-val)(0.1804 )(0.4665 )(0.3126 )(0.0329 )(0.6758 )(0.6392 )(0.1971 )
Estimates ( 2 )0.42640.12470.1398-0.655800.0579-1.2614
(p-val)(0.1795 )(0.4321 )(0.3209 )(0.0287 )(NA )(0.778 )(0.0342 )
Estimates ( 3 )0.41590.11660.1458-0.640900-0.7753
(p-val)(0.189 )(0.4531 )(0.2954 )(0.0309 )(NA )(NA )(0.0304 )
Estimates ( 4 )0.339200.1794-0.532700-0.7628
(p-val)(0.5194 )(NA )(0.2481 )(0.2553 )(NA )(NA )(0.0292 )
Estimates ( 5 )000.1039-0.226400-0.8019
(p-val)(NA )(NA )(0.4643 )(0.0719 )(NA )(NA )(0.0483 )
Estimates ( 6 )000-0.20500-0.868
(p-val)(NA )(NA )(NA )(0.0872 )(NA )(NA )(0.1434 )
Estimates ( 7 )000-0.118000
(p-val)(NA )(NA )(NA )(0.3456 )(NA )(NA )(NA )
Estimates ( 8 )0000000
(p-val)(NA )(NA )(NA )(NA )(NA )(NA )(NA )
Estimates ( 9 )NANANANANANANA
(p-val)(NA )(NA )(NA )(NA )(NA )(NA )(NA )
Estimates ( 10 )NANANANANANANA
(p-val)(NA )(NA )(NA )(NA )(NA )(NA )(NA )
Estimates ( 11 )NANANANANANANA
(p-val)(NA )(NA )(NA )(NA )(NA )(NA )(NA )
Estimates ( 12 )NANANANANANANA
(p-val)(NA )(NA )(NA )(NA )(NA )(NA )(NA )
Estimates ( 13 )NANANANANANANA
(p-val)(NA )(NA )(NA )(NA )(NA )(NA )(NA )

\begin{tabular}{lllllllll}
\hline
ARIMA Parameter Estimation and Backward Selection \tabularnewline
Iteration & ar1 & ar2 & ar3 & ma1 & sar1 & sar2 & sma1 \tabularnewline
Estimates ( 1 ) & 0.4277 & 0.1166 & 0.1414 & -0.649 & 0.1077 & 0.1133 & -0.9986 \tabularnewline
(p-val) & (0.1804 ) & (0.4665 ) & (0.3126 ) & (0.0329 ) & (0.6758 ) & (0.6392 ) & (0.1971 ) \tabularnewline
Estimates ( 2 ) & 0.4264 & 0.1247 & 0.1398 & -0.6558 & 0 & 0.0579 & -1.2614 \tabularnewline
(p-val) & (0.1795 ) & (0.4321 ) & (0.3209 ) & (0.0287 ) & (NA ) & (0.778 ) & (0.0342 ) \tabularnewline
Estimates ( 3 ) & 0.4159 & 0.1166 & 0.1458 & -0.6409 & 0 & 0 & -0.7753 \tabularnewline
(p-val) & (0.189 ) & (0.4531 ) & (0.2954 ) & (0.0309 ) & (NA ) & (NA ) & (0.0304 ) \tabularnewline
Estimates ( 4 ) & 0.3392 & 0 & 0.1794 & -0.5327 & 0 & 0 & -0.7628 \tabularnewline
(p-val) & (0.5194 ) & (NA ) & (0.2481 ) & (0.2553 ) & (NA ) & (NA ) & (0.0292 ) \tabularnewline
Estimates ( 5 ) & 0 & 0 & 0.1039 & -0.2264 & 0 & 0 & -0.8019 \tabularnewline
(p-val) & (NA ) & (NA ) & (0.4643 ) & (0.0719 ) & (NA ) & (NA ) & (0.0483 ) \tabularnewline
Estimates ( 6 ) & 0 & 0 & 0 & -0.205 & 0 & 0 & -0.868 \tabularnewline
(p-val) & (NA ) & (NA ) & (NA ) & (0.0872 ) & (NA ) & (NA ) & (0.1434 ) \tabularnewline
Estimates ( 7 ) & 0 & 0 & 0 & -0.118 & 0 & 0 & 0 \tabularnewline
(p-val) & (NA ) & (NA ) & (NA ) & (0.3456 ) & (NA ) & (NA ) & (NA ) \tabularnewline
Estimates ( 8 ) & 0 & 0 & 0 & 0 & 0 & 0 & 0 \tabularnewline
(p-val) & (NA ) & (NA ) & (NA ) & (NA ) & (NA ) & (NA ) & (NA ) \tabularnewline
Estimates ( 9 ) & NA & NA & NA & NA & NA & NA & NA \tabularnewline
(p-val) & (NA ) & (NA ) & (NA ) & (NA ) & (NA ) & (NA ) & (NA ) \tabularnewline
Estimates ( 10 ) & NA & NA & NA & NA & NA & NA & NA \tabularnewline
(p-val) & (NA ) & (NA ) & (NA ) & (NA ) & (NA ) & (NA ) & (NA ) \tabularnewline
Estimates ( 11 ) & NA & NA & NA & NA & NA & NA & NA \tabularnewline
(p-val) & (NA ) & (NA ) & (NA ) & (NA ) & (NA ) & (NA ) & (NA ) \tabularnewline
Estimates ( 12 ) & NA & NA & NA & NA & NA & NA & NA \tabularnewline
(p-val) & (NA ) & (NA ) & (NA ) & (NA ) & (NA ) & (NA ) & (NA ) \tabularnewline
Estimates ( 13 ) & NA & NA & NA & NA & NA & NA & NA \tabularnewline
(p-val) & (NA ) & (NA ) & (NA ) & (NA ) & (NA ) & (NA ) & (NA ) \tabularnewline
\hline
\end{tabular}
%Source: https://freestatistics.org/blog/index.php?pk=109649&T=1

[TABLE]
[ROW][C]ARIMA Parameter Estimation and Backward Selection[/C][/ROW]
[ROW][C]Iteration[/C][C]ar1[/C][C]ar2[/C][C]ar3[/C][C]ma1[/C][C]sar1[/C][C]sar2[/C][C]sma1[/C][/ROW]
[ROW][C]Estimates ( 1 )[/C][C]0.4277[/C][C]0.1166[/C][C]0.1414[/C][C]-0.649[/C][C]0.1077[/C][C]0.1133[/C][C]-0.9986[/C][/ROW]
[ROW][C](p-val)[/C][C](0.1804 )[/C][C](0.4665 )[/C][C](0.3126 )[/C][C](0.0329 )[/C][C](0.6758 )[/C][C](0.6392 )[/C][C](0.1971 )[/C][/ROW]
[ROW][C]Estimates ( 2 )[/C][C]0.4264[/C][C]0.1247[/C][C]0.1398[/C][C]-0.6558[/C][C]0[/C][C]0.0579[/C][C]-1.2614[/C][/ROW]
[ROW][C](p-val)[/C][C](0.1795 )[/C][C](0.4321 )[/C][C](0.3209 )[/C][C](0.0287 )[/C][C](NA )[/C][C](0.778 )[/C][C](0.0342 )[/C][/ROW]
[ROW][C]Estimates ( 3 )[/C][C]0.4159[/C][C]0.1166[/C][C]0.1458[/C][C]-0.6409[/C][C]0[/C][C]0[/C][C]-0.7753[/C][/ROW]
[ROW][C](p-val)[/C][C](0.189 )[/C][C](0.4531 )[/C][C](0.2954 )[/C][C](0.0309 )[/C][C](NA )[/C][C](NA )[/C][C](0.0304 )[/C][/ROW]
[ROW][C]Estimates ( 4 )[/C][C]0.3392[/C][C]0[/C][C]0.1794[/C][C]-0.5327[/C][C]0[/C][C]0[/C][C]-0.7628[/C][/ROW]
[ROW][C](p-val)[/C][C](0.5194 )[/C][C](NA )[/C][C](0.2481 )[/C][C](0.2553 )[/C][C](NA )[/C][C](NA )[/C][C](0.0292 )[/C][/ROW]
[ROW][C]Estimates ( 5 )[/C][C]0[/C][C]0[/C][C]0.1039[/C][C]-0.2264[/C][C]0[/C][C]0[/C][C]-0.8019[/C][/ROW]
[ROW][C](p-val)[/C][C](NA )[/C][C](NA )[/C][C](0.4643 )[/C][C](0.0719 )[/C][C](NA )[/C][C](NA )[/C][C](0.0483 )[/C][/ROW]
[ROW][C]Estimates ( 6 )[/C][C]0[/C][C]0[/C][C]0[/C][C]-0.205[/C][C]0[/C][C]0[/C][C]-0.868[/C][/ROW]
[ROW][C](p-val)[/C][C](NA )[/C][C](NA )[/C][C](NA )[/C][C](0.0872 )[/C][C](NA )[/C][C](NA )[/C][C](0.1434 )[/C][/ROW]
[ROW][C]Estimates ( 7 )[/C][C]0[/C][C]0[/C][C]0[/C][C]-0.118[/C][C]0[/C][C]0[/C][C]0[/C][/ROW]
[ROW][C](p-val)[/C][C](NA )[/C][C](NA )[/C][C](NA )[/C][C](0.3456 )[/C][C](NA )[/C][C](NA )[/C][C](NA )[/C][/ROW]
[ROW][C]Estimates ( 8 )[/C][C]0[/C][C]0[/C][C]0[/C][C]0[/C][C]0[/C][C]0[/C][C]0[/C][/ROW]
[ROW][C](p-val)[/C][C](NA )[/C][C](NA )[/C][C](NA )[/C][C](NA )[/C][C](NA )[/C][C](NA )[/C][C](NA )[/C][/ROW]
[ROW][C]Estimates ( 9 )[/C][C]NA[/C][C]NA[/C][C]NA[/C][C]NA[/C][C]NA[/C][C]NA[/C][C]NA[/C][/ROW]
[ROW][C](p-val)[/C][C](NA )[/C][C](NA )[/C][C](NA )[/C][C](NA )[/C][C](NA )[/C][C](NA )[/C][C](NA )[/C][/ROW]
[ROW][C]Estimates ( 10 )[/C][C]NA[/C][C]NA[/C][C]NA[/C][C]NA[/C][C]NA[/C][C]NA[/C][C]NA[/C][/ROW]
[ROW][C](p-val)[/C][C](NA )[/C][C](NA )[/C][C](NA )[/C][C](NA )[/C][C](NA )[/C][C](NA )[/C][C](NA )[/C][/ROW]
[ROW][C]Estimates ( 11 )[/C][C]NA[/C][C]NA[/C][C]NA[/C][C]NA[/C][C]NA[/C][C]NA[/C][C]NA[/C][/ROW]
[ROW][C](p-val)[/C][C](NA )[/C][C](NA )[/C][C](NA )[/C][C](NA )[/C][C](NA )[/C][C](NA )[/C][C](NA )[/C][/ROW]
[ROW][C]Estimates ( 12 )[/C][C]NA[/C][C]NA[/C][C]NA[/C][C]NA[/C][C]NA[/C][C]NA[/C][C]NA[/C][/ROW]
[ROW][C](p-val)[/C][C](NA )[/C][C](NA )[/C][C](NA )[/C][C](NA )[/C][C](NA )[/C][C](NA )[/C][C](NA )[/C][/ROW]
[ROW][C]Estimates ( 13 )[/C][C]NA[/C][C]NA[/C][C]NA[/C][C]NA[/C][C]NA[/C][C]NA[/C][C]NA[/C][/ROW]
[ROW][C](p-val)[/C][C](NA )[/C][C](NA )[/C][C](NA )[/C][C](NA )[/C][C](NA )[/C][C](NA )[/C][C](NA )[/C][/ROW]
[/TABLE]
Source: https://freestatistics.org/blog/index.php?pk=109649&T=1

Globally Unique Identifier (entire table): ba.freestatistics.org/blog/index.php?pk=109649&T=1

As an alternative you can also use a QR Code:  

The GUIDs for individual cells are displayed in the table below:

ARIMA Parameter Estimation and Backward Selection
Iterationar1ar2ar3ma1sar1sar2sma1
Estimates ( 1 )0.42770.11660.1414-0.6490.10770.1133-0.9986
(p-val)(0.1804 )(0.4665 )(0.3126 )(0.0329 )(0.6758 )(0.6392 )(0.1971 )
Estimates ( 2 )0.42640.12470.1398-0.655800.0579-1.2614
(p-val)(0.1795 )(0.4321 )(0.3209 )(0.0287 )(NA )(0.778 )(0.0342 )
Estimates ( 3 )0.41590.11660.1458-0.640900-0.7753
(p-val)(0.189 )(0.4531 )(0.2954 )(0.0309 )(NA )(NA )(0.0304 )
Estimates ( 4 )0.339200.1794-0.532700-0.7628
(p-val)(0.5194 )(NA )(0.2481 )(0.2553 )(NA )(NA )(0.0292 )
Estimates ( 5 )000.1039-0.226400-0.8019
(p-val)(NA )(NA )(0.4643 )(0.0719 )(NA )(NA )(0.0483 )
Estimates ( 6 )000-0.20500-0.868
(p-val)(NA )(NA )(NA )(0.0872 )(NA )(NA )(0.1434 )
Estimates ( 7 )000-0.118000
(p-val)(NA )(NA )(NA )(0.3456 )(NA )(NA )(NA )
Estimates ( 8 )0000000
(p-val)(NA )(NA )(NA )(NA )(NA )(NA )(NA )
Estimates ( 9 )NANANANANANANA
(p-val)(NA )(NA )(NA )(NA )(NA )(NA )(NA )
Estimates ( 10 )NANANANANANANA
(p-val)(NA )(NA )(NA )(NA )(NA )(NA )(NA )
Estimates ( 11 )NANANANANANANA
(p-val)(NA )(NA )(NA )(NA )(NA )(NA )(NA )
Estimates ( 12 )NANANANANANANA
(p-val)(NA )(NA )(NA )(NA )(NA )(NA )(NA )
Estimates ( 13 )NANANANANANANA
(p-val)(NA )(NA )(NA )(NA )(NA )(NA )(NA )


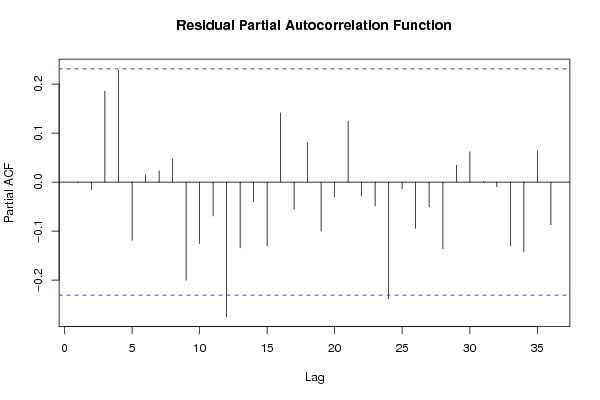
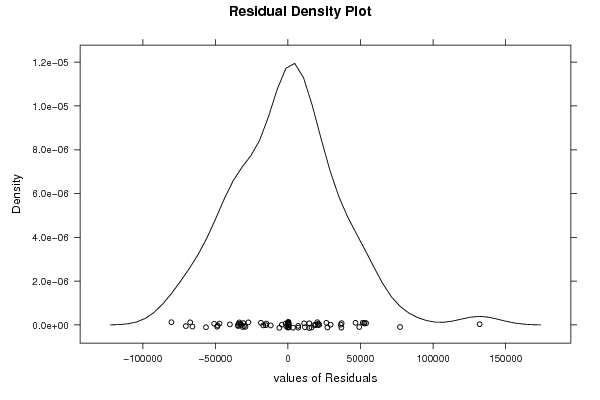
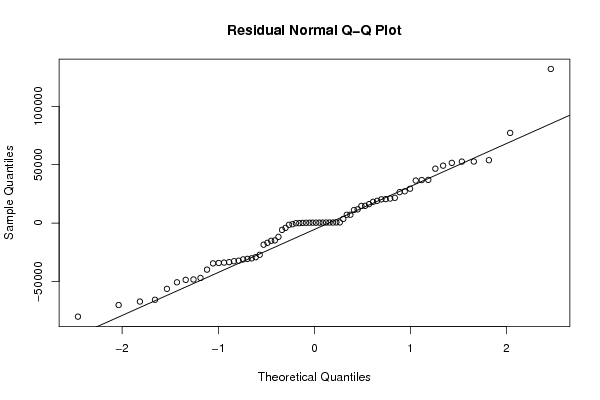
Estimated ARIMA Residuals
Value
-4155.06906968191
-47087.532771068
49169.4122986987
-32734.8128263872
11188.8238597630
36826.7592989792
-16979.1601281891
-50810.7489298702
36416.7016013959
-29290.5278024131
7100.08392977602
-33923.5212677858
20510.6067907672
7078.29491890249
20290.9086454021
52713.3807852306
-11840.2797933430
-33521.6007458994
-30250.9853299572
-18573.2052631700
19024.2280945189
18158.9715623867
-5895.08834998543
337.654541072436
-15247.1725134754
-1519.45517815778
52667.7751613802
-48716.6591297614
11722.7065284045
53860.7325846413
27203.0542027133
26499.6915557194
-115.272429471137
21596.4032300089
14679.3682536401
20976.4807597618
-27233.7536826199
46585.6873375769
-56442.061804327
-34584.5306489247
197.638520043576
-39952.6878731474
-34236.5536438499
-32286.3164241533
-31196.2793977277
-30714.7058715331
-80253.9026576197
-14896.2172067917
-67302.0588216828
-70300.5037508805
16232.8196048387
132069.715561107
-65778.9337310705
3506.1539662322
29403.5626294264
51574.2489110977
-48371.6442216225
37001.4021949314
77248.4395915226
14730.7127497056

\begin{tabular}{lllllllll}
\hline
Estimated ARIMA Residuals \tabularnewline
Value \tabularnewline
-4155.06906968191 \tabularnewline
-47087.532771068 \tabularnewline
49169.4122986987 \tabularnewline
-32734.8128263872 \tabularnewline
11188.8238597630 \tabularnewline
36826.7592989792 \tabularnewline
-16979.1601281891 \tabularnewline
-50810.7489298702 \tabularnewline
36416.7016013959 \tabularnewline
-29290.5278024131 \tabularnewline
7100.08392977602 \tabularnewline
-33923.5212677858 \tabularnewline
20510.6067907672 \tabularnewline
7078.29491890249 \tabularnewline
20290.9086454021 \tabularnewline
52713.3807852306 \tabularnewline
-11840.2797933430 \tabularnewline
-33521.6007458994 \tabularnewline
-30250.9853299572 \tabularnewline
-18573.2052631700 \tabularnewline
19024.2280945189 \tabularnewline
18158.9715623867 \tabularnewline
-5895.08834998543 \tabularnewline
337.654541072436 \tabularnewline
-15247.1725134754 \tabularnewline
-1519.45517815778 \tabularnewline
52667.7751613802 \tabularnewline
-48716.6591297614 \tabularnewline
11722.7065284045 \tabularnewline
53860.7325846413 \tabularnewline
27203.0542027133 \tabularnewline
26499.6915557194 \tabularnewline
-115.272429471137 \tabularnewline
21596.4032300089 \tabularnewline
14679.3682536401 \tabularnewline
20976.4807597618 \tabularnewline
-27233.7536826199 \tabularnewline
46585.6873375769 \tabularnewline
-56442.061804327 \tabularnewline
-34584.5306489247 \tabularnewline
197.638520043576 \tabularnewline
-39952.6878731474 \tabularnewline
-34236.5536438499 \tabularnewline
-32286.3164241533 \tabularnewline
-31196.2793977277 \tabularnewline
-30714.7058715331 \tabularnewline
-80253.9026576197 \tabularnewline
-14896.2172067917 \tabularnewline
-67302.0588216828 \tabularnewline
-70300.5037508805 \tabularnewline
16232.8196048387 \tabularnewline
132069.715561107 \tabularnewline
-65778.9337310705 \tabularnewline
3506.1539662322 \tabularnewline
29403.5626294264 \tabularnewline
51574.2489110977 \tabularnewline
-48371.6442216225 \tabularnewline
37001.4021949314 \tabularnewline
77248.4395915226 \tabularnewline
14730.7127497056 \tabularnewline
\hline
\end{tabular}
%Source: https://freestatistics.org/blog/index.php?pk=109649&T=2

[TABLE]
[ROW][C]Estimated ARIMA Residuals[/C][/ROW]
[ROW][C]Value[/C][/ROW]
[ROW][C]-4155.06906968191[/C][/ROW]
[ROW][C]-47087.532771068[/C][/ROW]
[ROW][C]49169.4122986987[/C][/ROW]
[ROW][C]-32734.8128263872[/C][/ROW]
[ROW][C]11188.8238597630[/C][/ROW]
[ROW][C]36826.7592989792[/C][/ROW]
[ROW][C]-16979.1601281891[/C][/ROW]
[ROW][C]-50810.7489298702[/C][/ROW]
[ROW][C]36416.7016013959[/C][/ROW]
[ROW][C]-29290.5278024131[/C][/ROW]
[ROW][C]7100.08392977602[/C][/ROW]
[ROW][C]-33923.5212677858[/C][/ROW]
[ROW][C]20510.6067907672[/C][/ROW]
[ROW][C]7078.29491890249[/C][/ROW]
[ROW][C]20290.9086454021[/C][/ROW]
[ROW][C]52713.3807852306[/C][/ROW]
[ROW][C]-11840.2797933430[/C][/ROW]
[ROW][C]-33521.6007458994[/C][/ROW]
[ROW][C]-30250.9853299572[/C][/ROW]
[ROW][C]-18573.2052631700[/C][/ROW]
[ROW][C]19024.2280945189[/C][/ROW]
[ROW][C]18158.9715623867[/C][/ROW]
[ROW][C]-5895.08834998543[/C][/ROW]
[ROW][C]337.654541072436[/C][/ROW]
[ROW][C]-15247.1725134754[/C][/ROW]
[ROW][C]-1519.45517815778[/C][/ROW]
[ROW][C]52667.7751613802[/C][/ROW]
[ROW][C]-48716.6591297614[/C][/ROW]
[ROW][C]11722.7065284045[/C][/ROW]
[ROW][C]53860.7325846413[/C][/ROW]
[ROW][C]27203.0542027133[/C][/ROW]
[ROW][C]26499.6915557194[/C][/ROW]
[ROW][C]-115.272429471137[/C][/ROW]
[ROW][C]21596.4032300089[/C][/ROW]
[ROW][C]14679.3682536401[/C][/ROW]
[ROW][C]20976.4807597618[/C][/ROW]
[ROW][C]-27233.7536826199[/C][/ROW]
[ROW][C]46585.6873375769[/C][/ROW]
[ROW][C]-56442.061804327[/C][/ROW]
[ROW][C]-34584.5306489247[/C][/ROW]
[ROW][C]197.638520043576[/C][/ROW]
[ROW][C]-39952.6878731474[/C][/ROW]
[ROW][C]-34236.5536438499[/C][/ROW]
[ROW][C]-32286.3164241533[/C][/ROW]
[ROW][C]-31196.2793977277[/C][/ROW]
[ROW][C]-30714.7058715331[/C][/ROW]
[ROW][C]-80253.9026576197[/C][/ROW]
[ROW][C]-14896.2172067917[/C][/ROW]
[ROW][C]-67302.0588216828[/C][/ROW]
[ROW][C]-70300.5037508805[/C][/ROW]
[ROW][C]16232.8196048387[/C][/ROW]
[ROW][C]132069.715561107[/C][/ROW]
[ROW][C]-65778.9337310705[/C][/ROW]
[ROW][C]3506.1539662322[/C][/ROW]
[ROW][C]29403.5626294264[/C][/ROW]
[ROW][C]51574.2489110977[/C][/ROW]
[ROW][C]-48371.6442216225[/C][/ROW]
[ROW][C]37001.4021949314[/C][/ROW]
[ROW][C]77248.4395915226[/C][/ROW]
[ROW][C]14730.7127497056[/C][/ROW]
[/TABLE]
Source: https://freestatistics.org/blog/index.php?pk=109649&T=2

Globally Unique Identifier (entire table): ba.freestatistics.org/blog/index.php?pk=109649&T=2

As an alternative you can also use a QR Code:  

The GUIDs for individual cells are displayed in the table below:

Estimated ARIMA Residuals
Value
-4155.06906968191
-47087.532771068
49169.4122986987
-32734.8128263872
11188.8238597630
36826.7592989792
-16979.1601281891
-50810.7489298702
36416.7016013959
-29290.5278024131
7100.08392977602
-33923.5212677858
20510.6067907672
7078.29491890249
20290.9086454021
52713.3807852306
-11840.2797933430
-33521.6007458994
-30250.9853299572
-18573.2052631700
19024.2280945189
18158.9715623867
-5895.08834998543
337.654541072436
-15247.1725134754
-1519.45517815778
52667.7751613802
-48716.6591297614
11722.7065284045
53860.7325846413
27203.0542027133
26499.6915557194
-115.272429471137
21596.4032300089
14679.3682536401
20976.4807597618
-27233.7536826199
46585.6873375769
-56442.061804327
-34584.5306489247
197.638520043576
-39952.6878731474
-34236.5536438499
-32286.3164241533
-31196.2793977277
-30714.7058715331
-80253.9026576197
-14896.2172067917
-67302.0588216828
-70300.5037508805
16232.8196048387
132069.715561107
-65778.9337310705
3506.1539662322
29403.5626294264
51574.2489110977
-48371.6442216225
37001.4021949314
77248.4395915226
14730.7127497056


Parameters (Session):
par1 = 60 ; par2 = 1 ; par3 = 0 ; par4 = 0 ; par5 = 12 ; par6 = White Noise ; par7 = 0.95 ;
Parameters (R input):
par1 = FALSE ; par2 = 1 ; par3 = 1 ; par4 = 1 ; par5 = 12 ; par6 = 3 ; par7 = 1 ; par8 = 2 ; par9 = 1 ;
R code (references can be found in the software module):
library(lattice)
if (par1 == 'TRUE') par1 <- TRUE
if (par1 == 'FALSE') par1 <- FALSE
par2 <- as.numeric(par2) #Box-Cox lambda transformation parameter
par3 <- as.numeric(par3) #degree of non-seasonal differencing
par4 <- as.numeric(par4) #degree of seasonal differencing
par5 <- as.numeric(par5) #seasonal period
par6 <- as.numeric(par6) #degree (p) of the non-seasonal AR(p) polynomial
par7 <- as.numeric(par7) #degree (q) of the non-seasonal MA(q) polynomial
par8 <- as.numeric(par8) #degree (P) of the seasonal AR(P) polynomial
par9 <- as.numeric(par9) #degree (Q) of the seasonal MA(Q) polynomial
armaGR <- function(arima.out, names, n){
try1 <- arima.out$coef
try2 <- sqrt(diag(arima.out$var.coef))
try.data.frame <- data.frame(matrix(NA,ncol=4,nrow=length(names)))
dimnames(try.data.frame) <- list(names,c('coef','std','tstat','pv'))
try.data.frame[,1] <- try1
for(i in 1:length(try2)) try.data.frame[which(rownames(try.data.frame)==names(try2)[i]),2] <- try2[i]
try.data.frame[,3] <- try.data.frame[,1] / try.data.frame[,2]
try.data.frame[,4] <- round((1-pt(abs(try.data.frame[,3]),df=n-(length(try2)+1)))*2,5)
vector <- rep(NA,length(names))
vector[is.na(try.data.frame[,4])] <- 0
maxi <- which.max(try.data.frame[,4])
continue <- max(try.data.frame[,4],na.rm=TRUE) > .05
vector[maxi] <- 0
list(summary=try.data.frame,next.vector=vector,continue=continue)
}
arimaSelect <- function(series, order=c(13,0,0), seasonal=list(order=c(2,0,0),period=12), include.mean=F){
nrc <- order[1]+order[3]+seasonal$order[1]+seasonal$order[3]
coeff <- matrix(NA, nrow=nrc*2, ncol=nrc)
pval <- matrix(NA, nrow=nrc*2, ncol=nrc)
mylist <- rep(list(NULL), nrc)
names <- NULL
if(order[1] > 0) names <- paste('ar',1:order[1],sep='')
if(order[3] > 0) names <- c( names , paste('ma',1:order[3],sep='') )
if(seasonal$order[1] > 0) names <- c(names, paste('sar',1:seasonal$order[1],sep=''))
if(seasonal$order[3] > 0) names <- c(names, paste('sma',1:seasonal$order[3],sep=''))
arima.out <- arima(series, order=order, seasonal=seasonal, include.mean=include.mean, method='ML')
mylist[[1]] <- arima.out
last.arma <- armaGR(arima.out, names, length(series))
mystop <- FALSE
i <- 1
coeff[i,] <- last.arma[[1]][,1]
pval [i,] <- last.arma[[1]][,4]
i <- 2
aic <- arima.out$aic
while(!mystop){
mylist[[i]] <- arima.out
arima.out <- arima(series, order=order, seasonal=seasonal, include.mean=include.mean, method='ML', fixed=last.arma$next.vector)
aic <- c(aic, arima.out$aic)
last.arma <- armaGR(arima.out, names, length(series))
mystop <- !last.arma$continue
coeff[i,] <- last.arma[[1]][,1]
pval [i,] <- last.arma[[1]][,4]
i <- i+1
}
list(coeff, pval, mylist, aic=aic)
}
arimaSelectplot <- function(arimaSelect.out,noms,choix){
noms <- names(arimaSelect.out[[3]][[1]]$coef)
coeff <- arimaSelect.out[[1]]
k <- min(which(is.na(coeff[,1])))-1
coeff <- coeff[1:k,]
pval <- arimaSelect.out[[2]][1:k,]
aic <- arimaSelect.out$aic[1:k]
coeff[coeff==0] <- NA
n <- ncol(coeff)
if(missing(choix)) choix <- k
layout(matrix(c(1,1,1,2,
3,3,3,2,
3,3,3,4,
5,6,7,7),nr=4),
widths=c(10,35,45,15),
heights=c(30,30,15,15))
couleurs <- rainbow(75)[1:50]#(50)
ticks <- pretty(coeff)
par(mar=c(1,1,3,1))
plot(aic,k:1-.5,type='o',pch=21,bg='blue',cex=2,axes=F,lty=2,xpd=NA)
points(aic[choix],k-choix+.5,pch=21,cex=4,bg=2,xpd=NA)
title('aic',line=2)
par(mar=c(3,0,0,0))
plot(0,axes=F,xlab='',ylab='',xlim=range(ticks),ylim=c(.1,1))
rect(xleft = min(ticks) + (0:49)/50*(max(ticks)-min(ticks)),
xright = min(ticks) + (1:50)/50*(max(ticks)-min(ticks)),
ytop = rep(1,50),
ybottom= rep(0,50),col=couleurs,border=NA)
axis(1,ticks)
rect(xleft=min(ticks),xright=max(ticks),ytop=1,ybottom=0)
text(mean(coeff,na.rm=T),.5,'coefficients',cex=2,font=2)
par(mar=c(1,1,3,1))
image(1:n,1:k,t(coeff[k:1,]),axes=F,col=couleurs,zlim=range(ticks))
for(i in 1:n) for(j in 1:k) if(!is.na(coeff[j,i])) {
if(pval[j,i]<.01) symb = 'green'
else if( (pval[j,i]<.05) & (pval[j,i]>=.01)) symb = 'orange'
else if( (pval[j,i]<.1) & (pval[j,i]>=.05)) symb = 'red'
else symb = 'black'
polygon(c(i+.5 ,i+.2 ,i+.5 ,i+.5),
c(k-j+0.5,k-j+0.5,k-j+0.8,k-j+0.5),
col=symb)
if(j==choix) {
rect(xleft=i-.5,
xright=i+.5,
ybottom=k-j+1.5,
ytop=k-j+.5,
lwd=4)
text(i,
k-j+1,
round(coeff[j,i],2),
cex=1.2,
font=2)
}
else{
rect(xleft=i-.5,xright=i+.5,ybottom=k-j+1.5,ytop=k-j+.5)
text(i,k-j+1,round(coeff[j,i],2),cex=1.2,font=1)
}
}
axis(3,1:n,noms)
par(mar=c(0.5,0,0,0.5))
plot(0,axes=F,xlab='',ylab='',type='n',xlim=c(0,8),ylim=c(-.2,.8))
cols <- c('green','orange','red','black')
niv <- c('0','0.01','0.05','0.1')
for(i in 0:3){
polygon(c(1+2*i ,1+2*i ,1+2*i-.5 ,1+2*i),
c(.4 ,.7 , .4 , .4),
col=cols[i+1])
text(2*i,0.5,niv[i+1],cex=1.5)
}
text(8,.5,1,cex=1.5)
text(4,0,'p-value',cex=2)
box()
residus <- arimaSelect.out[[3]][[choix]]$res
par(mar=c(1,2,4,1))
acf(residus,main='')
title('acf',line=.5)
par(mar=c(1,2,4,1))
pacf(residus,main='')
title('pacf',line=.5)
par(mar=c(2,2,4,1))
qqnorm(residus,main='')
title('qq-norm',line=.5)
qqline(residus)
residus
}
if (par2 == 0) x <- log(x)
if (par2 != 0) x <- x^par2
(selection <- arimaSelect(x, order=c(par6,par3,par7), seasonal=list(order=c(par8,par4,par9), period=par5)))
bitmap(file='test1.png')
resid <- arimaSelectplot(selection)
dev.off()
resid
bitmap(file='test2.png')
acf(resid,length(resid)/2, main='Residual Autocorrelation Function')
dev.off()
bitmap(file='test3.png')
pacf(resid,length(resid)/2, main='Residual Partial Autocorrelation Function')
dev.off()
bitmap(file='test4.png')
cpgram(resid, main='Residual Cumulative Periodogram')
dev.off()
bitmap(file='test5.png')
hist(resid, main='Residual Histogram', xlab='values of Residuals')
dev.off()
bitmap(file='test6.png')
densityplot(~resid,col='black',main='Residual Density Plot', xlab='values of Residuals')
dev.off()
bitmap(file='test7.png')
qqnorm(resid, main='Residual Normal Q-Q Plot')
qqline(resid)
dev.off()
ncols <- length(selection[[1]][1,])
nrows <- length(selection[[2]][,1])-1
load(file='createtable')
a<-table.start()
a<-table.row.start(a)
a<-table.element(a,'ARIMA Parameter Estimation and Backward Selection', ncols+1,TRUE)
a<-table.row.end(a)
a<-table.row.start(a)
a<-table.element(a,'Iteration', header=TRUE)
for (i in 1:ncols) {
a<-table.element(a,names(selection[[3]][[1]]$coef)[i],header=TRUE)
}
a<-table.row.end(a)
for (j in 1:nrows) {
a<-table.row.start(a)
mydum <- 'Estimates ('
mydum <- paste(mydum,j)
mydum <- paste(mydum,')')
a<-table.element(a,mydum, header=TRUE)
for (i in 1:ncols) {
a<-table.element(a,round(selection[[1]][j,i],4))
}
a<-table.row.end(a)
a<-table.row.start(a)
a<-table.element(a,'(p-val)', header=TRUE)
for (i in 1:ncols) {
mydum <- '('
mydum <- paste(mydum,round(selection[[2]][j,i],4),sep='')
mydum <- paste(mydum,')')
a<-table.element(a,mydum)
}
a<-table.row.end(a)
}
a<-table.end(a)
table.save(a,file='mytable.tab')
a<-table.start()
a<-table.row.start(a)
a<-table.element(a,'Estimated ARIMA Residuals', 1,TRUE)
a<-table.row.end(a)
a<-table.row.start(a)
a<-table.element(a,'Value', 1,TRUE)
a<-table.row.end(a)
for (i in (par4*par5+par3):length(resid)) {
a<-table.row.start(a)
a<-table.element(a,resid[i])
a<-table.row.end(a)
}
a<-table.end(a)
table.save(a,file='mytable1.tab')