Free Statistics

of Irreproducible Research!

Author's title

Author*The author of this computation has been verified*
R Software Modulerwasp_autocorrelation.wasp
Title produced by software(Partial) Autocorrelation Function
Date of computationTue, 14 Dec 2010 13:09:27 +0000
Cite this page as followsStatistical Computations at FreeStatistics.org, Office for Research Development and Education, URL https://freestatistics.org/blog/index.php?v=date/2010/Dec/14/t12923320828lhallxvd63ib1l.htm/, Retrieved Mon, 29 Apr 2024 04:25:39 +0000
Statistical Computations at FreeStatistics.org, Office for Research Development and Education, URL https://freestatistics.org/blog/index.php?pk=109560, Retrieved Mon, 29 Apr 2024 04:25:39 +0000
QR Codes:

Original text written by user:
IsPrivate?No (this computation is public)
User-defined keywords
Estimated Impact145
Family? (F = Feedback message, R = changed R code, M = changed R Module, P = changed Parameters, D = changed Data)
-     [Univariate Explorative Data Analysis] [Monthly US soldie...] [2010-11-02 12:07:39] [b98453cac15ba1066b407e146608df68]
- RMP   [(Partial) Autocorrelation Function] [Soldiers] [2010-11-29 09:48:36] [b98453cac15ba1066b407e146608df68]
-   PD    [(Partial) Autocorrelation Function] [Workshop 9] [2010-12-14 12:34:06] [20c5a34fea7ed3b9b27ff444f2eb4dfe]
-             [(Partial) Autocorrelation Function] [Workshop 9] [2010-12-14 13:09:27] [76f6fcd790878de142f355e7238b5c71] [Current]
Feedback Forum

Post a new message
Dataseries X:
921365
987921
1132614
1332224
1418133
1411549
1695920
1636173
1539653
1395314
1127575
1036076
989236
1008380
1207763
1368839
1469798
1498721
1761769
1653214
1599104
1421179
1163995
1037735
1015407
1039210
1258049
1469445
1552346
1549144
1785895
1662335
1629440
1467430
1202209
1076982
1039367
1063449
1335135
1491602
1591972
1641248
1898849
1798580
1762444
1622044
1368955
1262973
1195650
1269530
1479279
1607819
1712466
1721766
1949843
1821326
1757802
1590367
1260647
1149235
1016367
1027885
1262159
1520854
1544144
1564709
1821776
1741365
1623386
1498658
1241822
1136029


Summary of computational transaction
Raw Inputview raw input (R code)
Raw Outputview raw output of R engine
Computing time2 seconds
R Server'Gwilym Jenkins' @ 72.249.127.135

\begin{tabular}{lllllllll}
\hline
Summary of computational transaction \tabularnewline
Raw Input & view raw input (R code)  \tabularnewline
Raw Output & view raw output of R engine  \tabularnewline
Computing time & 2 seconds \tabularnewline
R Server & 'Gwilym Jenkins' @ 72.249.127.135 \tabularnewline
\hline
\end{tabular}
%Source: https://freestatistics.org/blog/index.php?pk=109560&T=0

[TABLE]
[ROW][C]Summary of computational transaction[/C][/ROW]
[ROW][C]Raw Input[/C][C]view raw input (R code) [/C][/ROW]
[ROW][C]Raw Output[/C][C]view raw output of R engine [/C][/ROW]
[ROW][C]Computing time[/C][C]2 seconds[/C][/ROW]
[ROW][C]R Server[/C][C]'Gwilym Jenkins' @ 72.249.127.135[/C][/ROW]
[/TABLE]
Source: https://freestatistics.org/blog/index.php?pk=109560&T=0

Globally Unique Identifier (entire table): ba.freestatistics.org/blog/index.php?pk=109560&T=0

As an alternative you can also use a QR Code:  

The GUIDs for individual cells are displayed in the table below:

Summary of computational transaction
Raw Inputview raw input (R code)
Raw Outputview raw output of R engine
Computing time2 seconds
R Server'Gwilym Jenkins' @ 72.249.127.135


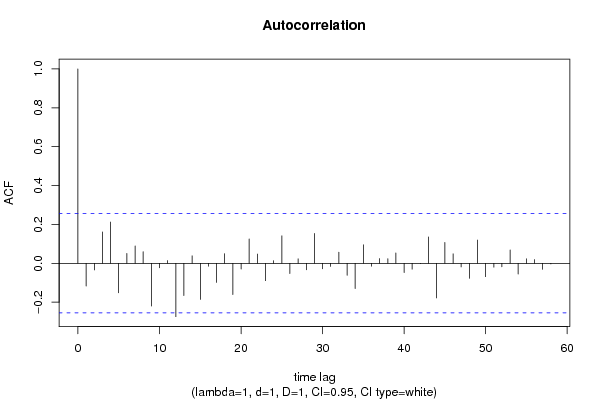
Autocorrelation Function
Time lag kACF(k)T-STATP-value
1-0.117342-0.90130.185542
2-0.034053-0.26160.397284
30.161251.23860.110202
40.2122911.63060.054147
5-0.152159-1.16880.123602
60.0507410.38970.349063
70.0894920.68740.247261
80.0598760.45990.323633
9-0.220189-1.69130.048028
10-0.023456-0.18020.428818
110.0142810.10970.456513
12-0.27455-2.10890.019606
13-0.165833-1.27380.103867
140.0386710.2970.383739
15-0.186019-1.42880.079162
16-0.014886-0.11430.454677
17-0.098537-0.75690.226069
180.0492130.3780.353388
19-0.161144-1.23780.110352
20-0.02998-0.23030.409336
210.125170.96140.170126
220.0476440.3660.357852
23-0.08959-0.68820.247027
240.013670.1050.458366
250.1416881.08830.140438
26-0.053143-0.40820.342303
270.0231240.17760.429815
28-0.033387-0.25650.399247
290.153781.18120.121131
30-0.028216-0.21670.414584
31-0.016151-0.12410.450846
320.0572670.43990.330818
33-0.061959-0.47590.317947
34-0.130123-0.99950.160819
350.0953240.73220.233473
36-0.014649-0.11250.455395
370.0240990.18510.426889
380.0237160.18220.42804
390.0535650.41140.341119
40-0.047611-0.36570.357946
41-0.03062-0.23520.407435
42-0.0016-0.01230.495118
430.1355731.04140.150979
44-0.178365-1.370.087932
450.1071340.82290.206937
460.0485680.37310.355223
47-0.018567-0.14260.443541
48-0.07733-0.5940.277397
490.1196350.91890.180937
50-0.068813-0.52860.299546
51-0.020341-0.15620.438187
52-0.018277-0.14040.444415
530.068610.5270.300082
54-0.055679-0.42770.33522
550.0233490.17930.429139
560.0192710.1480.441415
57-0.031124-0.23910.405939
58-0.003311-0.02540.489899
59NANANA
60NANANA

\begin{tabular}{lllllllll}
\hline
Autocorrelation Function \tabularnewline
Time lag k & ACF(k) & T-STAT & P-value \tabularnewline
1 & -0.117342 & -0.9013 & 0.185542 \tabularnewline
2 & -0.034053 & -0.2616 & 0.397284 \tabularnewline
3 & 0.16125 & 1.2386 & 0.110202 \tabularnewline
4 & 0.212291 & 1.6306 & 0.054147 \tabularnewline
5 & -0.152159 & -1.1688 & 0.123602 \tabularnewline
6 & 0.050741 & 0.3897 & 0.349063 \tabularnewline
7 & 0.089492 & 0.6874 & 0.247261 \tabularnewline
8 & 0.059876 & 0.4599 & 0.323633 \tabularnewline
9 & -0.220189 & -1.6913 & 0.048028 \tabularnewline
10 & -0.023456 & -0.1802 & 0.428818 \tabularnewline
11 & 0.014281 & 0.1097 & 0.456513 \tabularnewline
12 & -0.27455 & -2.1089 & 0.019606 \tabularnewline
13 & -0.165833 & -1.2738 & 0.103867 \tabularnewline
14 & 0.038671 & 0.297 & 0.383739 \tabularnewline
15 & -0.186019 & -1.4288 & 0.079162 \tabularnewline
16 & -0.014886 & -0.1143 & 0.454677 \tabularnewline
17 & -0.098537 & -0.7569 & 0.226069 \tabularnewline
18 & 0.049213 & 0.378 & 0.353388 \tabularnewline
19 & -0.161144 & -1.2378 & 0.110352 \tabularnewline
20 & -0.02998 & -0.2303 & 0.409336 \tabularnewline
21 & 0.12517 & 0.9614 & 0.170126 \tabularnewline
22 & 0.047644 & 0.366 & 0.357852 \tabularnewline
23 & -0.08959 & -0.6882 & 0.247027 \tabularnewline
24 & 0.01367 & 0.105 & 0.458366 \tabularnewline
25 & 0.141688 & 1.0883 & 0.140438 \tabularnewline
26 & -0.053143 & -0.4082 & 0.342303 \tabularnewline
27 & 0.023124 & 0.1776 & 0.429815 \tabularnewline
28 & -0.033387 & -0.2565 & 0.399247 \tabularnewline
29 & 0.15378 & 1.1812 & 0.121131 \tabularnewline
30 & -0.028216 & -0.2167 & 0.414584 \tabularnewline
31 & -0.016151 & -0.1241 & 0.450846 \tabularnewline
32 & 0.057267 & 0.4399 & 0.330818 \tabularnewline
33 & -0.061959 & -0.4759 & 0.317947 \tabularnewline
34 & -0.130123 & -0.9995 & 0.160819 \tabularnewline
35 & 0.095324 & 0.7322 & 0.233473 \tabularnewline
36 & -0.014649 & -0.1125 & 0.455395 \tabularnewline
37 & 0.024099 & 0.1851 & 0.426889 \tabularnewline
38 & 0.023716 & 0.1822 & 0.42804 \tabularnewline
39 & 0.053565 & 0.4114 & 0.341119 \tabularnewline
40 & -0.047611 & -0.3657 & 0.357946 \tabularnewline
41 & -0.03062 & -0.2352 & 0.407435 \tabularnewline
42 & -0.0016 & -0.0123 & 0.495118 \tabularnewline
43 & 0.135573 & 1.0414 & 0.150979 \tabularnewline
44 & -0.178365 & -1.37 & 0.087932 \tabularnewline
45 & 0.107134 & 0.8229 & 0.206937 \tabularnewline
46 & 0.048568 & 0.3731 & 0.355223 \tabularnewline
47 & -0.018567 & -0.1426 & 0.443541 \tabularnewline
48 & -0.07733 & -0.594 & 0.277397 \tabularnewline
49 & 0.119635 & 0.9189 & 0.180937 \tabularnewline
50 & -0.068813 & -0.5286 & 0.299546 \tabularnewline
51 & -0.020341 & -0.1562 & 0.438187 \tabularnewline
52 & -0.018277 & -0.1404 & 0.444415 \tabularnewline
53 & 0.06861 & 0.527 & 0.300082 \tabularnewline
54 & -0.055679 & -0.4277 & 0.33522 \tabularnewline
55 & 0.023349 & 0.1793 & 0.429139 \tabularnewline
56 & 0.019271 & 0.148 & 0.441415 \tabularnewline
57 & -0.031124 & -0.2391 & 0.405939 \tabularnewline
58 & -0.003311 & -0.0254 & 0.489899 \tabularnewline
59 & NA & NA & NA \tabularnewline
60 & NA & NA & NA \tabularnewline
\hline
\end{tabular}
%Source: https://freestatistics.org/blog/index.php?pk=109560&T=1

[TABLE]
[ROW][C]Autocorrelation Function[/C][/ROW]
[ROW][C]Time lag k[/C][C]ACF(k)[/C][C]T-STAT[/C][C]P-value[/C][/ROW]
[ROW][C]1[/C][C]-0.117342[/C][C]-0.9013[/C][C]0.185542[/C][/ROW]
[ROW][C]2[/C][C]-0.034053[/C][C]-0.2616[/C][C]0.397284[/C][/ROW]
[ROW][C]3[/C][C]0.16125[/C][C]1.2386[/C][C]0.110202[/C][/ROW]
[ROW][C]4[/C][C]0.212291[/C][C]1.6306[/C][C]0.054147[/C][/ROW]
[ROW][C]5[/C][C]-0.152159[/C][C]-1.1688[/C][C]0.123602[/C][/ROW]
[ROW][C]6[/C][C]0.050741[/C][C]0.3897[/C][C]0.349063[/C][/ROW]
[ROW][C]7[/C][C]0.089492[/C][C]0.6874[/C][C]0.247261[/C][/ROW]
[ROW][C]8[/C][C]0.059876[/C][C]0.4599[/C][C]0.323633[/C][/ROW]
[ROW][C]9[/C][C]-0.220189[/C][C]-1.6913[/C][C]0.048028[/C][/ROW]
[ROW][C]10[/C][C]-0.023456[/C][C]-0.1802[/C][C]0.428818[/C][/ROW]
[ROW][C]11[/C][C]0.014281[/C][C]0.1097[/C][C]0.456513[/C][/ROW]
[ROW][C]12[/C][C]-0.27455[/C][C]-2.1089[/C][C]0.019606[/C][/ROW]
[ROW][C]13[/C][C]-0.165833[/C][C]-1.2738[/C][C]0.103867[/C][/ROW]
[ROW][C]14[/C][C]0.038671[/C][C]0.297[/C][C]0.383739[/C][/ROW]
[ROW][C]15[/C][C]-0.186019[/C][C]-1.4288[/C][C]0.079162[/C][/ROW]
[ROW][C]16[/C][C]-0.014886[/C][C]-0.1143[/C][C]0.454677[/C][/ROW]
[ROW][C]17[/C][C]-0.098537[/C][C]-0.7569[/C][C]0.226069[/C][/ROW]
[ROW][C]18[/C][C]0.049213[/C][C]0.378[/C][C]0.353388[/C][/ROW]
[ROW][C]19[/C][C]-0.161144[/C][C]-1.2378[/C][C]0.110352[/C][/ROW]
[ROW][C]20[/C][C]-0.02998[/C][C]-0.2303[/C][C]0.409336[/C][/ROW]
[ROW][C]21[/C][C]0.12517[/C][C]0.9614[/C][C]0.170126[/C][/ROW]
[ROW][C]22[/C][C]0.047644[/C][C]0.366[/C][C]0.357852[/C][/ROW]
[ROW][C]23[/C][C]-0.08959[/C][C]-0.6882[/C][C]0.247027[/C][/ROW]
[ROW][C]24[/C][C]0.01367[/C][C]0.105[/C][C]0.458366[/C][/ROW]
[ROW][C]25[/C][C]0.141688[/C][C]1.0883[/C][C]0.140438[/C][/ROW]
[ROW][C]26[/C][C]-0.053143[/C][C]-0.4082[/C][C]0.342303[/C][/ROW]
[ROW][C]27[/C][C]0.023124[/C][C]0.1776[/C][C]0.429815[/C][/ROW]
[ROW][C]28[/C][C]-0.033387[/C][C]-0.2565[/C][C]0.399247[/C][/ROW]
[ROW][C]29[/C][C]0.15378[/C][C]1.1812[/C][C]0.121131[/C][/ROW]
[ROW][C]30[/C][C]-0.028216[/C][C]-0.2167[/C][C]0.414584[/C][/ROW]
[ROW][C]31[/C][C]-0.016151[/C][C]-0.1241[/C][C]0.450846[/C][/ROW]
[ROW][C]32[/C][C]0.057267[/C][C]0.4399[/C][C]0.330818[/C][/ROW]
[ROW][C]33[/C][C]-0.061959[/C][C]-0.4759[/C][C]0.317947[/C][/ROW]
[ROW][C]34[/C][C]-0.130123[/C][C]-0.9995[/C][C]0.160819[/C][/ROW]
[ROW][C]35[/C][C]0.095324[/C][C]0.7322[/C][C]0.233473[/C][/ROW]
[ROW][C]36[/C][C]-0.014649[/C][C]-0.1125[/C][C]0.455395[/C][/ROW]
[ROW][C]37[/C][C]0.024099[/C][C]0.1851[/C][C]0.426889[/C][/ROW]
[ROW][C]38[/C][C]0.023716[/C][C]0.1822[/C][C]0.42804[/C][/ROW]
[ROW][C]39[/C][C]0.053565[/C][C]0.4114[/C][C]0.341119[/C][/ROW]
[ROW][C]40[/C][C]-0.047611[/C][C]-0.3657[/C][C]0.357946[/C][/ROW]
[ROW][C]41[/C][C]-0.03062[/C][C]-0.2352[/C][C]0.407435[/C][/ROW]
[ROW][C]42[/C][C]-0.0016[/C][C]-0.0123[/C][C]0.495118[/C][/ROW]
[ROW][C]43[/C][C]0.135573[/C][C]1.0414[/C][C]0.150979[/C][/ROW]
[ROW][C]44[/C][C]-0.178365[/C][C]-1.37[/C][C]0.087932[/C][/ROW]
[ROW][C]45[/C][C]0.107134[/C][C]0.8229[/C][C]0.206937[/C][/ROW]
[ROW][C]46[/C][C]0.048568[/C][C]0.3731[/C][C]0.355223[/C][/ROW]
[ROW][C]47[/C][C]-0.018567[/C][C]-0.1426[/C][C]0.443541[/C][/ROW]
[ROW][C]48[/C][C]-0.07733[/C][C]-0.594[/C][C]0.277397[/C][/ROW]
[ROW][C]49[/C][C]0.119635[/C][C]0.9189[/C][C]0.180937[/C][/ROW]
[ROW][C]50[/C][C]-0.068813[/C][C]-0.5286[/C][C]0.299546[/C][/ROW]
[ROW][C]51[/C][C]-0.020341[/C][C]-0.1562[/C][C]0.438187[/C][/ROW]
[ROW][C]52[/C][C]-0.018277[/C][C]-0.1404[/C][C]0.444415[/C][/ROW]
[ROW][C]53[/C][C]0.06861[/C][C]0.527[/C][C]0.300082[/C][/ROW]
[ROW][C]54[/C][C]-0.055679[/C][C]-0.4277[/C][C]0.33522[/C][/ROW]
[ROW][C]55[/C][C]0.023349[/C][C]0.1793[/C][C]0.429139[/C][/ROW]
[ROW][C]56[/C][C]0.019271[/C][C]0.148[/C][C]0.441415[/C][/ROW]
[ROW][C]57[/C][C]-0.031124[/C][C]-0.2391[/C][C]0.405939[/C][/ROW]
[ROW][C]58[/C][C]-0.003311[/C][C]-0.0254[/C][C]0.489899[/C][/ROW]
[ROW][C]59[/C][C]NA[/C][C]NA[/C][C]NA[/C][/ROW]
[ROW][C]60[/C][C]NA[/C][C]NA[/C][C]NA[/C][/ROW]
[/TABLE]
Source: https://freestatistics.org/blog/index.php?pk=109560&T=1

Globally Unique Identifier (entire table): ba.freestatistics.org/blog/index.php?pk=109560&T=1

As an alternative you can also use a QR Code:  

The GUIDs for individual cells are displayed in the table below:

Autocorrelation Function
Time lag kACF(k)T-STATP-value
1-0.117342-0.90130.185542
2-0.034053-0.26160.397284
30.161251.23860.110202
40.2122911.63060.054147
5-0.152159-1.16880.123602
60.0507410.38970.349063
70.0894920.68740.247261
80.0598760.45990.323633
9-0.220189-1.69130.048028
10-0.023456-0.18020.428818
110.0142810.10970.456513
12-0.27455-2.10890.019606
13-0.165833-1.27380.103867
140.0386710.2970.383739
15-0.186019-1.42880.079162
16-0.014886-0.11430.454677
17-0.098537-0.75690.226069
180.0492130.3780.353388
19-0.161144-1.23780.110352
20-0.02998-0.23030.409336
210.125170.96140.170126
220.0476440.3660.357852
23-0.08959-0.68820.247027
240.013670.1050.458366
250.1416881.08830.140438
26-0.053143-0.40820.342303
270.0231240.17760.429815
28-0.033387-0.25650.399247
290.153781.18120.121131
30-0.028216-0.21670.414584
31-0.016151-0.12410.450846
320.0572670.43990.330818
33-0.061959-0.47590.317947
34-0.130123-0.99950.160819
350.0953240.73220.233473
36-0.014649-0.11250.455395
370.0240990.18510.426889
380.0237160.18220.42804
390.0535650.41140.341119
40-0.047611-0.36570.357946
41-0.03062-0.23520.407435
42-0.0016-0.01230.495118
430.1355731.04140.150979
44-0.178365-1.370.087932
450.1071340.82290.206937
460.0485680.37310.355223
47-0.018567-0.14260.443541
48-0.07733-0.5940.277397
490.1196350.91890.180937
50-0.068813-0.52860.299546
51-0.020341-0.15620.438187
52-0.018277-0.14040.444415
530.068610.5270.300082
54-0.055679-0.42770.33522
550.0233490.17930.429139
560.0192710.1480.441415
57-0.031124-0.23910.405939
58-0.003311-0.02540.489899
59NANANA
60NANANA


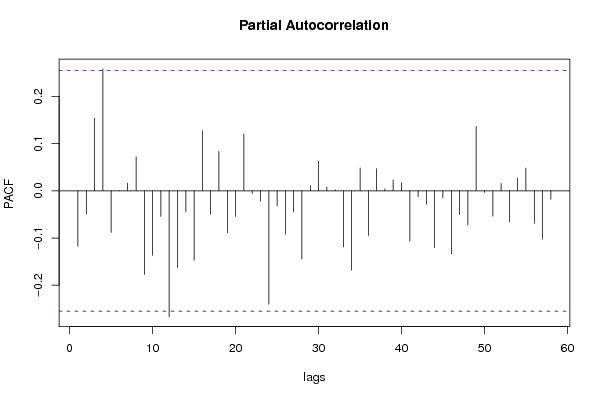
Partial Autocorrelation Function
Time lag kPACF(k)T-STATP-value
1-0.117342-0.90130.185542
2-0.048489-0.37250.355445
30.1538461.18170.121031
40.2581371.98280.026027
5-0.088234-0.67770.250293
60.0005150.0040.49843
70.016190.12440.450727
80.0718660.5520.291513
9-0.177181-1.3610.089352
10-0.136605-1.04930.149163
11-0.054265-0.41680.339162
12-0.266628-2.0480.022509
13-0.162514-1.24830.108428
14-0.044493-0.34180.366873
15-0.147206-1.13070.131376
160.1276350.98040.165451
17-0.049731-0.3820.351921
180.0832610.63950.262473
19-0.08884-0.68240.248831
20-0.054717-0.42030.3379
210.1203610.92450.179494
22-0.005643-0.04330.482787
23-0.022278-0.17110.432358
24-0.24055-1.84770.03483
25-0.03247-0.24940.401956
26-0.09209-0.70740.241065
27-0.045176-0.3470.364912
28-0.144821-1.11240.135241
290.0104780.08050.468062
300.062710.48170.315906
310.0078590.06040.476035
320.0020670.01590.493694
33-0.11886-0.9130.182484
34-0.168133-1.29150.100791
350.0485240.37270.355346
36-0.094755-0.72780.234798
370.0467830.35930.360309
380.003970.03050.487888
390.0229750.17650.430264
400.017570.1350.446553
41-0.106729-0.81980.207816
42-0.012544-0.09640.461784
43-0.028669-0.22020.413234
44-0.120529-0.92580.179161
45-0.015058-0.11570.454156
46-0.133177-1.0230.155253
47-0.050312-0.38650.350275
48-0.072012-0.55310.291132
490.1363651.04740.149584
50-0.00356-0.02730.489138
51-0.05366-0.41220.340854
520.0152210.11690.453663
53-0.065529-0.50330.308302
540.0272950.20970.417328
550.0481880.37010.356303
56-0.068825-0.52870.299513
57-0.102444-0.78690.217248
58-0.017873-0.13730.445638
59NANANA
60NANANA

\begin{tabular}{lllllllll}
\hline
Partial Autocorrelation Function \tabularnewline
Time lag k & PACF(k) & T-STAT & P-value \tabularnewline
1 & -0.117342 & -0.9013 & 0.185542 \tabularnewline
2 & -0.048489 & -0.3725 & 0.355445 \tabularnewline
3 & 0.153846 & 1.1817 & 0.121031 \tabularnewline
4 & 0.258137 & 1.9828 & 0.026027 \tabularnewline
5 & -0.088234 & -0.6777 & 0.250293 \tabularnewline
6 & 0.000515 & 0.004 & 0.49843 \tabularnewline
7 & 0.01619 & 0.1244 & 0.450727 \tabularnewline
8 & 0.071866 & 0.552 & 0.291513 \tabularnewline
9 & -0.177181 & -1.361 & 0.089352 \tabularnewline
10 & -0.136605 & -1.0493 & 0.149163 \tabularnewline
11 & -0.054265 & -0.4168 & 0.339162 \tabularnewline
12 & -0.266628 & -2.048 & 0.022509 \tabularnewline
13 & -0.162514 & -1.2483 & 0.108428 \tabularnewline
14 & -0.044493 & -0.3418 & 0.366873 \tabularnewline
15 & -0.147206 & -1.1307 & 0.131376 \tabularnewline
16 & 0.127635 & 0.9804 & 0.165451 \tabularnewline
17 & -0.049731 & -0.382 & 0.351921 \tabularnewline
18 & 0.083261 & 0.6395 & 0.262473 \tabularnewline
19 & -0.08884 & -0.6824 & 0.248831 \tabularnewline
20 & -0.054717 & -0.4203 & 0.3379 \tabularnewline
21 & 0.120361 & 0.9245 & 0.179494 \tabularnewline
22 & -0.005643 & -0.0433 & 0.482787 \tabularnewline
23 & -0.022278 & -0.1711 & 0.432358 \tabularnewline
24 & -0.24055 & -1.8477 & 0.03483 \tabularnewline
25 & -0.03247 & -0.2494 & 0.401956 \tabularnewline
26 & -0.09209 & -0.7074 & 0.241065 \tabularnewline
27 & -0.045176 & -0.347 & 0.364912 \tabularnewline
28 & -0.144821 & -1.1124 & 0.135241 \tabularnewline
29 & 0.010478 & 0.0805 & 0.468062 \tabularnewline
30 & 0.06271 & 0.4817 & 0.315906 \tabularnewline
31 & 0.007859 & 0.0604 & 0.476035 \tabularnewline
32 & 0.002067 & 0.0159 & 0.493694 \tabularnewline
33 & -0.11886 & -0.913 & 0.182484 \tabularnewline
34 & -0.168133 & -1.2915 & 0.100791 \tabularnewline
35 & 0.048524 & 0.3727 & 0.355346 \tabularnewline
36 & -0.094755 & -0.7278 & 0.234798 \tabularnewline
37 & 0.046783 & 0.3593 & 0.360309 \tabularnewline
38 & 0.00397 & 0.0305 & 0.487888 \tabularnewline
39 & 0.022975 & 0.1765 & 0.430264 \tabularnewline
40 & 0.01757 & 0.135 & 0.446553 \tabularnewline
41 & -0.106729 & -0.8198 & 0.207816 \tabularnewline
42 & -0.012544 & -0.0964 & 0.461784 \tabularnewline
43 & -0.028669 & -0.2202 & 0.413234 \tabularnewline
44 & -0.120529 & -0.9258 & 0.179161 \tabularnewline
45 & -0.015058 & -0.1157 & 0.454156 \tabularnewline
46 & -0.133177 & -1.023 & 0.155253 \tabularnewline
47 & -0.050312 & -0.3865 & 0.350275 \tabularnewline
48 & -0.072012 & -0.5531 & 0.291132 \tabularnewline
49 & 0.136365 & 1.0474 & 0.149584 \tabularnewline
50 & -0.00356 & -0.0273 & 0.489138 \tabularnewline
51 & -0.05366 & -0.4122 & 0.340854 \tabularnewline
52 & 0.015221 & 0.1169 & 0.453663 \tabularnewline
53 & -0.065529 & -0.5033 & 0.308302 \tabularnewline
54 & 0.027295 & 0.2097 & 0.417328 \tabularnewline
55 & 0.048188 & 0.3701 & 0.356303 \tabularnewline
56 & -0.068825 & -0.5287 & 0.299513 \tabularnewline
57 & -0.102444 & -0.7869 & 0.217248 \tabularnewline
58 & -0.017873 & -0.1373 & 0.445638 \tabularnewline
59 & NA & NA & NA \tabularnewline
60 & NA & NA & NA \tabularnewline
\hline
\end{tabular}
%Source: https://freestatistics.org/blog/index.php?pk=109560&T=2

[TABLE]
[ROW][C]Partial Autocorrelation Function[/C][/ROW]
[ROW][C]Time lag k[/C][C]PACF(k)[/C][C]T-STAT[/C][C]P-value[/C][/ROW]
[ROW][C]1[/C][C]-0.117342[/C][C]-0.9013[/C][C]0.185542[/C][/ROW]
[ROW][C]2[/C][C]-0.048489[/C][C]-0.3725[/C][C]0.355445[/C][/ROW]
[ROW][C]3[/C][C]0.153846[/C][C]1.1817[/C][C]0.121031[/C][/ROW]
[ROW][C]4[/C][C]0.258137[/C][C]1.9828[/C][C]0.026027[/C][/ROW]
[ROW][C]5[/C][C]-0.088234[/C][C]-0.6777[/C][C]0.250293[/C][/ROW]
[ROW][C]6[/C][C]0.000515[/C][C]0.004[/C][C]0.49843[/C][/ROW]
[ROW][C]7[/C][C]0.01619[/C][C]0.1244[/C][C]0.450727[/C][/ROW]
[ROW][C]8[/C][C]0.071866[/C][C]0.552[/C][C]0.291513[/C][/ROW]
[ROW][C]9[/C][C]-0.177181[/C][C]-1.361[/C][C]0.089352[/C][/ROW]
[ROW][C]10[/C][C]-0.136605[/C][C]-1.0493[/C][C]0.149163[/C][/ROW]
[ROW][C]11[/C][C]-0.054265[/C][C]-0.4168[/C][C]0.339162[/C][/ROW]
[ROW][C]12[/C][C]-0.266628[/C][C]-2.048[/C][C]0.022509[/C][/ROW]
[ROW][C]13[/C][C]-0.162514[/C][C]-1.2483[/C][C]0.108428[/C][/ROW]
[ROW][C]14[/C][C]-0.044493[/C][C]-0.3418[/C][C]0.366873[/C][/ROW]
[ROW][C]15[/C][C]-0.147206[/C][C]-1.1307[/C][C]0.131376[/C][/ROW]
[ROW][C]16[/C][C]0.127635[/C][C]0.9804[/C][C]0.165451[/C][/ROW]
[ROW][C]17[/C][C]-0.049731[/C][C]-0.382[/C][C]0.351921[/C][/ROW]
[ROW][C]18[/C][C]0.083261[/C][C]0.6395[/C][C]0.262473[/C][/ROW]
[ROW][C]19[/C][C]-0.08884[/C][C]-0.6824[/C][C]0.248831[/C][/ROW]
[ROW][C]20[/C][C]-0.054717[/C][C]-0.4203[/C][C]0.3379[/C][/ROW]
[ROW][C]21[/C][C]0.120361[/C][C]0.9245[/C][C]0.179494[/C][/ROW]
[ROW][C]22[/C][C]-0.005643[/C][C]-0.0433[/C][C]0.482787[/C][/ROW]
[ROW][C]23[/C][C]-0.022278[/C][C]-0.1711[/C][C]0.432358[/C][/ROW]
[ROW][C]24[/C][C]-0.24055[/C][C]-1.8477[/C][C]0.03483[/C][/ROW]
[ROW][C]25[/C][C]-0.03247[/C][C]-0.2494[/C][C]0.401956[/C][/ROW]
[ROW][C]26[/C][C]-0.09209[/C][C]-0.7074[/C][C]0.241065[/C][/ROW]
[ROW][C]27[/C][C]-0.045176[/C][C]-0.347[/C][C]0.364912[/C][/ROW]
[ROW][C]28[/C][C]-0.144821[/C][C]-1.1124[/C][C]0.135241[/C][/ROW]
[ROW][C]29[/C][C]0.010478[/C][C]0.0805[/C][C]0.468062[/C][/ROW]
[ROW][C]30[/C][C]0.06271[/C][C]0.4817[/C][C]0.315906[/C][/ROW]
[ROW][C]31[/C][C]0.007859[/C][C]0.0604[/C][C]0.476035[/C][/ROW]
[ROW][C]32[/C][C]0.002067[/C][C]0.0159[/C][C]0.493694[/C][/ROW]
[ROW][C]33[/C][C]-0.11886[/C][C]-0.913[/C][C]0.182484[/C][/ROW]
[ROW][C]34[/C][C]-0.168133[/C][C]-1.2915[/C][C]0.100791[/C][/ROW]
[ROW][C]35[/C][C]0.048524[/C][C]0.3727[/C][C]0.355346[/C][/ROW]
[ROW][C]36[/C][C]-0.094755[/C][C]-0.7278[/C][C]0.234798[/C][/ROW]
[ROW][C]37[/C][C]0.046783[/C][C]0.3593[/C][C]0.360309[/C][/ROW]
[ROW][C]38[/C][C]0.00397[/C][C]0.0305[/C][C]0.487888[/C][/ROW]
[ROW][C]39[/C][C]0.022975[/C][C]0.1765[/C][C]0.430264[/C][/ROW]
[ROW][C]40[/C][C]0.01757[/C][C]0.135[/C][C]0.446553[/C][/ROW]
[ROW][C]41[/C][C]-0.106729[/C][C]-0.8198[/C][C]0.207816[/C][/ROW]
[ROW][C]42[/C][C]-0.012544[/C][C]-0.0964[/C][C]0.461784[/C][/ROW]
[ROW][C]43[/C][C]-0.028669[/C][C]-0.2202[/C][C]0.413234[/C][/ROW]
[ROW][C]44[/C][C]-0.120529[/C][C]-0.9258[/C][C]0.179161[/C][/ROW]
[ROW][C]45[/C][C]-0.015058[/C][C]-0.1157[/C][C]0.454156[/C][/ROW]
[ROW][C]46[/C][C]-0.133177[/C][C]-1.023[/C][C]0.155253[/C][/ROW]
[ROW][C]47[/C][C]-0.050312[/C][C]-0.3865[/C][C]0.350275[/C][/ROW]
[ROW][C]48[/C][C]-0.072012[/C][C]-0.5531[/C][C]0.291132[/C][/ROW]
[ROW][C]49[/C][C]0.136365[/C][C]1.0474[/C][C]0.149584[/C][/ROW]
[ROW][C]50[/C][C]-0.00356[/C][C]-0.0273[/C][C]0.489138[/C][/ROW]
[ROW][C]51[/C][C]-0.05366[/C][C]-0.4122[/C][C]0.340854[/C][/ROW]
[ROW][C]52[/C][C]0.015221[/C][C]0.1169[/C][C]0.453663[/C][/ROW]
[ROW][C]53[/C][C]-0.065529[/C][C]-0.5033[/C][C]0.308302[/C][/ROW]
[ROW][C]54[/C][C]0.027295[/C][C]0.2097[/C][C]0.417328[/C][/ROW]
[ROW][C]55[/C][C]0.048188[/C][C]0.3701[/C][C]0.356303[/C][/ROW]
[ROW][C]56[/C][C]-0.068825[/C][C]-0.5287[/C][C]0.299513[/C][/ROW]
[ROW][C]57[/C][C]-0.102444[/C][C]-0.7869[/C][C]0.217248[/C][/ROW]
[ROW][C]58[/C][C]-0.017873[/C][C]-0.1373[/C][C]0.445638[/C][/ROW]
[ROW][C]59[/C][C]NA[/C][C]NA[/C][C]NA[/C][/ROW]
[ROW][C]60[/C][C]NA[/C][C]NA[/C][C]NA[/C][/ROW]
[/TABLE]
Source: https://freestatistics.org/blog/index.php?pk=109560&T=2

Globally Unique Identifier (entire table): ba.freestatistics.org/blog/index.php?pk=109560&T=2

As an alternative you can also use a QR Code:  

The GUIDs for individual cells are displayed in the table below:

Partial Autocorrelation Function
Time lag kPACF(k)T-STATP-value
1-0.117342-0.90130.185542
2-0.048489-0.37250.355445
30.1538461.18170.121031
40.2581371.98280.026027
5-0.088234-0.67770.250293
60.0005150.0040.49843
70.016190.12440.450727
80.0718660.5520.291513
9-0.177181-1.3610.089352
10-0.136605-1.04930.149163
11-0.054265-0.41680.339162
12-0.266628-2.0480.022509
13-0.162514-1.24830.108428
14-0.044493-0.34180.366873
15-0.147206-1.13070.131376
160.1276350.98040.165451
17-0.049731-0.3820.351921
180.0832610.63950.262473
19-0.08884-0.68240.248831
20-0.054717-0.42030.3379
210.1203610.92450.179494
22-0.005643-0.04330.482787
23-0.022278-0.17110.432358
24-0.24055-1.84770.03483
25-0.03247-0.24940.401956
26-0.09209-0.70740.241065
27-0.045176-0.3470.364912
28-0.144821-1.11240.135241
290.0104780.08050.468062
300.062710.48170.315906
310.0078590.06040.476035
320.0020670.01590.493694
33-0.11886-0.9130.182484
34-0.168133-1.29150.100791
350.0485240.37270.355346
36-0.094755-0.72780.234798
370.0467830.35930.360309
380.003970.03050.487888
390.0229750.17650.430264
400.017570.1350.446553
41-0.106729-0.81980.207816
42-0.012544-0.09640.461784
43-0.028669-0.22020.413234
44-0.120529-0.92580.179161
45-0.015058-0.11570.454156
46-0.133177-1.0230.155253
47-0.050312-0.38650.350275
48-0.072012-0.55310.291132
490.1363651.04740.149584
50-0.00356-0.02730.489138
51-0.05366-0.41220.340854
520.0152210.11690.453663
53-0.065529-0.50330.308302
540.0272950.20970.417328
550.0481880.37010.356303
56-0.068825-0.52870.299513
57-0.102444-0.78690.217248
58-0.017873-0.13730.445638
59NANANA
60NANANA


Parameters (Session):
par1 = 60 ; par2 = 1 ; par3 = 0 ; par4 = 0 ; par5 = 12 ; par6 = White Noise ; par7 = 0.95 ;
Parameters (R input):
par1 = 60 ; par2 = 1 ; par3 = 1 ; par4 = 1 ; par5 = 12 ; par6 = White Noise ; par7 = 0.95 ;
R code (references can be found in the software module):
if (par1 == 'Default') {
par1 = 10*log10(length(x))
} else {
par1 <- as.numeric(par1)
}
par2 <- as.numeric(par2)
par3 <- as.numeric(par3)
par4 <- as.numeric(par4)
par5 <- as.numeric(par5)
if (par6 == 'White Noise') par6 <- 'white' else par6 <- 'ma'
par7 <- as.numeric(par7)
if (par2 == 0) {
x <- log(x)
} else {
x <- (x ^ par2 - 1) / par2
}
if (par3 > 0) x <- diff(x,lag=1,difference=par3)
if (par4 > 0) x <- diff(x,lag=par5,difference=par4)
bitmap(file='pic1.png')
racf <- acf(x, par1, main='Autocorrelation', xlab='time lag', ylab='ACF', ci.type=par6, ci=par7, sub=paste('(lambda=',par2,', d=',par3,', D=',par4,', CI=', par7, ', CI type=',par6,')',sep=''))
dev.off()
bitmap(file='pic2.png')
rpacf <- pacf(x,par1,main='Partial Autocorrelation',xlab='lags',ylab='PACF')
dev.off()
(myacf <- c(racf$acf))
(mypacf <- c(rpacf$acf))
lengthx <- length(x)
sqrtn <- sqrt(lengthx)
load(file='createtable')
a<-table.start()
a<-table.row.start(a)
a<-table.element(a,'Autocorrelation Function',4,TRUE)
a<-table.row.end(a)
a<-table.row.start(a)
a<-table.element(a,'Time lag k',header=TRUE)
a<-table.element(a,hyperlink('basics.htm','ACF(k)','click here for more information about the Autocorrelation Function'),header=TRUE)
a<-table.element(a,'T-STAT',header=TRUE)
a<-table.element(a,'P-value',header=TRUE)
a<-table.row.end(a)
for (i in 2:(par1+1)) {
a<-table.row.start(a)
a<-table.element(a,i-1,header=TRUE)
a<-table.element(a,round(myacf[i],6))
mytstat <- myacf[i]*sqrtn
a<-table.element(a,round(mytstat,4))
a<-table.element(a,round(1-pt(abs(mytstat),lengthx),6))
a<-table.row.end(a)
}
a<-table.end(a)
table.save(a,file='mytable.tab')
a<-table.start()
a<-table.row.start(a)
a<-table.element(a,'Partial Autocorrelation Function',4,TRUE)
a<-table.row.end(a)
a<-table.row.start(a)
a<-table.element(a,'Time lag k',header=TRUE)
a<-table.element(a,hyperlink('basics.htm','PACF(k)','click here for more information about the Partial Autocorrelation Function'),header=TRUE)
a<-table.element(a,'T-STAT',header=TRUE)
a<-table.element(a,'P-value',header=TRUE)
a<-table.row.end(a)
for (i in 1:par1) {
a<-table.row.start(a)
a<-table.element(a,i,header=TRUE)
a<-table.element(a,round(mypacf[i],6))
mytstat <- mypacf[i]*sqrtn
a<-table.element(a,round(mytstat,4))
a<-table.element(a,round(1-pt(abs(mytstat),lengthx),6))
a<-table.row.end(a)
}
a<-table.end(a)
table.save(a,file='mytable1.tab')