Free Statistics
of Irreproducible Research!
Description of Statistical Computation | |||||||||||||||||||||||||||||||||||||||||
|---|---|---|---|---|---|---|---|---|---|---|---|---|---|---|---|---|---|---|---|---|---|---|---|---|---|---|---|---|---|---|---|---|---|---|---|---|---|---|---|---|---|
| Author's title | |||||||||||||||||||||||||||||||||||||||||
| Author | *The author of this computation has been verified* | ||||||||||||||||||||||||||||||||||||||||
| R Software Module | rwasp_univariatedataseries.wasp | ||||||||||||||||||||||||||||||||||||||||
| Title produced by software | Univariate Data Series | ||||||||||||||||||||||||||||||||||||||||
| Date of computation | Mon, 12 Oct 2009 10:52:29 -0600 | ||||||||||||||||||||||||||||||||||||||||
| Cite this page as follows | Statistical Computations at FreeStatistics.org, Office for Research Development and Education, URL https://freestatistics.org/blog/index.php?v=date/2009/Oct/12/t1255366574l2318j3wtxta8vm.htm/, Retrieved Sat, 30 May 2026 03:06:06 +0000 | ||||||||||||||||||||||||||||||||||||||||
| Statistical Computations at FreeStatistics.org, Office for Research Development and Education, URL https://freestatistics.org/blog/index.php?pk=45716, Retrieved Sat, 30 May 2026 03:06:06 +0000 | |||||||||||||||||||||||||||||||||||||||||
| QR Codes: | |||||||||||||||||||||||||||||||||||||||||
|
| |||||||||||||||||||||||||||||||||||||||||
| Original text written by user: | |||||||||||||||||||||||||||||||||||||||||
| IsPrivate? | No (this computation is public) | ||||||||||||||||||||||||||||||||||||||||
| User-defined keywords | SHWWS2/1 | ||||||||||||||||||||||||||||||||||||||||
| Estimated Impact | 461 | ||||||||||||||||||||||||||||||||||||||||
Tree of Dependent Computations | |||||||||||||||||||||||||||||||||||||||||
| Family? (F = Feedback message, R = changed R code, M = changed R Module, P = changed Parameters, D = changed Data) | |||||||||||||||||||||||||||||||||||||||||
| - [Univariate Data Series] [SHWWS2/1] [2009-10-12 16:52:29] [52b85b290d6f50b0921ad6729b8a5af2] [Current] - PD [Univariate Data Series] [Aantal niet-werke...] [2009-10-24 19:05:50] [9717cb857c153ca3061376906953b329] - PD [Univariate Data Series] [Aantal niet-werke...] [2009-10-24 19:08:34] [9717cb857c153ca3061376906953b329] - MPD [Univariate Data Series] [Aantal inschrijvi...] [2009-11-05 03:01:41] [9717cb857c153ca3061376906953b329] - PD [Univariate Data Series] [Aantal toegekende...] [2009-11-05 03:03:43] [9717cb857c153ca3061376906953b329] - PD [Univariate Data Series] [Totaal niet-werke...] [2009-11-05 03:05:54] [9717cb857c153ca3061376906953b329] - RMPD [Bivariate Explorative Data Analysis] [WS 5] [2009-11-05 03:11:20] [9717cb857c153ca3061376906953b329] - D [Bivariate Explorative Data Analysis] [WS 5] [2009-11-05 03:39:48] [9717cb857c153ca3061376906953b329] - RMPD [Trivariate Scatterplots] [WS 5] [2009-11-05 04:15:15] [9717cb857c153ca3061376906953b329] - RMP [Partial Correlation] [WS 5] [2009-11-05 04:24:39] [9717cb857c153ca3061376906953b329] - R D [Bivariate Explorative Data Analysis] [] [2011-11-22 17:33:37] [fbaf17a8836493f6de0f4e0e997711e1] - R D [Bivariate Explorative Data Analysis] [] [2011-11-22 17:44:12] [fbaf17a8836493f6de0f4e0e997711e1] - RMPD [Partial Correlation] [Review WS5] [2009-11-06 14:02:22] [5c968c05ca472afa314d272082b56b09] | |||||||||||||||||||||||||||||||||||||||||
| Feedback Forum | |||||||||||||||||||||||||||||||||||||||||
Post a new message | |||||||||||||||||||||||||||||||||||||||||
Dataset | |||||||||||||||||||||||||||||||||||||||||
| Dataseries X: | |||||||||||||||||||||||||||||||||||||||||
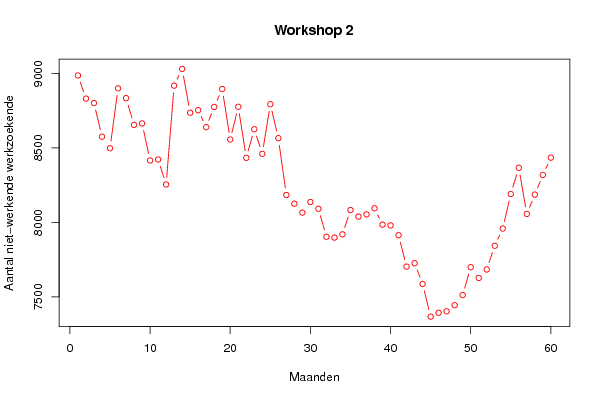
8 987 8 832 8 802 8 576 8 498 8 901 8 835 8 655 8 665 8 416 8 423 8 255 8 919 9 031 8 737 8 754 8 640 8 776 8 896 8 557 8 777 8 434 8 626 8 461 8 794 8 566 8 184 8 126 8 066 8 137 8 092 7 904 7 898 7 920 8 083 8 039 8 054 8 095 7 985 7 980 7 914 7 703 7 726 7 587 7 367 7 393 7 403 7 444 7 512 7 699 7 627 7 684 7 843 7 959 8 191 8 367 8 057 8 187 8 319 8 435 | |||||||||||||||||||||||||||||||||||||||||
Tables (Output of Computation) | |||||||||||||||||||||||||||||||||||||||||
| |||||||||||||||||||||||||||||||||||||||||
Figures (Output of Computation) | |||||||||||||||||||||||||||||||||||||||||
Input Parameters & R Code | |||||||||||||||||||||||||||||||||||||||||
| Parameters (Session): | |||||||||||||||||||||||||||||||||||||||||
| par1 = Niet-werkende werkzoekende per leeftijdsklasse - Brussels Gewest bij mannen 25 jaar tot -30 jaar ; par2 = http://www.nbb.be/belgostat/PresentationLinker?TableId=417000072&Lang=N ; par3 = Aantal niet-werkende werkzoekende ; | |||||||||||||||||||||||||||||||||||||||||
| Parameters (R input): | |||||||||||||||||||||||||||||||||||||||||
| par1 = Niet-werkende werkzoekende per leeftijdsklasse - Brussels Gewest bij mannen 25 jaar tot -30 jaar ; par2 = http://www.nbb.be/belgostat/PresentationLinker?TableId=417000072&Lang=N ; par3 = Aantal niet-werkende werkzoekende ; | |||||||||||||||||||||||||||||||||||||||||
| R code (references can be found in the software module): | |||||||||||||||||||||||||||||||||||||||||
bitmap(file='test1.png') | |||||||||||||||||||||||||||||||||||||||||