Free Statistics
of Irreproducible Research!
Description of Statistical Computation | |||||||||||||||||||||||||||||||||||||||||
|---|---|---|---|---|---|---|---|---|---|---|---|---|---|---|---|---|---|---|---|---|---|---|---|---|---|---|---|---|---|---|---|---|---|---|---|---|---|---|---|---|---|
| Author's title | |||||||||||||||||||||||||||||||||||||||||
| Author | *Unverified author* | ||||||||||||||||||||||||||||||||||||||||
| R Software Module | rwasp_univariatedataseries.wasp | ||||||||||||||||||||||||||||||||||||||||
| Title produced by software | Univariate Data Series | ||||||||||||||||||||||||||||||||||||||||
| Date of computation | Mon, 13 Oct 2008 13:42:56 -0600 | ||||||||||||||||||||||||||||||||||||||||
| Cite this page as follows | Statistical Computations at FreeStatistics.org, Office for Research Development and Education, URL https://freestatistics.org/blog/index.php?v=date/2008/Oct/13/t1223927044yni0y74nwwkgd2j.htm/, Retrieved Wed, 27 May 2026 16:02:45 +0000 | ||||||||||||||||||||||||||||||||||||||||
| Statistical Computations at FreeStatistics.org, Office for Research Development and Education, URL https://freestatistics.org/blog/index.php?pk=15994, Retrieved Wed, 27 May 2026 16:02:45 +0000 | |||||||||||||||||||||||||||||||||||||||||
| QR Codes: | |||||||||||||||||||||||||||||||||||||||||
|
| |||||||||||||||||||||||||||||||||||||||||
| Original text written by user: | |||||||||||||||||||||||||||||||||||||||||
| IsPrivate? | No (this computation is public) | ||||||||||||||||||||||||||||||||||||||||
| User-defined keywords | |||||||||||||||||||||||||||||||||||||||||
| Estimated Impact | 672 | ||||||||||||||||||||||||||||||||||||||||
Tree of Dependent Computations | |||||||||||||||||||||||||||||||||||||||||
| Family? (F = Feedback message, R = changed R code, M = changed R Module, P = changed Parameters, D = changed Data) | |||||||||||||||||||||||||||||||||||||||||
| F [Univariate Data Series] [Gemiddelde renden...] [2008-10-13 19:42:56] [7037e11f14a2a13bc08a0dcfe94c4236] [Current] - PD [Univariate Data Series] [Wisselkoers EURO] [2009-10-11 14:43:41] [5c968c05ca472afa314d272082b56b09] - PD [Univariate Data Series] [Werkloosheid in BE] [2009-10-11 14:54:55] [5c968c05ca472afa314d272082b56b09] - PD [Univariate Data Series] [Bevolkingsaangroei] [2009-10-11 17:32:56] [5c968c05ca472afa314d272082b56b09] - PD [Univariate Data Series] [Buitenlandshandel...] [2009-10-11 18:03:45] [5c968c05ca472afa314d272082b56b09] - PD [Univariate Data Series] [Werkloosheid in BE] [2009-10-11 19:20:59] [5c968c05ca472afa314d272082b56b09] - P [Univariate Data Series] [WS 3, part 2] [2009-10-18 13:40:11] [5c968c05ca472afa314d272082b56b09] - PD [Univariate Data Series] [WS3, part 2] [2009-10-18 13:50:42] [5c968c05ca472afa314d272082b56b09] - PD [Univariate Data Series] [Totale werklooshe...] [2009-10-18 13:50:42] [5c968c05ca472afa314d272082b56b09] - PD [Univariate Data Series] [Totale werklooshe...] [2009-10-18 13:50:42] [5c968c05ca472afa314d272082b56b09] - P [Univariate Data Series] [Totale werklooshe...] [2009-10-18 14:20:43] [5c968c05ca472afa314d272082b56b09] - RMP [Central Tendency] [Voorspelling voor...] [2009-10-18 14:30:03] [5c968c05ca472afa314d272082b56b09] - PD [Univariate Data Series] [Y[t]-X[t]=c+e[t]] [2009-10-18 14:49:48] [5c968c05ca472afa314d272082b56b09] - RM [Central Tendency] [Forecast] [2009-10-18 15:12:48] [5c968c05ca472afa314d272082b56b09] - RM [Percentiles] [Confidence interv...] [2009-10-18 15:22:43] [5c968c05ca472afa314d272082b56b09] - RM [Harrell-Davis Quantiles] [Confidence interv...] [2009-10-18 15:31:11] [5c968c05ca472afa314d272082b56b09] - PD [Univariate Data Series] [Y[t] / X[t]= c+e[t]] [2009-10-18 15:01:52] [5c968c05ca472afa314d272082b56b09] - PD [Univariate Data Series] [Werkloosheid vana...] [2009-10-11 19:32:57] [5c968c05ca472afa314d272082b56b09] - P [Univariate Data Series] [WS3, part 2] [2009-10-18 13:50:42] [5c968c05ca472afa314d272082b56b09] - RMPD [Bivariate Explorative Data Analysis] [WS4, Part2.1] [2009-10-27 19:09:25] [5c968c05ca472afa314d272082b56b09] - RMPD [Bivariate Kernel Density Estimation] [WS 4, Part2.1: Y[...] [2009-10-27 19:26:16] [5c968c05ca472afa314d272082b56b09] - RMPD [Bivariate Kernel Density Estimation] [WS4, Part2.2 Y[t]...] [2009-10-27 19:41:20] [5c968c05ca472afa314d272082b56b09] - RMPD [Bivariate Explorative Data Analysis] [WS4, Part 2.2 Y[...] [2009-10-27 19:47:30] [5c968c05ca472afa314d272082b56b09] - RMPD [Bivariate Explorative Data Analysis] [WS4, Part2.3 ln...] [2009-10-27 20:02:09] [5c968c05ca472afa314d272082b56b09] - RMPD [Bivariate Kernel Density Estimation] [WS4, Part2.3 ln...] [2009-10-27 20:05:12] [5c968c05ca472afa314d272082b56b09] - PD [Univariate Data Series] [Totale werklooshe...] [2009-10-11 19:47:28] [5c968c05ca472afa314d272082b56b09] - PD [Univariate Data Series] [Bouwvergunningen ...] [2009-10-11 20:54:46] [5c968c05ca472afa314d272082b56b09] - RMPD [Trivariate Scatterplots] [WS5, Trivariate s...] [2009-10-30 13:22:48] [5c968c05ca472afa314d272082b56b09] - RMPD [Partial Correlation] [WS5, Correlation ...] [2009-10-30 13:31:38] [5c968c05ca472afa314d272082b56b09] - RMPD [Bivariate Explorative Data Analysis] [WS5, Stap 1] [2009-10-30 14:01:17] [5c968c05ca472afa314d272082b56b09] - RMPD [Bivariate Explorative Data Analysis] [WS5, zuivering van Z] [2009-10-30 14:20:32] [5c968c05ca472afa314d272082b56b09] - M D [Bivariate Explorative Data Analysis] [Workshop 5 Bivari...] [2009-11-04 15:54:37] [f924a0adda9c1905a1ba8f1c751261ff] - RMPD [Bivariate Kernel Density Estimation] [WS5] [2009-10-30 14:38:33] [5c968c05ca472afa314d272082b56b09] - RMPD [Bivariate Explorative Data Analysis] [] [2009-11-05 18:10:16] [023d83ebdf42a2acf423907b4076e8a1] - PD [Univariate Data Series] [Bouwvergunningen ...] [2009-10-11 21:04:52] [5c968c05ca472afa314d272082b56b09] | |||||||||||||||||||||||||||||||||||||||||
| Feedback Forum | |||||||||||||||||||||||||||||||||||||||||
Post a new message | |||||||||||||||||||||||||||||||||||||||||
Dataset | |||||||||||||||||||||||||||||||||||||||||
| Dataseries X: | |||||||||||||||||||||||||||||||||||||||||
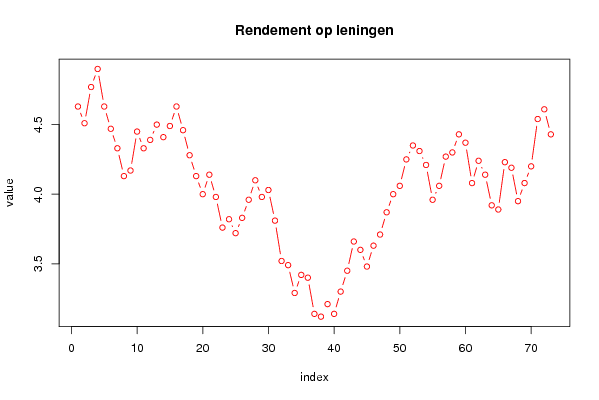
4,63 4,51 4,77 4,9 4,63 4,47 4,33 4,13 4,17 4,45 4,33 4,39 4,5 4,41 4,49 4,63 4,46 4,28 4,13 4 4,14 3,98 3,76 3,82 3,72 3,83 3,96 4,1 3,98 4,03 3,81 3,52 3,49 3,29 3,42 3,4 3,14 3,12 3,21 3,14 3,3 3,45 3,66 3,6 3,48 3,63 3,71 3,87 4 4,06 4,25 4,35 4,31 4,21 3,96 4,06 4,27 4,3 4,43 4,37 4,08 4,24 4,14 3,92 3,89 4,23 4,19 3,95 4,08 4,2 4,54 4,61 4,43 | |||||||||||||||||||||||||||||||||||||||||
Tables (Output of Computation) | |||||||||||||||||||||||||||||||||||||||||
| |||||||||||||||||||||||||||||||||||||||||
Figures (Output of Computation) | |||||||||||||||||||||||||||||||||||||||||
Input Parameters & R Code | |||||||||||||||||||||||||||||||||||||||||
| Parameters (Session): | |||||||||||||||||||||||||||||||||||||||||
| par1 = Rendementspercentage op leningen lopende over periode 6 jaar ; par2 = http://www.nbb.be/belgostat/F1223926136899.csv ; | |||||||||||||||||||||||||||||||||||||||||
| Parameters (R input): | |||||||||||||||||||||||||||||||||||||||||
| par1 = Rendementspercentage op leningen lopende over periode 6 jaar ; par2 = http://www.nbb.be/belgostat/F1223926136899.csv ; par3 = ; | |||||||||||||||||||||||||||||||||||||||||
| R code (references can be found in the software module): | |||||||||||||||||||||||||||||||||||||||||
bitmap(file='test1.png') | |||||||||||||||||||||||||||||||||||||||||