Free Statistics

of Irreproducible Research!

Author's title

Author*The author of this computation has been verified*
R Software Modulerwasp_arimabackwardselection.wasp
Title produced by softwareARIMA Backward Selection
Date of computationTue, 09 Dec 2008 07:24:45 -0700
Cite this page as followsStatistical Computations at FreeStatistics.org, Office for Research Development and Education, URL https://freestatistics.org/blog/index.php?v=date/2008/Dec/09/t1228833270aohbn4jldpb7eli.htm/, Retrieved Sat, 25 May 2024 11:09:30 +0000
Statistical Computations at FreeStatistics.org, Office for Research Development and Education, URL https://freestatistics.org/blog/index.php?pk=31464, Retrieved Sat, 25 May 2024 11:09:30 +0000
QR Codes:

Original text written by user:
IsPrivate?No (this computation is public)
User-defined keywords
Estimated Impact188
Family? (F = Feedback message, R = changed R code, M = changed R Module, P = changed Parameters, D = changed Data)
F     [Univariate Data Series] [Airline data] [2007-10-18 09:58:47] [42daae401fd3def69a25014f2252b4c2]
F RMPD  [Spectral Analysis] [airline data] [2008-12-02 12:35:12] [0e5eff269cdcaf8789c45b6ee36b0c3d]
F RMPD    [Cross Correlation Function] [airline data] [2008-12-02 13:18:05] [0e5eff269cdcaf8789c45b6ee36b0c3d]
- RMPD      [(Partial) Autocorrelation Function] [paper] [2008-12-02 14:51:55] [0e5eff269cdcaf8789c45b6ee36b0c3d]
-   P         [(Partial) Autocorrelation Function] [acf] [2008-12-09 12:58:07] [a4602103a5e123497aa555277d0e627b]
- RMPD            [ARIMA Backward Selection] [arma] [2008-12-09 14:24:45] [09074fbe368d26382bb94e5bb318a104] [Current]
Feedback Forum

Post a new message
Dataseries X:
1202454.6
1201423.4
1505916
1513377.6
1977605.3
1873829.6
1424049.1
1322740
1584825.5
1680460.3
1648573.7
3095468.7
1307982.9
1367588.9
1572718.3
1611602.9
1641196.4
1845262.4
1464237.6
1402385.7
2077099.8
1691129.6
1729012.7
3347792.1
1365087.7
1545460
1844355.1
1775549.8
1721779.2
2128726.1
1664319.9
1769471.4
1904578.4
1872042.3
1802181
3222199.4
1491414.2
1658519.2
2079206.9
1748767.4
2084447.4
2067181.6
1718122.8
1782337.1
1958118.4
2028681.3
2076128.1
3383873
1870369
1654852.9
2074338.3
1888653.7
1991137.8
2168237.9
1867424.1
1842359.6
1927476.3
2065555.4
2455608.5
3336170.9


Summary of computational transaction
Raw Inputview raw input (R code)
Raw Outputview raw output of R engine
Computing time9 seconds
R Server'Gwilym Jenkins' @ 72.249.127.135

\begin{tabular}{lllllllll}
\hline
Summary of computational transaction \tabularnewline
Raw Input & view raw input (R code)  \tabularnewline
Raw Output & view raw output of R engine  \tabularnewline
Computing time & 9 seconds \tabularnewline
R Server & 'Gwilym Jenkins' @ 72.249.127.135 \tabularnewline
\hline
\end{tabular}
%Source: https://freestatistics.org/blog/index.php?pk=31464&T=0

[TABLE]
[ROW][C]Summary of computational transaction[/C][/ROW]
[ROW][C]Raw Input[/C][C]view raw input (R code) [/C][/ROW]
[ROW][C]Raw Output[/C][C]view raw output of R engine [/C][/ROW]
[ROW][C]Computing time[/C][C]9 seconds[/C][/ROW]
[ROW][C]R Server[/C][C]'Gwilym Jenkins' @ 72.249.127.135[/C][/ROW]
[/TABLE]
Source: https://freestatistics.org/blog/index.php?pk=31464&T=0

Globally Unique Identifier (entire table): ba.freestatistics.org/blog/index.php?pk=31464&T=0

As an alternative you can also use a QR Code:  

The GUIDs for individual cells are displayed in the table below:

Summary of computational transaction
Raw Inputview raw input (R code)
Raw Outputview raw output of R engine
Computing time9 seconds
R Server'Gwilym Jenkins' @ 72.249.127.135


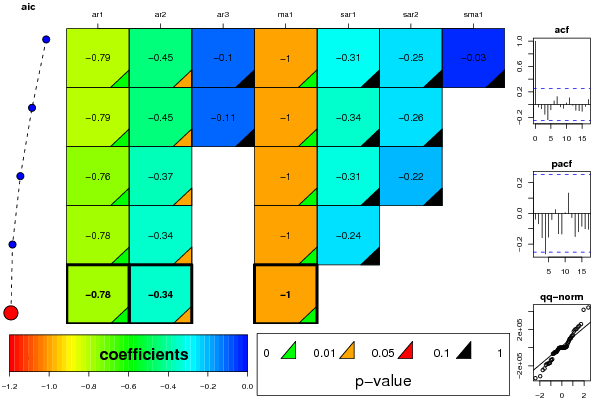
ARIMA Parameter Estimation and Backward Selection
Iterationar1ar2ar3ma1sar1sar2sma1
Estimates ( 1 )-0.7938-0.45-0.1037-0.9996-0.3071-0.2502-0.033
(p-val)(0 )(0.0287 )(0.5391 )(0 )(0.7568 )(0.3687 )(0.976 )
Estimates ( 2 )-0.7943-0.452-0.1052-0.9974-0.3385-0.2580
(p-val)(0 )(0.0281 )(0.5335 )(0 )(0.1013 )(0.2523 )(NA )
Estimates ( 3 )-0.7636-0.36550-1.0024-0.3128-0.21580
(p-val)(0 )(0.0162 )(NA )(0 )(0.119 )(0.3301 )(NA )
Estimates ( 4 )-0.7769-0.33980-1.0021-0.243400
(p-val)(0 )(0.0205 )(NA )(0 )(0.1721 )(NA )(NA )
Estimates ( 5 )-0.7846-0.33710-1.0017000
(p-val)(0 )(0.0203 )(NA )(0 )(NA )(NA )(NA )
Estimates ( 6 )NANANANANANANA
(p-val)(NA )(NA )(NA )(NA )(NA )(NA )(NA )
Estimates ( 7 )NANANANANANANA
(p-val)(NA )(NA )(NA )(NA )(NA )(NA )(NA )
Estimates ( 8 )NANANANANANANA
(p-val)(NA )(NA )(NA )(NA )(NA )(NA )(NA )
Estimates ( 9 )NANANANANANANA
(p-val)(NA )(NA )(NA )(NA )(NA )(NA )(NA )
Estimates ( 10 )NANANANANANANA
(p-val)(NA )(NA )(NA )(NA )(NA )(NA )(NA )
Estimates ( 11 )NANANANANANANA
(p-val)(NA )(NA )(NA )(NA )(NA )(NA )(NA )
Estimates ( 12 )NANANANANANANA
(p-val)(NA )(NA )(NA )(NA )(NA )(NA )(NA )
Estimates ( 13 )NANANANANANANA
(p-val)(NA )(NA )(NA )(NA )(NA )(NA )(NA )

\begin{tabular}{lllllllll}
\hline
ARIMA Parameter Estimation and Backward Selection \tabularnewline
Iteration & ar1 & ar2 & ar3 & ma1 & sar1 & sar2 & sma1 \tabularnewline
Estimates ( 1 ) & -0.7938 & -0.45 & -0.1037 & -0.9996 & -0.3071 & -0.2502 & -0.033 \tabularnewline
(p-val) & (0 ) & (0.0287 ) & (0.5391 ) & (0 ) & (0.7568 ) & (0.3687 ) & (0.976 ) \tabularnewline
Estimates ( 2 ) & -0.7943 & -0.452 & -0.1052 & -0.9974 & -0.3385 & -0.258 & 0 \tabularnewline
(p-val) & (0 ) & (0.0281 ) & (0.5335 ) & (0 ) & (0.1013 ) & (0.2523 ) & (NA ) \tabularnewline
Estimates ( 3 ) & -0.7636 & -0.3655 & 0 & -1.0024 & -0.3128 & -0.2158 & 0 \tabularnewline
(p-val) & (0 ) & (0.0162 ) & (NA ) & (0 ) & (0.119 ) & (0.3301 ) & (NA ) \tabularnewline
Estimates ( 4 ) & -0.7769 & -0.3398 & 0 & -1.0021 & -0.2434 & 0 & 0 \tabularnewline
(p-val) & (0 ) & (0.0205 ) & (NA ) & (0 ) & (0.1721 ) & (NA ) & (NA ) \tabularnewline
Estimates ( 5 ) & -0.7846 & -0.3371 & 0 & -1.0017 & 0 & 0 & 0 \tabularnewline
(p-val) & (0 ) & (0.0203 ) & (NA ) & (0 ) & (NA ) & (NA ) & (NA ) \tabularnewline
Estimates ( 6 ) & NA & NA & NA & NA & NA & NA & NA \tabularnewline
(p-val) & (NA ) & (NA ) & (NA ) & (NA ) & (NA ) & (NA ) & (NA ) \tabularnewline
Estimates ( 7 ) & NA & NA & NA & NA & NA & NA & NA \tabularnewline
(p-val) & (NA ) & (NA ) & (NA ) & (NA ) & (NA ) & (NA ) & (NA ) \tabularnewline
Estimates ( 8 ) & NA & NA & NA & NA & NA & NA & NA \tabularnewline
(p-val) & (NA ) & (NA ) & (NA ) & (NA ) & (NA ) & (NA ) & (NA ) \tabularnewline
Estimates ( 9 ) & NA & NA & NA & NA & NA & NA & NA \tabularnewline
(p-val) & (NA ) & (NA ) & (NA ) & (NA ) & (NA ) & (NA ) & (NA ) \tabularnewline
Estimates ( 10 ) & NA & NA & NA & NA & NA & NA & NA \tabularnewline
(p-val) & (NA ) & (NA ) & (NA ) & (NA ) & (NA ) & (NA ) & (NA ) \tabularnewline
Estimates ( 11 ) & NA & NA & NA & NA & NA & NA & NA \tabularnewline
(p-val) & (NA ) & (NA ) & (NA ) & (NA ) & (NA ) & (NA ) & (NA ) \tabularnewline
Estimates ( 12 ) & NA & NA & NA & NA & NA & NA & NA \tabularnewline
(p-val) & (NA ) & (NA ) & (NA ) & (NA ) & (NA ) & (NA ) & (NA ) \tabularnewline
Estimates ( 13 ) & NA & NA & NA & NA & NA & NA & NA \tabularnewline
(p-val) & (NA ) & (NA ) & (NA ) & (NA ) & (NA ) & (NA ) & (NA ) \tabularnewline
\hline
\end{tabular}
%Source: https://freestatistics.org/blog/index.php?pk=31464&T=1

[TABLE]
[ROW][C]ARIMA Parameter Estimation and Backward Selection[/C][/ROW]
[ROW][C]Iteration[/C][C]ar1[/C][C]ar2[/C][C]ar3[/C][C]ma1[/C][C]sar1[/C][C]sar2[/C][C]sma1[/C][/ROW]
[ROW][C]Estimates ( 1 )[/C][C]-0.7938[/C][C]-0.45[/C][C]-0.1037[/C][C]-0.9996[/C][C]-0.3071[/C][C]-0.2502[/C][C]-0.033[/C][/ROW]
[ROW][C](p-val)[/C][C](0 )[/C][C](0.0287 )[/C][C](0.5391 )[/C][C](0 )[/C][C](0.7568 )[/C][C](0.3687 )[/C][C](0.976 )[/C][/ROW]
[ROW][C]Estimates ( 2 )[/C][C]-0.7943[/C][C]-0.452[/C][C]-0.1052[/C][C]-0.9974[/C][C]-0.3385[/C][C]-0.258[/C][C]0[/C][/ROW]
[ROW][C](p-val)[/C][C](0 )[/C][C](0.0281 )[/C][C](0.5335 )[/C][C](0 )[/C][C](0.1013 )[/C][C](0.2523 )[/C][C](NA )[/C][/ROW]
[ROW][C]Estimates ( 3 )[/C][C]-0.7636[/C][C]-0.3655[/C][C]0[/C][C]-1.0024[/C][C]-0.3128[/C][C]-0.2158[/C][C]0[/C][/ROW]
[ROW][C](p-val)[/C][C](0 )[/C][C](0.0162 )[/C][C](NA )[/C][C](0 )[/C][C](0.119 )[/C][C](0.3301 )[/C][C](NA )[/C][/ROW]
[ROW][C]Estimates ( 4 )[/C][C]-0.7769[/C][C]-0.3398[/C][C]0[/C][C]-1.0021[/C][C]-0.2434[/C][C]0[/C][C]0[/C][/ROW]
[ROW][C](p-val)[/C][C](0 )[/C][C](0.0205 )[/C][C](NA )[/C][C](0 )[/C][C](0.1721 )[/C][C](NA )[/C][C](NA )[/C][/ROW]
[ROW][C]Estimates ( 5 )[/C][C]-0.7846[/C][C]-0.3371[/C][C]0[/C][C]-1.0017[/C][C]0[/C][C]0[/C][C]0[/C][/ROW]
[ROW][C](p-val)[/C][C](0 )[/C][C](0.0203 )[/C][C](NA )[/C][C](0 )[/C][C](NA )[/C][C](NA )[/C][C](NA )[/C][/ROW]
[ROW][C]Estimates ( 6 )[/C][C]NA[/C][C]NA[/C][C]NA[/C][C]NA[/C][C]NA[/C][C]NA[/C][C]NA[/C][/ROW]
[ROW][C](p-val)[/C][C](NA )[/C][C](NA )[/C][C](NA )[/C][C](NA )[/C][C](NA )[/C][C](NA )[/C][C](NA )[/C][/ROW]
[ROW][C]Estimates ( 7 )[/C][C]NA[/C][C]NA[/C][C]NA[/C][C]NA[/C][C]NA[/C][C]NA[/C][C]NA[/C][/ROW]
[ROW][C](p-val)[/C][C](NA )[/C][C](NA )[/C][C](NA )[/C][C](NA )[/C][C](NA )[/C][C](NA )[/C][C](NA )[/C][/ROW]
[ROW][C]Estimates ( 8 )[/C][C]NA[/C][C]NA[/C][C]NA[/C][C]NA[/C][C]NA[/C][C]NA[/C][C]NA[/C][/ROW]
[ROW][C](p-val)[/C][C](NA )[/C][C](NA )[/C][C](NA )[/C][C](NA )[/C][C](NA )[/C][C](NA )[/C][C](NA )[/C][/ROW]
[ROW][C]Estimates ( 9 )[/C][C]NA[/C][C]NA[/C][C]NA[/C][C]NA[/C][C]NA[/C][C]NA[/C][C]NA[/C][/ROW]
[ROW][C](p-val)[/C][C](NA )[/C][C](NA )[/C][C](NA )[/C][C](NA )[/C][C](NA )[/C][C](NA )[/C][C](NA )[/C][/ROW]
[ROW][C]Estimates ( 10 )[/C][C]NA[/C][C]NA[/C][C]NA[/C][C]NA[/C][C]NA[/C][C]NA[/C][C]NA[/C][/ROW]
[ROW][C](p-val)[/C][C](NA )[/C][C](NA )[/C][C](NA )[/C][C](NA )[/C][C](NA )[/C][C](NA )[/C][C](NA )[/C][/ROW]
[ROW][C]Estimates ( 11 )[/C][C]NA[/C][C]NA[/C][C]NA[/C][C]NA[/C][C]NA[/C][C]NA[/C][C]NA[/C][/ROW]
[ROW][C](p-val)[/C][C](NA )[/C][C](NA )[/C][C](NA )[/C][C](NA )[/C][C](NA )[/C][C](NA )[/C][C](NA )[/C][/ROW]
[ROW][C]Estimates ( 12 )[/C][C]NA[/C][C]NA[/C][C]NA[/C][C]NA[/C][C]NA[/C][C]NA[/C][C]NA[/C][/ROW]
[ROW][C](p-val)[/C][C](NA )[/C][C](NA )[/C][C](NA )[/C][C](NA )[/C][C](NA )[/C][C](NA )[/C][C](NA )[/C][/ROW]
[ROW][C]Estimates ( 13 )[/C][C]NA[/C][C]NA[/C][C]NA[/C][C]NA[/C][C]NA[/C][C]NA[/C][C]NA[/C][/ROW]
[ROW][C](p-val)[/C][C](NA )[/C][C](NA )[/C][C](NA )[/C][C](NA )[/C][C](NA )[/C][C](NA )[/C][C](NA )[/C][/ROW]
[/TABLE]
Source: https://freestatistics.org/blog/index.php?pk=31464&T=1

Globally Unique Identifier (entire table): ba.freestatistics.org/blog/index.php?pk=31464&T=1

As an alternative you can also use a QR Code:  

The GUIDs for individual cells are displayed in the table below:

ARIMA Parameter Estimation and Backward Selection
Iterationar1ar2ar3ma1sar1sar2sma1
Estimates ( 1 )-0.7938-0.45-0.1037-0.9996-0.3071-0.2502-0.033
(p-val)(0 )(0.0287 )(0.5391 )(0 )(0.7568 )(0.3687 )(0.976 )
Estimates ( 2 )-0.7943-0.452-0.1052-0.9974-0.3385-0.2580
(p-val)(0 )(0.0281 )(0.5335 )(0 )(0.1013 )(0.2523 )(NA )
Estimates ( 3 )-0.7636-0.36550-1.0024-0.3128-0.21580
(p-val)(0 )(0.0162 )(NA )(0 )(0.119 )(0.3301 )(NA )
Estimates ( 4 )-0.7769-0.33980-1.0021-0.243400
(p-val)(0 )(0.0205 )(NA )(0 )(0.1721 )(NA )(NA )
Estimates ( 5 )-0.7846-0.33710-1.0017000
(p-val)(0 )(0.0203 )(NA )(0 )(NA )(NA )(NA )
Estimates ( 6 )NANANANANANANA
(p-val)(NA )(NA )(NA )(NA )(NA )(NA )(NA )
Estimates ( 7 )NANANANANANANA
(p-val)(NA )(NA )(NA )(NA )(NA )(NA )(NA )
Estimates ( 8 )NANANANANANANA
(p-val)(NA )(NA )(NA )(NA )(NA )(NA )(NA )
Estimates ( 9 )NANANANANANANA
(p-val)(NA )(NA )(NA )(NA )(NA )(NA )(NA )
Estimates ( 10 )NANANANANANANA
(p-val)(NA )(NA )(NA )(NA )(NA )(NA )(NA )
Estimates ( 11 )NANANANANANANA
(p-val)(NA )(NA )(NA )(NA )(NA )(NA )(NA )
Estimates ( 12 )NANANANANANANA
(p-val)(NA )(NA )(NA )(NA )(NA )(NA )(NA )
Estimates ( 13 )NANANANANANANA
(p-val)(NA )(NA )(NA )(NA )(NA )(NA )(NA )


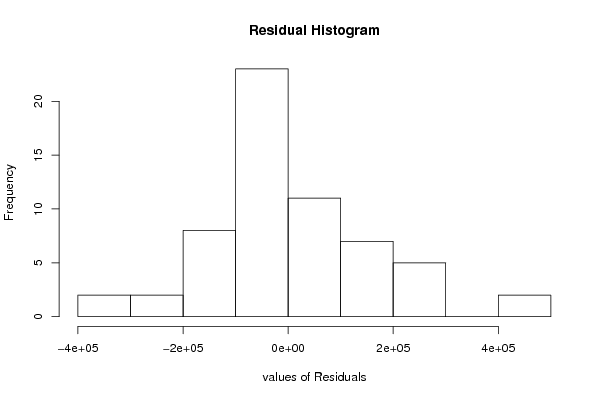
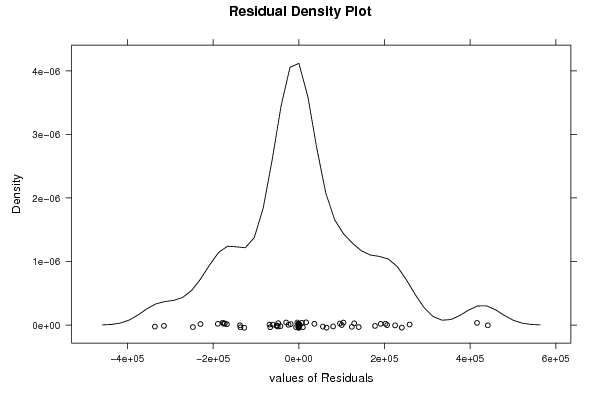
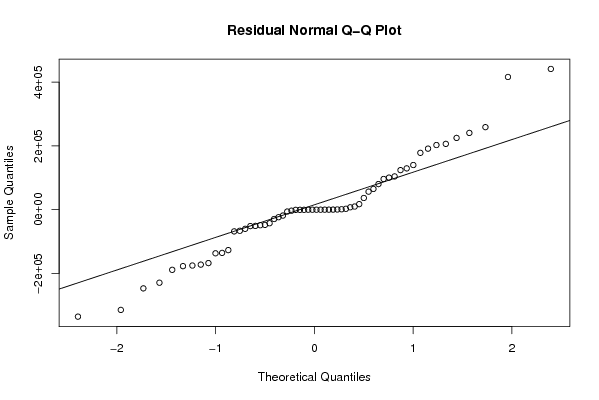
Estimated ARIMA Residuals
Value
7226.35049852734
-66549.6889083559
9572.92158609369
-314804.945354930
139877.317600935
258746.282634318
240620.86074112
441388.735170398
-177437.448799480
-167818.165806437
56362.3691881183
-48048.3325939166
36459.7658418108
96009.5655838019
-18727.0186828173
-247209.603115996
100373.815186476
80140.1878721974
202569.017681738
-335961.229137960
-42795.6712345957
-51153.7644558908
-135911.498409613
64887.9065477804
129375.546353777
224931.051025624
-172712.541056706
191261.076286675
-189017.991128981
-68354.724447937
-49019.9471908505
-51756.2561216455
123872.243021912
206275.136573589
-29516.1815780719
178082.781036239
-229431.172543027
-175574.129598594
-23866.9492137277
-60361.9737478819
17101.4971866578
104215.588774904
-6112.78904391443
-127136.179361933
2460.90804263428
416195.944443513
-137127.867796316

\begin{tabular}{lllllllll}
\hline
Estimated ARIMA Residuals \tabularnewline
Value \tabularnewline
7226.35049852734 \tabularnewline
-66549.6889083559 \tabularnewline
9572.92158609369 \tabularnewline
-314804.945354930 \tabularnewline
139877.317600935 \tabularnewline
258746.282634318 \tabularnewline
240620.86074112 \tabularnewline
441388.735170398 \tabularnewline
-177437.448799480 \tabularnewline
-167818.165806437 \tabularnewline
56362.3691881183 \tabularnewline
-48048.3325939166 \tabularnewline
36459.7658418108 \tabularnewline
96009.5655838019 \tabularnewline
-18727.0186828173 \tabularnewline
-247209.603115996 \tabularnewline
100373.815186476 \tabularnewline
80140.1878721974 \tabularnewline
202569.017681738 \tabularnewline
-335961.229137960 \tabularnewline
-42795.6712345957 \tabularnewline
-51153.7644558908 \tabularnewline
-135911.498409613 \tabularnewline
64887.9065477804 \tabularnewline
129375.546353777 \tabularnewline
224931.051025624 \tabularnewline
-172712.541056706 \tabularnewline
191261.076286675 \tabularnewline
-189017.991128981 \tabularnewline
-68354.724447937 \tabularnewline
-49019.9471908505 \tabularnewline
-51756.2561216455 \tabularnewline
123872.243021912 \tabularnewline
206275.136573589 \tabularnewline
-29516.1815780719 \tabularnewline
178082.781036239 \tabularnewline
-229431.172543027 \tabularnewline
-175574.129598594 \tabularnewline
-23866.9492137277 \tabularnewline
-60361.9737478819 \tabularnewline
17101.4971866578 \tabularnewline
104215.588774904 \tabularnewline
-6112.78904391443 \tabularnewline
-127136.179361933 \tabularnewline
2460.90804263428 \tabularnewline
416195.944443513 \tabularnewline
-137127.867796316 \tabularnewline
\hline
\end{tabular}
%Source: https://freestatistics.org/blog/index.php?pk=31464&T=2

[TABLE]
[ROW][C]Estimated ARIMA Residuals[/C][/ROW]
[ROW][C]Value[/C][/ROW]
[ROW][C]7226.35049852734[/C][/ROW]
[ROW][C]-66549.6889083559[/C][/ROW]
[ROW][C]9572.92158609369[/C][/ROW]
[ROW][C]-314804.945354930[/C][/ROW]
[ROW][C]139877.317600935[/C][/ROW]
[ROW][C]258746.282634318[/C][/ROW]
[ROW][C]240620.86074112[/C][/ROW]
[ROW][C]441388.735170398[/C][/ROW]
[ROW][C]-177437.448799480[/C][/ROW]
[ROW][C]-167818.165806437[/C][/ROW]
[ROW][C]56362.3691881183[/C][/ROW]
[ROW][C]-48048.3325939166[/C][/ROW]
[ROW][C]36459.7658418108[/C][/ROW]
[ROW][C]96009.5655838019[/C][/ROW]
[ROW][C]-18727.0186828173[/C][/ROW]
[ROW][C]-247209.603115996[/C][/ROW]
[ROW][C]100373.815186476[/C][/ROW]
[ROW][C]80140.1878721974[/C][/ROW]
[ROW][C]202569.017681738[/C][/ROW]
[ROW][C]-335961.229137960[/C][/ROW]
[ROW][C]-42795.6712345957[/C][/ROW]
[ROW][C]-51153.7644558908[/C][/ROW]
[ROW][C]-135911.498409613[/C][/ROW]
[ROW][C]64887.9065477804[/C][/ROW]
[ROW][C]129375.546353777[/C][/ROW]
[ROW][C]224931.051025624[/C][/ROW]
[ROW][C]-172712.541056706[/C][/ROW]
[ROW][C]191261.076286675[/C][/ROW]
[ROW][C]-189017.991128981[/C][/ROW]
[ROW][C]-68354.724447937[/C][/ROW]
[ROW][C]-49019.9471908505[/C][/ROW]
[ROW][C]-51756.2561216455[/C][/ROW]
[ROW][C]123872.243021912[/C][/ROW]
[ROW][C]206275.136573589[/C][/ROW]
[ROW][C]-29516.1815780719[/C][/ROW]
[ROW][C]178082.781036239[/C][/ROW]
[ROW][C]-229431.172543027[/C][/ROW]
[ROW][C]-175574.129598594[/C][/ROW]
[ROW][C]-23866.9492137277[/C][/ROW]
[ROW][C]-60361.9737478819[/C][/ROW]
[ROW][C]17101.4971866578[/C][/ROW]
[ROW][C]104215.588774904[/C][/ROW]
[ROW][C]-6112.78904391443[/C][/ROW]
[ROW][C]-127136.179361933[/C][/ROW]
[ROW][C]2460.90804263428[/C][/ROW]
[ROW][C]416195.944443513[/C][/ROW]
[ROW][C]-137127.867796316[/C][/ROW]
[/TABLE]
Source: https://freestatistics.org/blog/index.php?pk=31464&T=2

Globally Unique Identifier (entire table): ba.freestatistics.org/blog/index.php?pk=31464&T=2

As an alternative you can also use a QR Code:  

The GUIDs for individual cells are displayed in the table below:

Estimated ARIMA Residuals
Value
7226.35049852734
-66549.6889083559
9572.92158609369
-314804.945354930
139877.317600935
258746.282634318
240620.86074112
441388.735170398
-177437.448799480
-167818.165806437
56362.3691881183
-48048.3325939166
36459.7658418108
96009.5655838019
-18727.0186828173
-247209.603115996
100373.815186476
80140.1878721974
202569.017681738
-335961.229137960
-42795.6712345957
-51153.7644558908
-135911.498409613
64887.9065477804
129375.546353777
224931.051025624
-172712.541056706
191261.076286675
-189017.991128981
-68354.724447937
-49019.9471908505
-51756.2561216455
123872.243021912
206275.136573589
-29516.1815780719
178082.781036239
-229431.172543027
-175574.129598594
-23866.9492137277
-60361.9737478819
17101.4971866578
104215.588774904
-6112.78904391443
-127136.179361933
2460.90804263428
416195.944443513
-137127.867796316


Parameters (Session):
par1 = 12 ;
Parameters (R input):
par1 = FALSE ; par2 = 1 ; par3 = 2 ; par4 = 1 ; par5 = 12 ; par6 = 3 ; par7 = 1 ; par8 = 2 ; par9 = 1 ;
R code (references can be found in the software module):
library(lattice)
if (par1 == 'TRUE') par1 <- TRUE
if (par1 == 'FALSE') par1 <- FALSE
par2 <- as.numeric(par2) #Box-Cox lambda transformation parameter
par3 <- as.numeric(par3) #degree of non-seasonal differencing
par4 <- as.numeric(par4) #degree of seasonal differencing
par5 <- as.numeric(par5) #seasonal period
par6 <- as.numeric(par6) #degree (p) of the non-seasonal AR(p) polynomial
par7 <- as.numeric(par7) #degree (q) of the non-seasonal MA(q) polynomial
par8 <- as.numeric(par8) #degree (P) of the seasonal AR(P) polynomial
par9 <- as.numeric(par9) #degree (Q) of the seasonal MA(Q) polynomial
armaGR <- function(arima.out, names, n){
try1 <- arima.out$coef
try2 <- sqrt(diag(arima.out$var.coef))
try.data.frame <- data.frame(matrix(NA,ncol=4,nrow=length(names)))
dimnames(try.data.frame) <- list(names,c('coef','std','tstat','pv'))
try.data.frame[,1] <- try1
for(i in 1:length(try2)) try.data.frame[which(rownames(try.data.frame)==names(try2)[i]),2] <- try2[i]
try.data.frame[,3] <- try.data.frame[,1] / try.data.frame[,2]
try.data.frame[,4] <- round((1-pt(abs(try.data.frame[,3]),df=n-(length(try2)+1)))*2,5)
vector <- rep(NA,length(names))
vector[is.na(try.data.frame[,4])] <- 0
maxi <- which.max(try.data.frame[,4])
continue <- max(try.data.frame[,4],na.rm=TRUE) > .05
vector[maxi] <- 0
list(summary=try.data.frame,next.vector=vector,continue=continue)
}
arimaSelect <- function(series, order=c(13,0,0), seasonal=list(order=c(2,0,0),period=12), include.mean=F){
nrc <- order[1]+order[3]+seasonal$order[1]+seasonal$order[3]
coeff <- matrix(NA, nrow=nrc*2, ncol=nrc)
pval <- matrix(NA, nrow=nrc*2, ncol=nrc)
mylist <- rep(list(NULL), nrc)
names <- NULL
if(order[1] > 0) names <- paste('ar',1:order[1],sep='')
if(order[3] > 0) names <- c( names , paste('ma',1:order[3],sep='') )
if(seasonal$order[1] > 0) names <- c(names, paste('sar',1:seasonal$order[1],sep=''))
if(seasonal$order[3] > 0) names <- c(names, paste('sma',1:seasonal$order[3],sep=''))
arima.out <- arima(series, order=order, seasonal=seasonal, include.mean=include.mean, method='ML')
mylist[[1]] <- arima.out
last.arma <- armaGR(arima.out, names, length(series))
mystop <- FALSE
i <- 1
coeff[i,] <- last.arma[[1]][,1]
pval [i,] <- last.arma[[1]][,4]
i <- 2
aic <- arima.out$aic
while(!mystop){
mylist[[i]] <- arima.out
arima.out <- arima(series, order=order, seasonal=seasonal, include.mean=include.mean, method='ML', fixed=last.arma$next.vector)
aic <- c(aic, arima.out$aic)
last.arma <- armaGR(arima.out, names, length(series))
mystop <- !last.arma$continue
coeff[i,] <- last.arma[[1]][,1]
pval [i,] <- last.arma[[1]][,4]
i <- i+1
}
list(coeff, pval, mylist, aic=aic)
}
arimaSelectplot <- function(arimaSelect.out,noms,choix){
noms <- names(arimaSelect.out[[3]][[1]]$coef)
coeff <- arimaSelect.out[[1]]
k <- min(which(is.na(coeff[,1])))-1
coeff <- coeff[1:k,]
pval <- arimaSelect.out[[2]][1:k,]
aic <- arimaSelect.out$aic[1:k]
coeff[coeff==0] <- NA
n <- ncol(coeff)
if(missing(choix)) choix <- k
layout(matrix(c(1,1,1,2,
3,3,3,2,
3,3,3,4,
5,6,7,7),nr=4),
widths=c(10,35,45,15),
heights=c(30,30,15,15))
couleurs <- rainbow(75)[1:50]#(50)
ticks <- pretty(coeff)
par(mar=c(1,1,3,1))
plot(aic,k:1-.5,type='o',pch=21,bg='blue',cex=2,axes=F,lty=2,xpd=NA)
points(aic[choix],k-choix+.5,pch=21,cex=4,bg=2,xpd=NA)
title('aic',line=2)
par(mar=c(3,0,0,0))
plot(0,axes=F,xlab='',ylab='',xlim=range(ticks),ylim=c(.1,1))
rect(xleft = min(ticks) + (0:49)/50*(max(ticks)-min(ticks)),
xright = min(ticks) + (1:50)/50*(max(ticks)-min(ticks)),
ytop = rep(1,50),
ybottom= rep(0,50),col=couleurs,border=NA)
axis(1,ticks)
rect(xleft=min(ticks),xright=max(ticks),ytop=1,ybottom=0)
text(mean(coeff,na.rm=T),.5,'coefficients',cex=2,font=2)
par(mar=c(1,1,3,1))
image(1:n,1:k,t(coeff[k:1,]),axes=F,col=couleurs,zlim=range(ticks))
for(i in 1:n) for(j in 1:k) if(!is.na(coeff[j,i])) {
if(pval[j,i]<.01) symb = 'green'
else if( (pval[j,i]<.05) & (pval[j,i]>=.01)) symb = 'orange'
else if( (pval[j,i]<.1) & (pval[j,i]>=.05)) symb = 'red'
else symb = 'black'
polygon(c(i+.5 ,i+.2 ,i+.5 ,i+.5),
c(k-j+0.5,k-j+0.5,k-j+0.8,k-j+0.5),
col=symb)
if(j==choix) {
rect(xleft=i-.5,
xright=i+.5,
ybottom=k-j+1.5,
ytop=k-j+.5,
lwd=4)
text(i,
k-j+1,
round(coeff[j,i],2),
cex=1.2,
font=2)
}
else{
rect(xleft=i-.5,xright=i+.5,ybottom=k-j+1.5,ytop=k-j+.5)
text(i,k-j+1,round(coeff[j,i],2),cex=1.2,font=1)
}
}
axis(3,1:n,noms)
par(mar=c(0.5,0,0,0.5))
plot(0,axes=F,xlab='',ylab='',type='n',xlim=c(0,8),ylim=c(-.2,.8))
cols <- c('green','orange','red','black')
niv <- c('0','0.01','0.05','0.1')
for(i in 0:3){
polygon(c(1+2*i ,1+2*i ,1+2*i-.5 ,1+2*i),
c(.4 ,.7 , .4 , .4),
col=cols[i+1])
text(2*i,0.5,niv[i+1],cex=1.5)
}
text(8,.5,1,cex=1.5)
text(4,0,'p-value',cex=2)
box()
residus <- arimaSelect.out[[3]][[choix]]$res
par(mar=c(1,2,4,1))
acf(residus,main='')
title('acf',line=.5)
par(mar=c(1,2,4,1))
pacf(residus,main='')
title('pacf',line=.5)
par(mar=c(2,2,4,1))
qqnorm(residus,main='')
title('qq-norm',line=.5)
qqline(residus)
residus
}
if (par2 == 0) x <- log(x)
if (par2 != 0) x <- x^par2
(selection <- arimaSelect(x, order=c(par6,par3,par7), seasonal=list(order=c(par8,par4,par9), period=par5)))
bitmap(file='test1.png')
resid <- arimaSelectplot(selection)
dev.off()
resid
bitmap(file='test2.png')
acf(resid,length(resid)/2, main='Residual Autocorrelation Function')
dev.off()
bitmap(file='test3.png')
pacf(resid,length(resid)/2, main='Residual Partial Autocorrelation Function')
dev.off()
bitmap(file='test4.png')
cpgram(resid, main='Residual Cumulative Periodogram')
dev.off()
bitmap(file='test5.png')
hist(resid, main='Residual Histogram', xlab='values of Residuals')
dev.off()
bitmap(file='test6.png')
densityplot(~resid,col='black',main='Residual Density Plot', xlab='values of Residuals')
dev.off()
bitmap(file='test7.png')
qqnorm(resid, main='Residual Normal Q-Q Plot')
qqline(resid)
dev.off()
ncols <- length(selection[[1]][1,])
nrows <- length(selection[[2]][,1])-1
load(file='createtable')
a<-table.start()
a<-table.row.start(a)
a<-table.element(a,'ARIMA Parameter Estimation and Backward Selection', ncols+1,TRUE)
a<-table.row.end(a)
a<-table.row.start(a)
a<-table.element(a,'Iteration', header=TRUE)
for (i in 1:ncols) {
a<-table.element(a,names(selection[[3]][[1]]$coef)[i],header=TRUE)
}
a<-table.row.end(a)
for (j in 1:nrows) {
a<-table.row.start(a)
mydum <- 'Estimates ('
mydum <- paste(mydum,j)
mydum <- paste(mydum,')')
a<-table.element(a,mydum, header=TRUE)
for (i in 1:ncols) {
a<-table.element(a,round(selection[[1]][j,i],4))
}
a<-table.row.end(a)
a<-table.row.start(a)
a<-table.element(a,'(p-val)', header=TRUE)
for (i in 1:ncols) {
mydum <- '('
mydum <- paste(mydum,round(selection[[2]][j,i],4),sep='')
mydum <- paste(mydum,')')
a<-table.element(a,mydum)
}
a<-table.row.end(a)
}
a<-table.end(a)
table.save(a,file='mytable.tab')
a<-table.start()
a<-table.row.start(a)
a<-table.element(a,'Estimated ARIMA Residuals', 1,TRUE)
a<-table.row.end(a)
a<-table.row.start(a)
a<-table.element(a,'Value', 1,TRUE)
a<-table.row.end(a)
for (i in (par4*par5+par3):length(resid)) {
a<-table.row.start(a)
a<-table.element(a,resid[i])
a<-table.row.end(a)
}
a<-table.end(a)
table.save(a,file='mytable1.tab')