Free Statistics

of Irreproducible Research!

Author's title

Author*The author of this computation has been verified*
R Software Modulerwasp_smp.wasp
Title produced by softwareStandard Deviation-Mean Plot
Date of computationFri, 23 Dec 2016 11:11:12 +0100
Cite this page as followsStatistical Computations at FreeStatistics.org, Office for Research Development and Education, URL https://freestatistics.org/blog/index.php?v=date/2016/Dec/23/t1482487896qsmj2dq8tl4k3k0.htm/, Retrieved Fri, 17 May 2024 19:11:28 +0000
Statistical Computations at FreeStatistics.org, Office for Research Development and Education, URL https://freestatistics.org/blog/index.php?pk=302831, Retrieved Fri, 17 May 2024 19:11:28 +0000
QR Codes:

Original text written by user:
IsPrivate?No (this computation is public)
User-defined keywords
Estimated Impact78
Family? (F = Feedback message, R = changed R code, M = changed R Module, P = changed Parameters, D = changed Data)
-       [Standard Deviation-Mean Plot] [standard deviatio...] [2016-12-23 10:11:12] [bd7223969ac5b08f41438741a34686d6] [Current]
Feedback Forum

Post a new message
Dataseries X:
1785
2040
2060
1825
1910
1710
1925
2025
1955
1940
1925
1870
1745
1800
1795
1760
1815
1910
1785
1955
1930
1850
1735
1785
1775
1875
2040
1705
1985
1850
1885
1670
2260
2350
1815
1850
2340
2245
2315
2455
2170
1825
2095
2070
2110
2245
1850
1770
1845
1910
1815
1770
1750
1635
1560
1785
1745
1735
1690
1600
1420
1480
1615
1585
1510
1540
1205
1485
1350
1210
1350
1235
1080
1200
1230
1205
1170
1095
1100
1490
1130
1125
1260
1320
1370
1220
1395
1540
1455
1310
1375
1645
1305
1680
1155
1245
1545
1375
1810
2110
1965
2435
2600
2270
2250
2840
1960
2340
2430
2390
2380
3090
3100
3040
3295
2665
4350
3470
3285
3610
3310
3850
3880
3670
4015
5180


Summary of computational transaction
Raw Input view raw input (R code)
Raw Outputview raw output of R engine
Computing time1 seconds
R ServerBig Analytics Cloud Computing Center

\begin{tabular}{lllllllll}
\hline
Summary of computational transaction \tabularnewline
Raw Input view raw input (R code)  \tabularnewline
Raw Outputview raw output of R engine  \tabularnewline
Computing time1 seconds \tabularnewline
R ServerBig Analytics Cloud Computing Center \tabularnewline
\hline
\end{tabular}
%Source: https://freestatistics.org/blog/index.php?pk=302831&T=0

[TABLE]
[ROW]
Summary of computational transaction[/C][/ROW] [ROW]Raw Input[/C] view raw input (R code) [/C][/ROW] [ROW]Raw Output[/C]view raw output of R engine [/C][/ROW] [ROW]Computing time[/C]1 seconds[/C][/ROW] [ROW]R Server[/C]Big Analytics Cloud Computing Center[/C][/ROW] [/TABLE] Source: https://freestatistics.org/blog/index.php?pk=302831&T=0

Globally Unique Identifier (entire table): ba.freestatistics.org/blog/index.php?pk=302831&T=0

As an alternative you can also use a QR Code:  

The GUIDs for individual cells are displayed in the table below:

Summary of computational transaction
Raw Input view raw input (R code)
Raw Outputview raw output of R engine
Computing time1 seconds
R ServerBig Analytics Cloud Computing Center


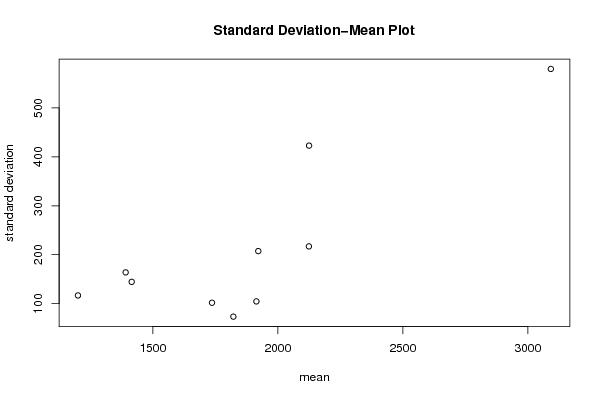
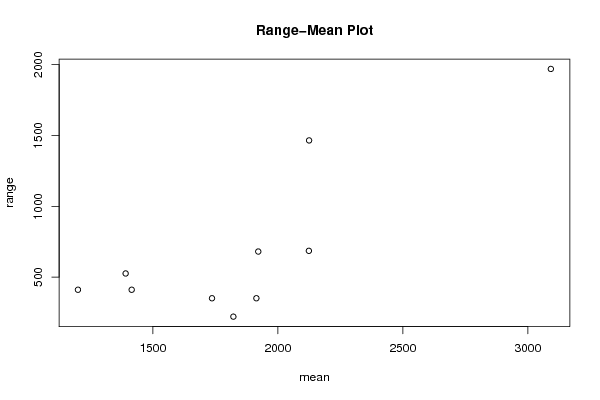
Standard Deviation-Mean Plot
SectionMeanStandard DeviationRange
11914.16666666667104.551712592672350
21822.0833333333373.3750742088314220
31921.66666666667207.346145955077680
42124.16666666667216.971231160989685
51736.66666666667101.8093881484350
61415.41666666667144.496906750996410
71200.41666666667116.725364021967410
81391.25163.833687844495525
92125422.8689889530581465
103092.08333333333579.6019728828541970

\begin{tabular}{lllllllll}
\hline
Standard Deviation-Mean Plot \tabularnewline
Section & Mean & Standard Deviation & Range \tabularnewline
1 & 1914.16666666667 & 104.551712592672 & 350 \tabularnewline
2 & 1822.08333333333 & 73.3750742088314 & 220 \tabularnewline
3 & 1921.66666666667 & 207.346145955077 & 680 \tabularnewline
4 & 2124.16666666667 & 216.971231160989 & 685 \tabularnewline
5 & 1736.66666666667 & 101.8093881484 & 350 \tabularnewline
6 & 1415.41666666667 & 144.496906750996 & 410 \tabularnewline
7 & 1200.41666666667 & 116.725364021967 & 410 \tabularnewline
8 & 1391.25 & 163.833687844495 & 525 \tabularnewline
9 & 2125 & 422.868988953058 & 1465 \tabularnewline
10 & 3092.08333333333 & 579.601972882854 & 1970 \tabularnewline
\hline
\end{tabular}
%Source: https://freestatistics.org/blog/index.php?pk=302831&T=1

[TABLE]
[ROW][C]Standard Deviation-Mean Plot[/C][/ROW]
[ROW][C]Section[/C][C]Mean[/C][C]Standard Deviation[/C][C]Range[/C][/ROW]
[ROW][C]1[/C][C]1914.16666666667[/C][C]104.551712592672[/C][C]350[/C][/ROW]
[ROW][C]2[/C][C]1822.08333333333[/C][C]73.3750742088314[/C][C]220[/C][/ROW]
[ROW][C]3[/C][C]1921.66666666667[/C][C]207.346145955077[/C][C]680[/C][/ROW]
[ROW][C]4[/C][C]2124.16666666667[/C][C]216.971231160989[/C][C]685[/C][/ROW]
[ROW][C]5[/C][C]1736.66666666667[/C][C]101.8093881484[/C][C]350[/C][/ROW]
[ROW][C]6[/C][C]1415.41666666667[/C][C]144.496906750996[/C][C]410[/C][/ROW]
[ROW][C]7[/C][C]1200.41666666667[/C][C]116.725364021967[/C][C]410[/C][/ROW]
[ROW][C]8[/C][C]1391.25[/C][C]163.833687844495[/C][C]525[/C][/ROW]
[ROW][C]9[/C][C]2125[/C][C]422.868988953058[/C][C]1465[/C][/ROW]
[ROW][C]10[/C][C]3092.08333333333[/C][C]579.601972882854[/C][C]1970[/C][/ROW]
[/TABLE]
Source: https://freestatistics.org/blog/index.php?pk=302831&T=1

Globally Unique Identifier (entire table): ba.freestatistics.org/blog/index.php?pk=302831&T=1

As an alternative you can also use a QR Code:  

The GUIDs for individual cells are displayed in the table below:

Standard Deviation-Mean Plot
SectionMeanStandard DeviationRange
11914.16666666667104.551712592672350
21822.0833333333373.3750742088314220
31921.66666666667207.346145955077680
42124.16666666667216.971231160989685
51736.66666666667101.8093881484350
61415.41666666667144.496906750996410
71200.41666666667116.725364021967410
81391.25163.833687844495525
92125422.8689889530581465
103092.08333333333579.6019728828541970


Regression: S.E.(k) = alpha + beta * Mean(k)
alpha-259.235305501025
beta0.252038335950715
S.D.0.0619204574255347
T-STAT4.07035649330943
p-value0.00358165195703497

\begin{tabular}{lllllllll}
\hline
Regression: S.E.(k) = alpha + beta * Mean(k) \tabularnewline
alpha & -259.235305501025 \tabularnewline
beta & 0.252038335950715 \tabularnewline
S.D. & 0.0619204574255347 \tabularnewline
T-STAT & 4.07035649330943 \tabularnewline
p-value & 0.00358165195703497 \tabularnewline
\hline
\end{tabular}
%Source: https://freestatistics.org/blog/index.php?pk=302831&T=2

[TABLE]
[ROW][C]Regression: S.E.(k) = alpha + beta * Mean(k)[/C][/ROW]
[ROW][C]alpha[/C][C]-259.235305501025[/C][/ROW]
[ROW][C]beta[/C][C]0.252038335950715[/C][/ROW]
[ROW][C]S.D.[/C][C]0.0619204574255347[/C][/ROW]
[ROW][C]T-STAT[/C][C]4.07035649330943[/C][/ROW]
[ROW][C]p-value[/C][C]0.00358165195703497[/C][/ROW]
[/TABLE]
Source: https://freestatistics.org/blog/index.php?pk=302831&T=2

Globally Unique Identifier (entire table): ba.freestatistics.org/blog/index.php?pk=302831&T=2

As an alternative you can also use a QR Code:  

The GUIDs for individual cells are displayed in the table below:

Regression: S.E.(k) = alpha + beta * Mean(k)
alpha-259.235305501025
beta0.252038335950715
S.D.0.0619204574255347
T-STAT4.07035649330943
p-value0.00358165195703497


Regression: ln S.E.(k) = alpha + beta * ln Mean(k)
alpha-7.01870599490842
beta1.62220085830056
S.D.0.639223176401995
T-STAT2.53776915197516
p-value0.034831537525716
Lambda-0.62220085830056

\begin{tabular}{lllllllll}
\hline
Regression: ln S.E.(k) = alpha + beta * ln Mean(k) \tabularnewline
alpha & -7.01870599490842 \tabularnewline
beta & 1.62220085830056 \tabularnewline
S.D. & 0.639223176401995 \tabularnewline
T-STAT & 2.53776915197516 \tabularnewline
p-value & 0.034831537525716 \tabularnewline
Lambda & -0.62220085830056 \tabularnewline
\hline
\end{tabular}
%Source: https://freestatistics.org/blog/index.php?pk=302831&T=3

[TABLE]
[ROW][C]Regression: ln S.E.(k) = alpha + beta * ln Mean(k)[/C][/ROW]
[ROW][C]alpha[/C][C]-7.01870599490842[/C][/ROW]
[ROW][C]beta[/C][C]1.62220085830056[/C][/ROW]
[ROW][C]S.D.[/C][C]0.639223176401995[/C][/ROW]
[ROW][C]T-STAT[/C][C]2.53776915197516[/C][/ROW]
[ROW][C]p-value[/C][C]0.034831537525716[/C][/ROW]
[ROW][C]Lambda[/C][C]-0.62220085830056[/C][/ROW]
[/TABLE]
Source: https://freestatistics.org/blog/index.php?pk=302831&T=3

Globally Unique Identifier (entire table): ba.freestatistics.org/blog/index.php?pk=302831&T=3

As an alternative you can also use a QR Code:  

The GUIDs for individual cells are displayed in the table below:

Regression: ln S.E.(k) = alpha + beta * ln Mean(k)
alpha-7.01870599490842
beta1.62220085830056
S.D.0.639223176401995
T-STAT2.53776915197516
p-value0.034831537525716
Lambda-0.62220085830056


Parameters (Session):
par1 = 12 ;
Parameters (R input):
par1 = 12 ;
R code (references can be found in the software module):
par1 <- '12'
par1 <- as.numeric(par1)
(n <- length(x))
(np <- floor(n / par1))
arr <- array(NA,dim=c(par1,np))
j <- 0
k <- 1
for (i in 1:(np*par1))
{
j = j + 1
arr[j,k] <- x[i]
if (j == par1) {
j = 0
k=k+1
}
}
arr
arr.mean <- array(NA,dim=np)
arr.sd <- array(NA,dim=np)
arr.range <- array(NA,dim=np)
for (j in 1:np)
{
arr.mean[j] <- mean(arr[,j],na.rm=TRUE)
arr.sd[j] <- sd(arr[,j],na.rm=TRUE)
arr.range[j] <- max(arr[,j],na.rm=TRUE) - min(arr[,j],na.rm=TRUE)
}
arr.mean
arr.sd
arr.range
(lm1 <- lm(arr.sd~arr.mean))
(lnlm1 <- lm(log(arr.sd)~log(arr.mean)))
(lm2 <- lm(arr.range~arr.mean))
bitmap(file='test1.png')
plot(arr.mean,arr.sd,main='Standard Deviation-Mean Plot',xlab='mean',ylab='standard deviation')
dev.off()
bitmap(file='test2.png')
plot(arr.mean,arr.range,main='Range-Mean Plot',xlab='mean',ylab='range')
dev.off()
load(file='createtable')
a<-table.start()
a<-table.row.start(a)
a<-table.element(a,'Standard Deviation-Mean Plot',4,TRUE)
a<-table.row.end(a)
a<-table.row.start(a)
a<-table.element(a,'Section',header=TRUE)
a<-table.element(a,'Mean',header=TRUE)
a<-table.element(a,'Standard Deviation',header=TRUE)
a<-table.element(a,'Range',header=TRUE)
a<-table.row.end(a)
for (j in 1:np) {
a<-table.row.start(a)
a<-table.element(a,j,header=TRUE)
a<-table.element(a,arr.mean[j])
a<-table.element(a,arr.sd[j] )
a<-table.element(a,arr.range[j] )
a<-table.row.end(a)
}
a<-table.end(a)
table.save(a,file='mytable.tab')
a<-table.start()
a<-table.row.start(a)
a<-table.element(a,'Regression: S.E.(k) = alpha + beta * Mean(k)',2,TRUE)
a<-table.row.end(a)
a<-table.row.start(a)
a<-table.element(a,'alpha',header=TRUE)
a<-table.element(a,lm1$coefficients[[1]])
a<-table.row.end(a)
a<-table.row.start(a)
a<-table.element(a,'beta',header=TRUE)
a<-table.element(a,lm1$coefficients[[2]])
a<-table.row.end(a)
a<-table.row.start(a)
a<-table.element(a,'S.D.',header=TRUE)
a<-table.element(a,summary(lm1)$coefficients[2,2])
a<-table.row.end(a)
a<-table.row.start(a)
a<-table.element(a,'T-STAT',header=TRUE)
a<-table.element(a,summary(lm1)$coefficients[2,3])
a<-table.row.end(a)
a<-table.row.start(a)
a<-table.element(a,'p-value',header=TRUE)
a<-table.element(a,summary(lm1)$coefficients[2,4])
a<-table.row.end(a)
a<-table.end(a)
table.save(a,file='mytable1.tab')
a<-table.start()
a<-table.row.start(a)
a<-table.element(a,'Regression: ln S.E.(k) = alpha + beta * ln Mean(k)',2,TRUE)
a<-table.row.end(a)
a<-table.row.start(a)
a<-table.element(a,'alpha',header=TRUE)
a<-table.element(a,lnlm1$coefficients[[1]])
a<-table.row.end(a)
a<-table.row.start(a)
a<-table.element(a,'beta',header=TRUE)
a<-table.element(a,lnlm1$coefficients[[2]])
a<-table.row.end(a)
a<-table.row.start(a)
a<-table.element(a,'S.D.',header=TRUE)
a<-table.element(a,summary(lnlm1)$coefficients[2,2])
a<-table.row.end(a)
a<-table.row.start(a)
a<-table.element(a,'T-STAT',header=TRUE)
a<-table.element(a,summary(lnlm1)$coefficients[2,3])
a<-table.row.end(a)
a<-table.row.start(a)
a<-table.element(a,'p-value',header=TRUE)
a<-table.element(a,summary(lnlm1)$coefficients[2,4])
a<-table.row.end(a)
a<-table.row.start(a)
a<-table.element(a,'Lambda',header=TRUE)
a<-table.element(a,1-lnlm1$coefficients[[2]])
a<-table.row.end(a)
a<-table.end(a)
table.save(a,file='mytable2.tab')