Free Statistics

of Irreproducible Research!

Author's title

Author*The author of this computation has been verified*
R Software Modulerwasp_autocorrelation.wasp
Title produced by software(Partial) Autocorrelation Function
Date of computationWed, 21 Dec 2016 18:44:06 +0100
Cite this page as followsStatistical Computations at FreeStatistics.org, Office for Research Development and Education, URL https://freestatistics.org/blog/index.php?v=date/2016/Dec/21/t1482342372xvrinn4dngbqtes.htm/, Retrieved Fri, 17 May 2024 01:02:04 +0000
Statistical Computations at FreeStatistics.org, Office for Research Development and Education, URL https://freestatistics.org/blog/index.php?pk=302444, Retrieved Fri, 17 May 2024 01:02:04 +0000
QR Codes:

Original text written by user:
IsPrivate?No (this computation is public)
User-defined keywords
Estimated Impact64
Family? (F = Feedback message, R = changed R code, M = changed R Module, P = changed Parameters, D = changed Data)
-     [Univariate Data Series] [Plot & Describe D...] [2016-12-21 13:39:57] [a4b9e35ec68b77b903de481d98cdbf80]
- RMP     [(Partial) Autocorrelation Function] [Autocorrelation F...] [2016-12-21 17:44:06] [dc40abf8f837a2863894b5e0c13dd016] [Current]
Feedback Forum

Post a new message
Dataseries X:
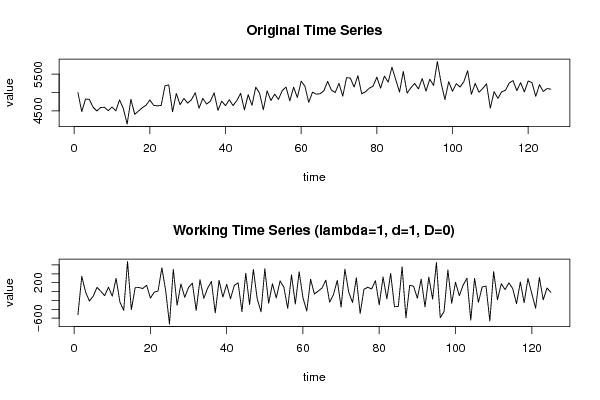
4998
4480
4824
4814
4602
4499
4594
4600
4507
4606
4503
4801
4564
4142
4818
4408
4496
4587
4656
4799
4652
4638
4650
5185
5208
4477
4976
4670
4842
4713
4804
4996
4574
4841
4688
4766
4994
4514
4766
4642
4806
4645
4784
4979
4530
4942
4651
5150
4987
4532
5046
4783
4958
4815
5055
5152
4773
5147
4866
5311
5172
4734
5011
4957
4968
5049
5305
5067
5001
5252
4903
5408
5395
5150
5460
4968
5021
5118
5175
5420
5121
5450
5286
5693
5353
5017
5577
4987
5129
5249
5100
5382
5039
5364
5193
5846
5259
4809
5297
5034
5243
5150
5296
5596
4954
5250
5009
5113
5237
4575
5026
4842
5019
5063
5261
5327
5054
5269
5019
5315
5274
4899
5216
5029
5110
5093


Summary of computational transaction
Raw Input view raw input (R code)
Raw Outputview raw output of R engine
Computing time1 seconds
R ServerBig Analytics Cloud Computing Center

\begin{tabular}{lllllllll}
\hline
Summary of computational transaction \tabularnewline
Raw Input view raw input (R code)  \tabularnewline
Raw Outputview raw output of R engine  \tabularnewline
Computing time1 seconds \tabularnewline
R ServerBig Analytics Cloud Computing Center \tabularnewline
\hline
\end{tabular}
%Source: https://freestatistics.org/blog/index.php?pk=302444&T=0

[TABLE]
[ROW]
Summary of computational transaction[/C][/ROW] [ROW]Raw Input[/C] view raw input (R code) [/C][/ROW] [ROW]Raw Output[/C]view raw output of R engine [/C][/ROW] [ROW]Computing time[/C]1 seconds[/C][/ROW] [ROW]R Server[/C]Big Analytics Cloud Computing Center[/C][/ROW] [/TABLE] Source: https://freestatistics.org/blog/index.php?pk=302444&T=0

Globally Unique Identifier (entire table): ba.freestatistics.org/blog/index.php?pk=302444&T=0

As an alternative you can also use a QR Code:  

The GUIDs for individual cells are displayed in the table below:

Summary of computational transaction
Raw Input view raw input (R code)
Raw Outputview raw output of R engine
Computing time1 seconds
R ServerBig Analytics Cloud Computing Center


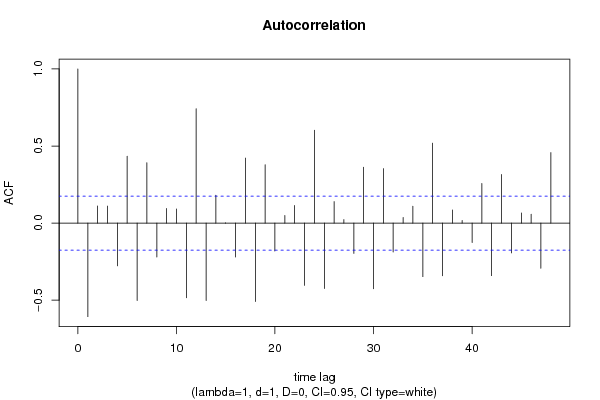
Autocorrelation Function
Time lag kACF(k)T-STATP-value
1-0.606906-6.78540
20.111521.24680.107395
30.1101261.23120.110271
4-0.277376-3.10120.001191
50.4332854.84432e-06
6-0.501838-5.61070
70.3917614.381.2e-05
8-0.219619-2.45540.007724
90.0951751.06410.144669
100.0915781.02390.153937
11-0.483921-5.41040
120.7414618.28980
13-0.501955-5.6120
140.180432.01730.022905
150.0008050.0090.496417
16-0.220041-2.46010.007627
170.4216334.7143e-06
18-0.508184-5.68170
190.3789924.23732.2e-05
20-0.18058-2.01890.022816
210.049720.55590.289641
220.1146961.28230.101048
23-0.403831-4.5157e-06
240.6018596.7290
25-0.424178-4.74253e-06
260.1394611.55920.060736
270.0227660.25450.399753
28-0.19669-2.19910.014857
290.3627764.0564.4e-05
30-0.425844-4.76113e-06
310.3533743.95086.5e-05
32-0.187379-2.0950.019097
330.0365750.40890.341647
340.1090671.21940.112493
35-0.347266-3.88268.3e-05
360.5186455.79860
37-0.341891-3.82250.000104
380.0846620.94650.172848
390.016430.18370.427274
40-0.126368-1.41280.080094
410.2567892.8710.002404
42-0.340801-3.81030.000108
430.3157443.53010.000291
44-0.193287-2.1610.0163
450.0654310.73150.23291
460.056950.63670.262734
47-0.292501-3.27030.000694
480.4570725.11021e-06

\begin{tabular}{lllllllll}
\hline
Autocorrelation Function \tabularnewline
Time lag k & ACF(k) & T-STAT & P-value \tabularnewline
1 & -0.606906 & -6.7854 & 0 \tabularnewline
2 & 0.11152 & 1.2468 & 0.107395 \tabularnewline
3 & 0.110126 & 1.2312 & 0.110271 \tabularnewline
4 & -0.277376 & -3.1012 & 0.001191 \tabularnewline
5 & 0.433285 & 4.8443 & 2e-06 \tabularnewline
6 & -0.501838 & -5.6107 & 0 \tabularnewline
7 & 0.391761 & 4.38 & 1.2e-05 \tabularnewline
8 & -0.219619 & -2.4554 & 0.007724 \tabularnewline
9 & 0.095175 & 1.0641 & 0.144669 \tabularnewline
10 & 0.091578 & 1.0239 & 0.153937 \tabularnewline
11 & -0.483921 & -5.4104 & 0 \tabularnewline
12 & 0.741461 & 8.2898 & 0 \tabularnewline
13 & -0.501955 & -5.612 & 0 \tabularnewline
14 & 0.18043 & 2.0173 & 0.022905 \tabularnewline
15 & 0.000805 & 0.009 & 0.496417 \tabularnewline
16 & -0.220041 & -2.4601 & 0.007627 \tabularnewline
17 & 0.421633 & 4.714 & 3e-06 \tabularnewline
18 & -0.508184 & -5.6817 & 0 \tabularnewline
19 & 0.378992 & 4.2373 & 2.2e-05 \tabularnewline
20 & -0.18058 & -2.0189 & 0.022816 \tabularnewline
21 & 0.04972 & 0.5559 & 0.289641 \tabularnewline
22 & 0.114696 & 1.2823 & 0.101048 \tabularnewline
23 & -0.403831 & -4.515 & 7e-06 \tabularnewline
24 & 0.601859 & 6.729 & 0 \tabularnewline
25 & -0.424178 & -4.7425 & 3e-06 \tabularnewline
26 & 0.139461 & 1.5592 & 0.060736 \tabularnewline
27 & 0.022766 & 0.2545 & 0.399753 \tabularnewline
28 & -0.19669 & -2.1991 & 0.014857 \tabularnewline
29 & 0.362776 & 4.056 & 4.4e-05 \tabularnewline
30 & -0.425844 & -4.7611 & 3e-06 \tabularnewline
31 & 0.353374 & 3.9508 & 6.5e-05 \tabularnewline
32 & -0.187379 & -2.095 & 0.019097 \tabularnewline
33 & 0.036575 & 0.4089 & 0.341647 \tabularnewline
34 & 0.109067 & 1.2194 & 0.112493 \tabularnewline
35 & -0.347266 & -3.8826 & 8.3e-05 \tabularnewline
36 & 0.518645 & 5.7986 & 0 \tabularnewline
37 & -0.341891 & -3.8225 & 0.000104 \tabularnewline
38 & 0.084662 & 0.9465 & 0.172848 \tabularnewline
39 & 0.01643 & 0.1837 & 0.427274 \tabularnewline
40 & -0.126368 & -1.4128 & 0.080094 \tabularnewline
41 & 0.256789 & 2.871 & 0.002404 \tabularnewline
42 & -0.340801 & -3.8103 & 0.000108 \tabularnewline
43 & 0.315744 & 3.5301 & 0.000291 \tabularnewline
44 & -0.193287 & -2.161 & 0.0163 \tabularnewline
45 & 0.065431 & 0.7315 & 0.23291 \tabularnewline
46 & 0.05695 & 0.6367 & 0.262734 \tabularnewline
47 & -0.292501 & -3.2703 & 0.000694 \tabularnewline
48 & 0.457072 & 5.1102 & 1e-06 \tabularnewline
\hline
\end{tabular}
%Source: https://freestatistics.org/blog/index.php?pk=302444&T=1

[TABLE]
[ROW][C]Autocorrelation Function[/C][/ROW]
[ROW][C]Time lag k[/C][C]ACF(k)[/C][C]T-STAT[/C][C]P-value[/C][/ROW]
[ROW][C]1[/C][C]-0.606906[/C][C]-6.7854[/C][C]0[/C][/ROW]
[ROW][C]2[/C][C]0.11152[/C][C]1.2468[/C][C]0.107395[/C][/ROW]
[ROW][C]3[/C][C]0.110126[/C][C]1.2312[/C][C]0.110271[/C][/ROW]
[ROW][C]4[/C][C]-0.277376[/C][C]-3.1012[/C][C]0.001191[/C][/ROW]
[ROW][C]5[/C][C]0.433285[/C][C]4.8443[/C][C]2e-06[/C][/ROW]
[ROW][C]6[/C][C]-0.501838[/C][C]-5.6107[/C][C]0[/C][/ROW]
[ROW][C]7[/C][C]0.391761[/C][C]4.38[/C][C]1.2e-05[/C][/ROW]
[ROW][C]8[/C][C]-0.219619[/C][C]-2.4554[/C][C]0.007724[/C][/ROW]
[ROW][C]9[/C][C]0.095175[/C][C]1.0641[/C][C]0.144669[/C][/ROW]
[ROW][C]10[/C][C]0.091578[/C][C]1.0239[/C][C]0.153937[/C][/ROW]
[ROW][C]11[/C][C]-0.483921[/C][C]-5.4104[/C][C]0[/C][/ROW]
[ROW][C]12[/C][C]0.741461[/C][C]8.2898[/C][C]0[/C][/ROW]
[ROW][C]13[/C][C]-0.501955[/C][C]-5.612[/C][C]0[/C][/ROW]
[ROW][C]14[/C][C]0.18043[/C][C]2.0173[/C][C]0.022905[/C][/ROW]
[ROW][C]15[/C][C]0.000805[/C][C]0.009[/C][C]0.496417[/C][/ROW]
[ROW][C]16[/C][C]-0.220041[/C][C]-2.4601[/C][C]0.007627[/C][/ROW]
[ROW][C]17[/C][C]0.421633[/C][C]4.714[/C][C]3e-06[/C][/ROW]
[ROW][C]18[/C][C]-0.508184[/C][C]-5.6817[/C][C]0[/C][/ROW]
[ROW][C]19[/C][C]0.378992[/C][C]4.2373[/C][C]2.2e-05[/C][/ROW]
[ROW][C]20[/C][C]-0.18058[/C][C]-2.0189[/C][C]0.022816[/C][/ROW]
[ROW][C]21[/C][C]0.04972[/C][C]0.5559[/C][C]0.289641[/C][/ROW]
[ROW][C]22[/C][C]0.114696[/C][C]1.2823[/C][C]0.101048[/C][/ROW]
[ROW][C]23[/C][C]-0.403831[/C][C]-4.515[/C][C]7e-06[/C][/ROW]
[ROW][C]24[/C][C]0.601859[/C][C]6.729[/C][C]0[/C][/ROW]
[ROW][C]25[/C][C]-0.424178[/C][C]-4.7425[/C][C]3e-06[/C][/ROW]
[ROW][C]26[/C][C]0.139461[/C][C]1.5592[/C][C]0.060736[/C][/ROW]
[ROW][C]27[/C][C]0.022766[/C][C]0.2545[/C][C]0.399753[/C][/ROW]
[ROW][C]28[/C][C]-0.19669[/C][C]-2.1991[/C][C]0.014857[/C][/ROW]
[ROW][C]29[/C][C]0.362776[/C][C]4.056[/C][C]4.4e-05[/C][/ROW]
[ROW][C]30[/C][C]-0.425844[/C][C]-4.7611[/C][C]3e-06[/C][/ROW]
[ROW][C]31[/C][C]0.353374[/C][C]3.9508[/C][C]6.5e-05[/C][/ROW]
[ROW][C]32[/C][C]-0.187379[/C][C]-2.095[/C][C]0.019097[/C][/ROW]
[ROW][C]33[/C][C]0.036575[/C][C]0.4089[/C][C]0.341647[/C][/ROW]
[ROW][C]34[/C][C]0.109067[/C][C]1.2194[/C][C]0.112493[/C][/ROW]
[ROW][C]35[/C][C]-0.347266[/C][C]-3.8826[/C][C]8.3e-05[/C][/ROW]
[ROW][C]36[/C][C]0.518645[/C][C]5.7986[/C][C]0[/C][/ROW]
[ROW][C]37[/C][C]-0.341891[/C][C]-3.8225[/C][C]0.000104[/C][/ROW]
[ROW][C]38[/C][C]0.084662[/C][C]0.9465[/C][C]0.172848[/C][/ROW]
[ROW][C]39[/C][C]0.01643[/C][C]0.1837[/C][C]0.427274[/C][/ROW]
[ROW][C]40[/C][C]-0.126368[/C][C]-1.4128[/C][C]0.080094[/C][/ROW]
[ROW][C]41[/C][C]0.256789[/C][C]2.871[/C][C]0.002404[/C][/ROW]
[ROW][C]42[/C][C]-0.340801[/C][C]-3.8103[/C][C]0.000108[/C][/ROW]
[ROW][C]43[/C][C]0.315744[/C][C]3.5301[/C][C]0.000291[/C][/ROW]
[ROW][C]44[/C][C]-0.193287[/C][C]-2.161[/C][C]0.0163[/C][/ROW]
[ROW][C]45[/C][C]0.065431[/C][C]0.7315[/C][C]0.23291[/C][/ROW]
[ROW][C]46[/C][C]0.05695[/C][C]0.6367[/C][C]0.262734[/C][/ROW]
[ROW][C]47[/C][C]-0.292501[/C][C]-3.2703[/C][C]0.000694[/C][/ROW]
[ROW][C]48[/C][C]0.457072[/C][C]5.1102[/C][C]1e-06[/C][/ROW]
[/TABLE]
Source: https://freestatistics.org/blog/index.php?pk=302444&T=1

Globally Unique Identifier (entire table): ba.freestatistics.org/blog/index.php?pk=302444&T=1

As an alternative you can also use a QR Code:  

The GUIDs for individual cells are displayed in the table below:

Autocorrelation Function
Time lag kACF(k)T-STATP-value
1-0.606906-6.78540
20.111521.24680.107395
30.1101261.23120.110271
4-0.277376-3.10120.001191
50.4332854.84432e-06
6-0.501838-5.61070
70.3917614.381.2e-05
8-0.219619-2.45540.007724
90.0951751.06410.144669
100.0915781.02390.153937
11-0.483921-5.41040
120.7414618.28980
13-0.501955-5.6120
140.180432.01730.022905
150.0008050.0090.496417
16-0.220041-2.46010.007627
170.4216334.7143e-06
18-0.508184-5.68170
190.3789924.23732.2e-05
20-0.18058-2.01890.022816
210.049720.55590.289641
220.1146961.28230.101048
23-0.403831-4.5157e-06
240.6018596.7290
25-0.424178-4.74253e-06
260.1394611.55920.060736
270.0227660.25450.399753
28-0.19669-2.19910.014857
290.3627764.0564.4e-05
30-0.425844-4.76113e-06
310.3533743.95086.5e-05
32-0.187379-2.0950.019097
330.0365750.40890.341647
340.1090671.21940.112493
35-0.347266-3.88268.3e-05
360.5186455.79860
37-0.341891-3.82250.000104
380.0846620.94650.172848
390.016430.18370.427274
40-0.126368-1.41280.080094
410.2567892.8710.002404
42-0.340801-3.81030.000108
430.3157443.53010.000291
44-0.193287-2.1610.0163
450.0654310.73150.23291
460.056950.63670.262734
47-0.292501-3.27030.000694
480.4570725.11021e-06


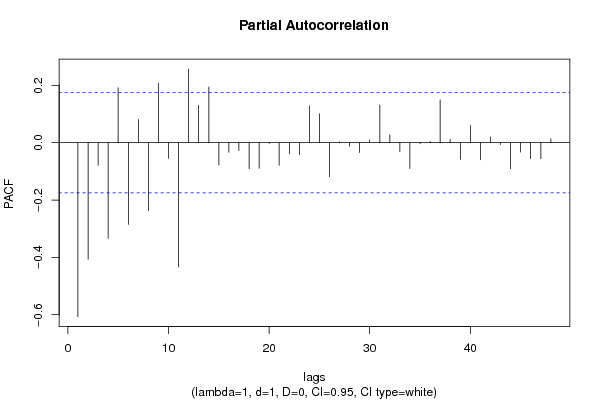
Partial Autocorrelation Function
Time lag kPACF(k)T-STATP-value
1-0.606906-6.78540
2-0.406568-4.54566e-06
3-0.078563-0.87840.190715
4-0.333416-3.72770.000146
50.191662.14280.017033
6-0.285111-3.18760.000906
70.0809630.90520.183553
8-0.237027-2.650.004544
90.2071162.31560.011104
10-0.054733-0.61190.270845
11-0.4332-4.84332e-06
120.2573172.87690.002362
130.1305641.45980.073433
140.1943322.17270.015845
15-0.078124-0.87350.192046
16-0.033518-0.37470.354245
17-0.027454-0.30690.379696
18-0.090672-1.01370.156333
19-0.089406-0.99960.159719
20-0.003107-0.03470.486171
21-0.078534-0.8780.190804
22-0.038555-0.43110.333586
23-0.04165-0.46570.321135
240.1276731.42740.077975
250.1011891.13130.130042
26-0.118798-1.32820.093266
270.0029110.03250.487044
28-0.011933-0.13340.44704
29-0.034144-0.38170.351651
300.0096410.10780.457166
310.1317241.47270.071671
320.0275750.30830.379185
33-0.030672-0.34290.366117
34-0.0903-1.00960.157321
35-0.003595-0.04020.484002
360.0040310.04510.482062
370.1489051.66480.049228
380.0115930.12960.448542
39-0.058299-0.65180.257863
400.0603230.67440.250641
41-0.059604-0.66640.253195
420.0201630.22540.411007
43-0.005833-0.06520.474054
44-0.09063-1.01330.156443
45-0.032189-0.35990.35977
46-0.055987-0.6260.266242
47-0.056177-0.62810.265549
480.013530.15130.440001

\begin{tabular}{lllllllll}
\hline
Partial Autocorrelation Function \tabularnewline
Time lag k & PACF(k) & T-STAT & P-value \tabularnewline
1 & -0.606906 & -6.7854 & 0 \tabularnewline
2 & -0.406568 & -4.5456 & 6e-06 \tabularnewline
3 & -0.078563 & -0.8784 & 0.190715 \tabularnewline
4 & -0.333416 & -3.7277 & 0.000146 \tabularnewline
5 & 0.19166 & 2.1428 & 0.017033 \tabularnewline
6 & -0.285111 & -3.1876 & 0.000906 \tabularnewline
7 & 0.080963 & 0.9052 & 0.183553 \tabularnewline
8 & -0.237027 & -2.65 & 0.004544 \tabularnewline
9 & 0.207116 & 2.3156 & 0.011104 \tabularnewline
10 & -0.054733 & -0.6119 & 0.270845 \tabularnewline
11 & -0.4332 & -4.8433 & 2e-06 \tabularnewline
12 & 0.257317 & 2.8769 & 0.002362 \tabularnewline
13 & 0.130564 & 1.4598 & 0.073433 \tabularnewline
14 & 0.194332 & 2.1727 & 0.015845 \tabularnewline
15 & -0.078124 & -0.8735 & 0.192046 \tabularnewline
16 & -0.033518 & -0.3747 & 0.354245 \tabularnewline
17 & -0.027454 & -0.3069 & 0.379696 \tabularnewline
18 & -0.090672 & -1.0137 & 0.156333 \tabularnewline
19 & -0.089406 & -0.9996 & 0.159719 \tabularnewline
20 & -0.003107 & -0.0347 & 0.486171 \tabularnewline
21 & -0.078534 & -0.878 & 0.190804 \tabularnewline
22 & -0.038555 & -0.4311 & 0.333586 \tabularnewline
23 & -0.04165 & -0.4657 & 0.321135 \tabularnewline
24 & 0.127673 & 1.4274 & 0.077975 \tabularnewline
25 & 0.101189 & 1.1313 & 0.130042 \tabularnewline
26 & -0.118798 & -1.3282 & 0.093266 \tabularnewline
27 & 0.002911 & 0.0325 & 0.487044 \tabularnewline
28 & -0.011933 & -0.1334 & 0.44704 \tabularnewline
29 & -0.034144 & -0.3817 & 0.351651 \tabularnewline
30 & 0.009641 & 0.1078 & 0.457166 \tabularnewline
31 & 0.131724 & 1.4727 & 0.071671 \tabularnewline
32 & 0.027575 & 0.3083 & 0.379185 \tabularnewline
33 & -0.030672 & -0.3429 & 0.366117 \tabularnewline
34 & -0.0903 & -1.0096 & 0.157321 \tabularnewline
35 & -0.003595 & -0.0402 & 0.484002 \tabularnewline
36 & 0.004031 & 0.0451 & 0.482062 \tabularnewline
37 & 0.148905 & 1.6648 & 0.049228 \tabularnewline
38 & 0.011593 & 0.1296 & 0.448542 \tabularnewline
39 & -0.058299 & -0.6518 & 0.257863 \tabularnewline
40 & 0.060323 & 0.6744 & 0.250641 \tabularnewline
41 & -0.059604 & -0.6664 & 0.253195 \tabularnewline
42 & 0.020163 & 0.2254 & 0.411007 \tabularnewline
43 & -0.005833 & -0.0652 & 0.474054 \tabularnewline
44 & -0.09063 & -1.0133 & 0.156443 \tabularnewline
45 & -0.032189 & -0.3599 & 0.35977 \tabularnewline
46 & -0.055987 & -0.626 & 0.266242 \tabularnewline
47 & -0.056177 & -0.6281 & 0.265549 \tabularnewline
48 & 0.01353 & 0.1513 & 0.440001 \tabularnewline
\hline
\end{tabular}
%Source: https://freestatistics.org/blog/index.php?pk=302444&T=2

[TABLE]
[ROW][C]Partial Autocorrelation Function[/C][/ROW]
[ROW][C]Time lag k[/C][C]PACF(k)[/C][C]T-STAT[/C][C]P-value[/C][/ROW]
[ROW][C]1[/C][C]-0.606906[/C][C]-6.7854[/C][C]0[/C][/ROW]
[ROW][C]2[/C][C]-0.406568[/C][C]-4.5456[/C][C]6e-06[/C][/ROW]
[ROW][C]3[/C][C]-0.078563[/C][C]-0.8784[/C][C]0.190715[/C][/ROW]
[ROW][C]4[/C][C]-0.333416[/C][C]-3.7277[/C][C]0.000146[/C][/ROW]
[ROW][C]5[/C][C]0.19166[/C][C]2.1428[/C][C]0.017033[/C][/ROW]
[ROW][C]6[/C][C]-0.285111[/C][C]-3.1876[/C][C]0.000906[/C][/ROW]
[ROW][C]7[/C][C]0.080963[/C][C]0.9052[/C][C]0.183553[/C][/ROW]
[ROW][C]8[/C][C]-0.237027[/C][C]-2.65[/C][C]0.004544[/C][/ROW]
[ROW][C]9[/C][C]0.207116[/C][C]2.3156[/C][C]0.011104[/C][/ROW]
[ROW][C]10[/C][C]-0.054733[/C][C]-0.6119[/C][C]0.270845[/C][/ROW]
[ROW][C]11[/C][C]-0.4332[/C][C]-4.8433[/C][C]2e-06[/C][/ROW]
[ROW][C]12[/C][C]0.257317[/C][C]2.8769[/C][C]0.002362[/C][/ROW]
[ROW][C]13[/C][C]0.130564[/C][C]1.4598[/C][C]0.073433[/C][/ROW]
[ROW][C]14[/C][C]0.194332[/C][C]2.1727[/C][C]0.015845[/C][/ROW]
[ROW][C]15[/C][C]-0.078124[/C][C]-0.8735[/C][C]0.192046[/C][/ROW]
[ROW][C]16[/C][C]-0.033518[/C][C]-0.3747[/C][C]0.354245[/C][/ROW]
[ROW][C]17[/C][C]-0.027454[/C][C]-0.3069[/C][C]0.379696[/C][/ROW]
[ROW][C]18[/C][C]-0.090672[/C][C]-1.0137[/C][C]0.156333[/C][/ROW]
[ROW][C]19[/C][C]-0.089406[/C][C]-0.9996[/C][C]0.159719[/C][/ROW]
[ROW][C]20[/C][C]-0.003107[/C][C]-0.0347[/C][C]0.486171[/C][/ROW]
[ROW][C]21[/C][C]-0.078534[/C][C]-0.878[/C][C]0.190804[/C][/ROW]
[ROW][C]22[/C][C]-0.038555[/C][C]-0.4311[/C][C]0.333586[/C][/ROW]
[ROW][C]23[/C][C]-0.04165[/C][C]-0.4657[/C][C]0.321135[/C][/ROW]
[ROW][C]24[/C][C]0.127673[/C][C]1.4274[/C][C]0.077975[/C][/ROW]
[ROW][C]25[/C][C]0.101189[/C][C]1.1313[/C][C]0.130042[/C][/ROW]
[ROW][C]26[/C][C]-0.118798[/C][C]-1.3282[/C][C]0.093266[/C][/ROW]
[ROW][C]27[/C][C]0.002911[/C][C]0.0325[/C][C]0.487044[/C][/ROW]
[ROW][C]28[/C][C]-0.011933[/C][C]-0.1334[/C][C]0.44704[/C][/ROW]
[ROW][C]29[/C][C]-0.034144[/C][C]-0.3817[/C][C]0.351651[/C][/ROW]
[ROW][C]30[/C][C]0.009641[/C][C]0.1078[/C][C]0.457166[/C][/ROW]
[ROW][C]31[/C][C]0.131724[/C][C]1.4727[/C][C]0.071671[/C][/ROW]
[ROW][C]32[/C][C]0.027575[/C][C]0.3083[/C][C]0.379185[/C][/ROW]
[ROW][C]33[/C][C]-0.030672[/C][C]-0.3429[/C][C]0.366117[/C][/ROW]
[ROW][C]34[/C][C]-0.0903[/C][C]-1.0096[/C][C]0.157321[/C][/ROW]
[ROW][C]35[/C][C]-0.003595[/C][C]-0.0402[/C][C]0.484002[/C][/ROW]
[ROW][C]36[/C][C]0.004031[/C][C]0.0451[/C][C]0.482062[/C][/ROW]
[ROW][C]37[/C][C]0.148905[/C][C]1.6648[/C][C]0.049228[/C][/ROW]
[ROW][C]38[/C][C]0.011593[/C][C]0.1296[/C][C]0.448542[/C][/ROW]
[ROW][C]39[/C][C]-0.058299[/C][C]-0.6518[/C][C]0.257863[/C][/ROW]
[ROW][C]40[/C][C]0.060323[/C][C]0.6744[/C][C]0.250641[/C][/ROW]
[ROW][C]41[/C][C]-0.059604[/C][C]-0.6664[/C][C]0.253195[/C][/ROW]
[ROW][C]42[/C][C]0.020163[/C][C]0.2254[/C][C]0.411007[/C][/ROW]
[ROW][C]43[/C][C]-0.005833[/C][C]-0.0652[/C][C]0.474054[/C][/ROW]
[ROW][C]44[/C][C]-0.09063[/C][C]-1.0133[/C][C]0.156443[/C][/ROW]
[ROW][C]45[/C][C]-0.032189[/C][C]-0.3599[/C][C]0.35977[/C][/ROW]
[ROW][C]46[/C][C]-0.055987[/C][C]-0.626[/C][C]0.266242[/C][/ROW]
[ROW][C]47[/C][C]-0.056177[/C][C]-0.6281[/C][C]0.265549[/C][/ROW]
[ROW][C]48[/C][C]0.01353[/C][C]0.1513[/C][C]0.440001[/C][/ROW]
[/TABLE]
Source: https://freestatistics.org/blog/index.php?pk=302444&T=2

Globally Unique Identifier (entire table): ba.freestatistics.org/blog/index.php?pk=302444&T=2

As an alternative you can also use a QR Code:  

The GUIDs for individual cells are displayed in the table below:

Partial Autocorrelation Function
Time lag kPACF(k)T-STATP-value
1-0.606906-6.78540
2-0.406568-4.54566e-06
3-0.078563-0.87840.190715
4-0.333416-3.72770.000146
50.191662.14280.017033
6-0.285111-3.18760.000906
70.0809630.90520.183553
8-0.237027-2.650.004544
90.2071162.31560.011104
10-0.054733-0.61190.270845
11-0.4332-4.84332e-06
120.2573172.87690.002362
130.1305641.45980.073433
140.1943322.17270.015845
15-0.078124-0.87350.192046
16-0.033518-0.37470.354245
17-0.027454-0.30690.379696
18-0.090672-1.01370.156333
19-0.089406-0.99960.159719
20-0.003107-0.03470.486171
21-0.078534-0.8780.190804
22-0.038555-0.43110.333586
23-0.04165-0.46570.321135
240.1276731.42740.077975
250.1011891.13130.130042
26-0.118798-1.32820.093266
270.0029110.03250.487044
28-0.011933-0.13340.44704
29-0.034144-0.38170.351651
300.0096410.10780.457166
310.1317241.47270.071671
320.0275750.30830.379185
33-0.030672-0.34290.366117
34-0.0903-1.00960.157321
35-0.003595-0.04020.484002
360.0040310.04510.482062
370.1489051.66480.049228
380.0115930.12960.448542
39-0.058299-0.65180.257863
400.0603230.67440.250641
41-0.059604-0.66640.253195
420.0201630.22540.411007
43-0.005833-0.06520.474054
44-0.09063-1.01330.156443
45-0.032189-0.35990.35977
46-0.055987-0.6260.266242
47-0.056177-0.62810.265549
480.013530.15130.440001


Parameters (Session):
par1 = 48 ; par2 = 1 ; par3 = 1 ; par4 = 0 ; par5 = 12 ; par6 = White Noise ; par7 = 0.95 ;
Parameters (R input):
par1 = 48 ; par2 = 1 ; par3 = 1 ; par4 = 0 ; par5 = 12 ; par6 = White Noise ; par7 = 0.95 ; par8 = ;
R code (references can be found in the software module):
par8 <- ''
par7 <- '0.95'
par6 <- 'White Noise'
par5 <- '12'
par4 <- '0'
par3 <- '1'
par2 <- '1'
par1 <- 'Default'
if (par1 == 'Default') {
par1 = 10*log10(length(x))
} else {
par1 <- as.numeric(par1)
}
par2 <- as.numeric(par2)
par3 <- as.numeric(par3)
par4 <- as.numeric(par4)
par5 <- as.numeric(par5)
if (par6 == 'White Noise') par6 <- 'white' else par6 <- 'ma'
par7 <- as.numeric(par7)
if (par8 != '') par8 <- as.numeric(par8)
x <- na.omit(x)
ox <- x
if (par8 == '') {
if (par2 == 0) {
x <- log(x)
} else {
x <- (x ^ par2 - 1) / par2
}
} else {
x <- log(x,base=par8)
}
if (par3 > 0) x <- diff(x,lag=1,difference=par3)
if (par4 > 0) x <- diff(x,lag=par5,difference=par4)
bitmap(file='picts.png')
op <- par(mfrow=c(2,1))
plot(ox,type='l',main='Original Time Series',xlab='time',ylab='value')
if (par8=='') {
mytitle <- paste('Working Time Series (lambda=',par2,', d=',par3,', D=',par4,')',sep='')
mysub <- paste('(lambda=',par2,', d=',par3,', D=',par4,', CI=', par7, ', CI type=',par6,')',sep='')
} else {
mytitle <- paste('Working Time Series (base=',par8,', d=',par3,', D=',par4,')',sep='')
mysub <- paste('(base=',par8,', d=',par3,', D=',par4,', CI=', par7, ', CI type=',par6,')',sep='')
}
plot(x,type='l', main=mytitle,xlab='time',ylab='value')
par(op)
dev.off()
bitmap(file='pic1.png')
racf <- acf(x, par1, main='Autocorrelation', xlab='time lag', ylab='ACF', ci.type=par6, ci=par7, sub=mysub)
dev.off()
bitmap(file='pic2.png')
rpacf <- pacf(x,par1,main='Partial Autocorrelation',xlab='lags',ylab='PACF',sub=mysub)
dev.off()
(myacf <- c(racf$acf))
(mypacf <- c(rpacf$acf))
lengthx <- length(x)
sqrtn <- sqrt(lengthx)
load(file='createtable')
a<-table.start()
a<-table.row.start(a)
a<-table.element(a,'Autocorrelation Function',4,TRUE)
a<-table.row.end(a)
a<-table.row.start(a)
a<-table.element(a,'Time lag k',header=TRUE)
a<-table.element(a,'ACF(k)',header=TRUE)
a<-table.element(a,'T-STAT',header=TRUE)
a<-table.element(a,'P-value',header=TRUE)
a<-table.row.end(a)
for (i in 2:(par1+1)) {
a<-table.row.start(a)
a<-table.element(a,i-1,header=TRUE)
a<-table.element(a,round(myacf[i],6))
mytstat <- myacf[i]*sqrtn
a<-table.element(a,round(mytstat,4))
a<-table.element(a,round(1-pt(abs(mytstat),lengthx),6))
a<-table.row.end(a)
}
a<-table.end(a)
table.save(a,file='mytable.tab')
a<-table.start()
a<-table.row.start(a)
a<-table.element(a,'Partial Autocorrelation Function',4,TRUE)
a<-table.row.end(a)
a<-table.row.start(a)
a<-table.element(a,'Time lag k',header=TRUE)
a<-table.element(a,'PACF(k)',header=TRUE)
a<-table.element(a,'T-STAT',header=TRUE)
a<-table.element(a,'P-value',header=TRUE)
a<-table.row.end(a)
for (i in 1:par1) {
a<-table.row.start(a)
a<-table.element(a,i,header=TRUE)
a<-table.element(a,round(mypacf[i],6))
mytstat <- mypacf[i]*sqrtn
a<-table.element(a,round(mytstat,4))
a<-table.element(a,round(1-pt(abs(mytstat),lengthx),6))
a<-table.row.end(a)
}
a<-table.end(a)
table.save(a,file='mytable1.tab')