Free Statistics

of Irreproducible Research!

Author's title

Author*The author of this computation has been verified*
R Software Modulerwasp_autocorrelation.wasp
Title produced by software(Partial) Autocorrelation Function
Date of computationWed, 21 Dec 2016 16:06:39 +0100
Cite this page as followsStatistical Computations at FreeStatistics.org, Office for Research Development and Education, URL https://freestatistics.org/blog/index.php?v=date/2016/Dec/21/t1482332858y2zoro8zonr6h2l.htm/, Retrieved Fri, 17 May 2024 16:39:25 +0000
Statistical Computations at FreeStatistics.org, Office for Research Development and Education, URL https://freestatistics.org/blog/index.php?pk=302369, Retrieved Fri, 17 May 2024 16:39:25 +0000
QR Codes:

Original text written by user:
IsPrivate?No (this computation is public)
User-defined keywords
Estimated Impact66
Family? (F = Feedback message, R = changed R code, M = changed R Module, P = changed Parameters, D = changed Data)
-       [(Partial) Autocorrelation Function] [] [2016-12-21 15:06:39] [361c8dad91b3f1ef2e651cd04783c23b] [Current]
Feedback Forum

Post a new message
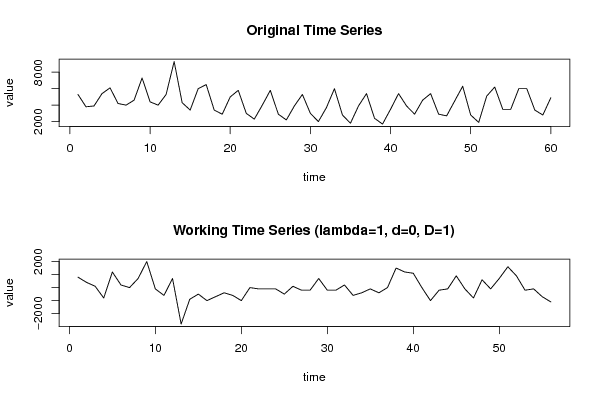
Dataseries X:
5300
3800
3900
5400
6100
4200
4000
4600
7300
4400
4000
5300
9300
4300
3400
6000
6500
3400
2900
5000
5800
3000
2300
4000
5800
2900
2200
3900
5300
3000
2000
3700
6000
2800
1800
3900
5400
2400
1700
3500
5400
3900
2900
4600
5400
2900
2700
4500
6300
2800
1900
5100
6200
3500
3500
6000
6000
3400
2800
4900


Summary of computational transaction
Raw Input view raw input (R code)
Raw Outputview raw output of R engine
Computing time1 seconds
R ServerBig Analytics Cloud Computing Center

\begin{tabular}{lllllllll}
\hline
Summary of computational transaction \tabularnewline
Raw Input view raw input (R code)  \tabularnewline
Raw Outputview raw output of R engine  \tabularnewline
Computing time1 seconds \tabularnewline
R ServerBig Analytics Cloud Computing Center \tabularnewline
\hline
\end{tabular}
%Source: https://freestatistics.org/blog/index.php?pk=302369&T=0

[TABLE]
[ROW]
Summary of computational transaction[/C][/ROW] [ROW]Raw Input[/C] view raw input (R code) [/C][/ROW] [ROW]Raw Output[/C]view raw output of R engine [/C][/ROW] [ROW]Computing time[/C]1 seconds[/C][/ROW] [ROW]R Server[/C]Big Analytics Cloud Computing Center[/C][/ROW] [/TABLE] Source: https://freestatistics.org/blog/index.php?pk=302369&T=0

Globally Unique Identifier (entire table): ba.freestatistics.org/blog/index.php?pk=302369&T=0

As an alternative you can also use a QR Code:  

The GUIDs for individual cells are displayed in the table below:

Summary of computational transaction
Raw Input view raw input (R code)
Raw Outputview raw output of R engine
Computing time1 seconds
R ServerBig Analytics Cloud Computing Center


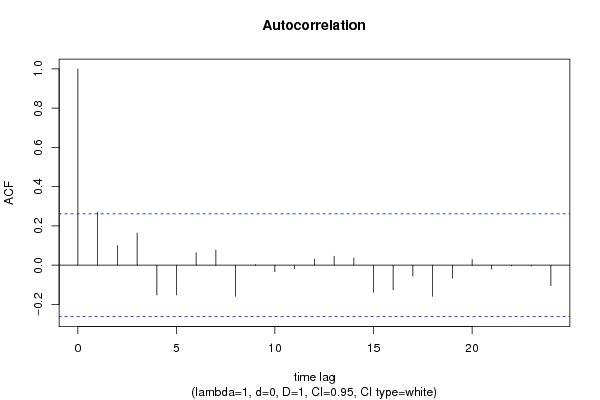
Autocorrelation Function
Time lag kACF(k)T-STATP-value
10.2707642.02620.023758
20.1005870.75270.227383
30.1644571.23070.111793
4-0.151767-1.13570.130456
5-0.150895-1.12920.131815
60.0639750.47870.316991
70.0779790.58350.280936
8-0.157811-1.18090.121308
90.0031530.02360.49063
10-0.032612-0.2440.404042
11-0.017686-0.13230.447591
120.0317840.23780.406433
130.0461730.34550.365496
140.0372290.27860.39079
15-0.137267-1.02720.154369
16-0.124982-0.93530.17683
17-0.055698-0.41680.339208
18-0.158171-1.18360.120777
19-0.065651-0.49130.312573
200.0292580.21890.413743
21-0.019897-0.14890.441084
22-0.003029-0.02270.490999
23-0.003282-0.02460.490245
24-0.103916-0.77760.220029

\begin{tabular}{lllllllll}
\hline
Autocorrelation Function \tabularnewline
Time lag k & ACF(k) & T-STAT & P-value \tabularnewline
1 & 0.270764 & 2.0262 & 0.023758 \tabularnewline
2 & 0.100587 & 0.7527 & 0.227383 \tabularnewline
3 & 0.164457 & 1.2307 & 0.111793 \tabularnewline
4 & -0.151767 & -1.1357 & 0.130456 \tabularnewline
5 & -0.150895 & -1.1292 & 0.131815 \tabularnewline
6 & 0.063975 & 0.4787 & 0.316991 \tabularnewline
7 & 0.077979 & 0.5835 & 0.280936 \tabularnewline
8 & -0.157811 & -1.1809 & 0.121308 \tabularnewline
9 & 0.003153 & 0.0236 & 0.49063 \tabularnewline
10 & -0.032612 & -0.244 & 0.404042 \tabularnewline
11 & -0.017686 & -0.1323 & 0.447591 \tabularnewline
12 & 0.031784 & 0.2378 & 0.406433 \tabularnewline
13 & 0.046173 & 0.3455 & 0.365496 \tabularnewline
14 & 0.037229 & 0.2786 & 0.39079 \tabularnewline
15 & -0.137267 & -1.0272 & 0.154369 \tabularnewline
16 & -0.124982 & -0.9353 & 0.17683 \tabularnewline
17 & -0.055698 & -0.4168 & 0.339208 \tabularnewline
18 & -0.158171 & -1.1836 & 0.120777 \tabularnewline
19 & -0.065651 & -0.4913 & 0.312573 \tabularnewline
20 & 0.029258 & 0.2189 & 0.413743 \tabularnewline
21 & -0.019897 & -0.1489 & 0.441084 \tabularnewline
22 & -0.003029 & -0.0227 & 0.490999 \tabularnewline
23 & -0.003282 & -0.0246 & 0.490245 \tabularnewline
24 & -0.103916 & -0.7776 & 0.220029 \tabularnewline
\hline
\end{tabular}
%Source: https://freestatistics.org/blog/index.php?pk=302369&T=1

[TABLE]
[ROW][C]Autocorrelation Function[/C][/ROW]
[ROW][C]Time lag k[/C][C]ACF(k)[/C][C]T-STAT[/C][C]P-value[/C][/ROW]
[ROW][C]1[/C][C]0.270764[/C][C]2.0262[/C][C]0.023758[/C][/ROW]
[ROW][C]2[/C][C]0.100587[/C][C]0.7527[/C][C]0.227383[/C][/ROW]
[ROW][C]3[/C][C]0.164457[/C][C]1.2307[/C][C]0.111793[/C][/ROW]
[ROW][C]4[/C][C]-0.151767[/C][C]-1.1357[/C][C]0.130456[/C][/ROW]
[ROW][C]5[/C][C]-0.150895[/C][C]-1.1292[/C][C]0.131815[/C][/ROW]
[ROW][C]6[/C][C]0.063975[/C][C]0.4787[/C][C]0.316991[/C][/ROW]
[ROW][C]7[/C][C]0.077979[/C][C]0.5835[/C][C]0.280936[/C][/ROW]
[ROW][C]8[/C][C]-0.157811[/C][C]-1.1809[/C][C]0.121308[/C][/ROW]
[ROW][C]9[/C][C]0.003153[/C][C]0.0236[/C][C]0.49063[/C][/ROW]
[ROW][C]10[/C][C]-0.032612[/C][C]-0.244[/C][C]0.404042[/C][/ROW]
[ROW][C]11[/C][C]-0.017686[/C][C]-0.1323[/C][C]0.447591[/C][/ROW]
[ROW][C]12[/C][C]0.031784[/C][C]0.2378[/C][C]0.406433[/C][/ROW]
[ROW][C]13[/C][C]0.046173[/C][C]0.3455[/C][C]0.365496[/C][/ROW]
[ROW][C]14[/C][C]0.037229[/C][C]0.2786[/C][C]0.39079[/C][/ROW]
[ROW][C]15[/C][C]-0.137267[/C][C]-1.0272[/C][C]0.154369[/C][/ROW]
[ROW][C]16[/C][C]-0.124982[/C][C]-0.9353[/C][C]0.17683[/C][/ROW]
[ROW][C]17[/C][C]-0.055698[/C][C]-0.4168[/C][C]0.339208[/C][/ROW]
[ROW][C]18[/C][C]-0.158171[/C][C]-1.1836[/C][C]0.120777[/C][/ROW]
[ROW][C]19[/C][C]-0.065651[/C][C]-0.4913[/C][C]0.312573[/C][/ROW]
[ROW][C]20[/C][C]0.029258[/C][C]0.2189[/C][C]0.413743[/C][/ROW]
[ROW][C]21[/C][C]-0.019897[/C][C]-0.1489[/C][C]0.441084[/C][/ROW]
[ROW][C]22[/C][C]-0.003029[/C][C]-0.0227[/C][C]0.490999[/C][/ROW]
[ROW][C]23[/C][C]-0.003282[/C][C]-0.0246[/C][C]0.490245[/C][/ROW]
[ROW][C]24[/C][C]-0.103916[/C][C]-0.7776[/C][C]0.220029[/C][/ROW]
[/TABLE]
Source: https://freestatistics.org/blog/index.php?pk=302369&T=1

Globally Unique Identifier (entire table): ba.freestatistics.org/blog/index.php?pk=302369&T=1

As an alternative you can also use a QR Code:  

The GUIDs for individual cells are displayed in the table below:

Autocorrelation Function
Time lag kACF(k)T-STATP-value
10.2707642.02620.023758
20.1005870.75270.227383
30.1644571.23070.111793
4-0.151767-1.13570.130456
5-0.150895-1.12920.131815
60.0639750.47870.316991
70.0779790.58350.280936
8-0.157811-1.18090.121308
90.0031530.02360.49063
10-0.032612-0.2440.404042
11-0.017686-0.13230.447591
120.0317840.23780.406433
130.0461730.34550.365496
140.0372290.27860.39079
15-0.137267-1.02720.154369
16-0.124982-0.93530.17683
17-0.055698-0.41680.339208
18-0.158171-1.18360.120777
19-0.065651-0.49130.312573
200.0292580.21890.413743
21-0.019897-0.14890.441084
22-0.003029-0.02270.490999
23-0.003282-0.02460.490245
24-0.103916-0.77760.220029


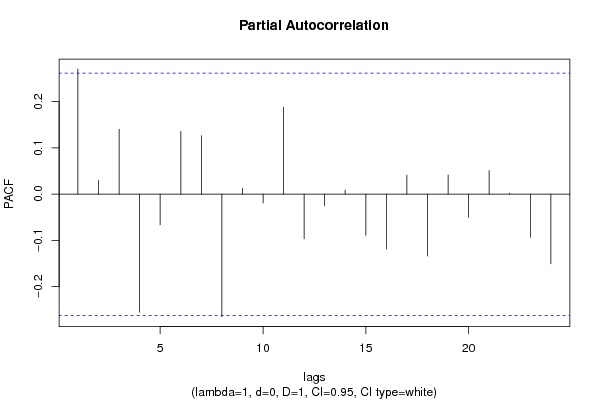
Partial Autocorrelation Function
Time lag kPACF(k)T-STATP-value
10.2707642.02620.023758
20.0294320.22030.413238
30.1404641.05110.148855
4-0.255157-1.90940.030668
5-0.066392-0.49680.310626
60.1353441.01280.157751
70.126340.94540.174247
8-0.264939-1.98260.026162
90.0125310.09380.462812
10-0.019092-0.14290.443452
110.1879781.40670.082521
12-0.096688-0.72350.236177
13-0.024984-0.1870.426183
140.0087450.06540.474028
15-0.088813-0.66460.254512
16-0.11846-0.88650.189577
170.0411910.30820.37952
18-0.133701-1.00050.160679
190.0411360.30780.379676
20-0.05-0.37420.354846
210.0508580.38060.352475
220.001920.01440.494293
23-0.093174-0.69730.244265
24-0.150636-1.12730.132221

\begin{tabular}{lllllllll}
\hline
Partial Autocorrelation Function \tabularnewline
Time lag k & PACF(k) & T-STAT & P-value \tabularnewline
1 & 0.270764 & 2.0262 & 0.023758 \tabularnewline
2 & 0.029432 & 0.2203 & 0.413238 \tabularnewline
3 & 0.140464 & 1.0511 & 0.148855 \tabularnewline
4 & -0.255157 & -1.9094 & 0.030668 \tabularnewline
5 & -0.066392 & -0.4968 & 0.310626 \tabularnewline
6 & 0.135344 & 1.0128 & 0.157751 \tabularnewline
7 & 0.12634 & 0.9454 & 0.174247 \tabularnewline
8 & -0.264939 & -1.9826 & 0.026162 \tabularnewline
9 & 0.012531 & 0.0938 & 0.462812 \tabularnewline
10 & -0.019092 & -0.1429 & 0.443452 \tabularnewline
11 & 0.187978 & 1.4067 & 0.082521 \tabularnewline
12 & -0.096688 & -0.7235 & 0.236177 \tabularnewline
13 & -0.024984 & -0.187 & 0.426183 \tabularnewline
14 & 0.008745 & 0.0654 & 0.474028 \tabularnewline
15 & -0.088813 & -0.6646 & 0.254512 \tabularnewline
16 & -0.11846 & -0.8865 & 0.189577 \tabularnewline
17 & 0.041191 & 0.3082 & 0.37952 \tabularnewline
18 & -0.133701 & -1.0005 & 0.160679 \tabularnewline
19 & 0.041136 & 0.3078 & 0.379676 \tabularnewline
20 & -0.05 & -0.3742 & 0.354846 \tabularnewline
21 & 0.050858 & 0.3806 & 0.352475 \tabularnewline
22 & 0.00192 & 0.0144 & 0.494293 \tabularnewline
23 & -0.093174 & -0.6973 & 0.244265 \tabularnewline
24 & -0.150636 & -1.1273 & 0.132221 \tabularnewline
\hline
\end{tabular}
%Source: https://freestatistics.org/blog/index.php?pk=302369&T=2

[TABLE]
[ROW][C]Partial Autocorrelation Function[/C][/ROW]
[ROW][C]Time lag k[/C][C]PACF(k)[/C][C]T-STAT[/C][C]P-value[/C][/ROW]
[ROW][C]1[/C][C]0.270764[/C][C]2.0262[/C][C]0.023758[/C][/ROW]
[ROW][C]2[/C][C]0.029432[/C][C]0.2203[/C][C]0.413238[/C][/ROW]
[ROW][C]3[/C][C]0.140464[/C][C]1.0511[/C][C]0.148855[/C][/ROW]
[ROW][C]4[/C][C]-0.255157[/C][C]-1.9094[/C][C]0.030668[/C][/ROW]
[ROW][C]5[/C][C]-0.066392[/C][C]-0.4968[/C][C]0.310626[/C][/ROW]
[ROW][C]6[/C][C]0.135344[/C][C]1.0128[/C][C]0.157751[/C][/ROW]
[ROW][C]7[/C][C]0.12634[/C][C]0.9454[/C][C]0.174247[/C][/ROW]
[ROW][C]8[/C][C]-0.264939[/C][C]-1.9826[/C][C]0.026162[/C][/ROW]
[ROW][C]9[/C][C]0.012531[/C][C]0.0938[/C][C]0.462812[/C][/ROW]
[ROW][C]10[/C][C]-0.019092[/C][C]-0.1429[/C][C]0.443452[/C][/ROW]
[ROW][C]11[/C][C]0.187978[/C][C]1.4067[/C][C]0.082521[/C][/ROW]
[ROW][C]12[/C][C]-0.096688[/C][C]-0.7235[/C][C]0.236177[/C][/ROW]
[ROW][C]13[/C][C]-0.024984[/C][C]-0.187[/C][C]0.426183[/C][/ROW]
[ROW][C]14[/C][C]0.008745[/C][C]0.0654[/C][C]0.474028[/C][/ROW]
[ROW][C]15[/C][C]-0.088813[/C][C]-0.6646[/C][C]0.254512[/C][/ROW]
[ROW][C]16[/C][C]-0.11846[/C][C]-0.8865[/C][C]0.189577[/C][/ROW]
[ROW][C]17[/C][C]0.041191[/C][C]0.3082[/C][C]0.37952[/C][/ROW]
[ROW][C]18[/C][C]-0.133701[/C][C]-1.0005[/C][C]0.160679[/C][/ROW]
[ROW][C]19[/C][C]0.041136[/C][C]0.3078[/C][C]0.379676[/C][/ROW]
[ROW][C]20[/C][C]-0.05[/C][C]-0.3742[/C][C]0.354846[/C][/ROW]
[ROW][C]21[/C][C]0.050858[/C][C]0.3806[/C][C]0.352475[/C][/ROW]
[ROW][C]22[/C][C]0.00192[/C][C]0.0144[/C][C]0.494293[/C][/ROW]
[ROW][C]23[/C][C]-0.093174[/C][C]-0.6973[/C][C]0.244265[/C][/ROW]
[ROW][C]24[/C][C]-0.150636[/C][C]-1.1273[/C][C]0.132221[/C][/ROW]
[/TABLE]
Source: https://freestatistics.org/blog/index.php?pk=302369&T=2

Globally Unique Identifier (entire table): ba.freestatistics.org/blog/index.php?pk=302369&T=2

As an alternative you can also use a QR Code:  

The GUIDs for individual cells are displayed in the table below:

Partial Autocorrelation Function
Time lag kPACF(k)T-STATP-value
10.2707642.02620.023758
20.0294320.22030.413238
30.1404641.05110.148855
4-0.255157-1.90940.030668
5-0.066392-0.49680.310626
60.1353441.01280.157751
70.126340.94540.174247
8-0.264939-1.98260.026162
90.0125310.09380.462812
10-0.019092-0.14290.443452
110.1879781.40670.082521
12-0.096688-0.72350.236177
13-0.024984-0.1870.426183
140.0087450.06540.474028
15-0.088813-0.66460.254512
16-0.11846-0.88650.189577
170.0411910.30820.37952
18-0.133701-1.00050.160679
190.0411360.30780.379676
20-0.05-0.37420.354846
210.0508580.38060.352475
220.001920.01440.494293
23-0.093174-0.69730.244265
24-0.150636-1.12730.132221


Parameters (Session):
par1 = Default ; par2 = 1 ; par3 = 0 ; par4 = 1 ; par5 = 12 ; par6 = White Noise ; par7 = 0.95 ;
Parameters (R input):
par1 = 24 ; par2 = 1 ; par3 = 0 ; par4 = 1 ; par5 = 4 ; par6 = White Noise ; par7 = 0.95 ; par8 = ;
R code (references can be found in the software module):
par8 <- ''
par7 <- '0.95'
par6 <- 'White Noise'
par5 <- '4'
par4 <- '1'
par3 <- '0'
par2 <- '1'
par1 <- '24'
if (par1 == 'Default') {
par1 = 10*log10(length(x))
} else {
par1 <- as.numeric(par1)
}
par2 <- as.numeric(par2)
par3 <- as.numeric(par3)
par4 <- as.numeric(par4)
par5 <- as.numeric(par5)
if (par6 == 'White Noise') par6 <- 'white' else par6 <- 'ma'
par7 <- as.numeric(par7)
if (par8 != '') par8 <- as.numeric(par8)
x <- na.omit(x)
ox <- x
if (par8 == '') {
if (par2 == 0) {
x <- log(x)
} else {
x <- (x ^ par2 - 1) / par2
}
} else {
x <- log(x,base=par8)
}
if (par3 > 0) x <- diff(x,lag=1,difference=par3)
if (par4 > 0) x <- diff(x,lag=par5,difference=par4)
bitmap(file='picts.png')
op <- par(mfrow=c(2,1))
plot(ox,type='l',main='Original Time Series',xlab='time',ylab='value')
if (par8=='') {
mytitle <- paste('Working Time Series (lambda=',par2,', d=',par3,', D=',par4,')',sep='')
mysub <- paste('(lambda=',par2,', d=',par3,', D=',par4,', CI=', par7, ', CI type=',par6,')',sep='')
} else {
mytitle <- paste('Working Time Series (base=',par8,', d=',par3,', D=',par4,')',sep='')
mysub <- paste('(base=',par8,', d=',par3,', D=',par4,', CI=', par7, ', CI type=',par6,')',sep='')
}
plot(x,type='l', main=mytitle,xlab='time',ylab='value')
par(op)
dev.off()
bitmap(file='pic1.png')
racf <- acf(x, par1, main='Autocorrelation', xlab='time lag', ylab='ACF', ci.type=par6, ci=par7, sub=mysub)
dev.off()
bitmap(file='pic2.png')
rpacf <- pacf(x,par1,main='Partial Autocorrelation',xlab='lags',ylab='PACF',sub=mysub)
dev.off()
(myacf <- c(racf$acf))
(mypacf <- c(rpacf$acf))
lengthx <- length(x)
sqrtn <- sqrt(lengthx)
load(file='createtable')
a<-table.start()
a<-table.row.start(a)
a<-table.element(a,'Autocorrelation Function',4,TRUE)
a<-table.row.end(a)
a<-table.row.start(a)
a<-table.element(a,'Time lag k',header=TRUE)
a<-table.element(a,'ACF(k)',header=TRUE)
a<-table.element(a,'T-STAT',header=TRUE)
a<-table.element(a,'P-value',header=TRUE)
a<-table.row.end(a)
for (i in 2:(par1+1)) {
a<-table.row.start(a)
a<-table.element(a,i-1,header=TRUE)
a<-table.element(a,round(myacf[i],6))
mytstat <- myacf[i]*sqrtn
a<-table.element(a,round(mytstat,4))
a<-table.element(a,round(1-pt(abs(mytstat),lengthx),6))
a<-table.row.end(a)
}
a<-table.end(a)
table.save(a,file='mytable.tab')
a<-table.start()
a<-table.row.start(a)
a<-table.element(a,'Partial Autocorrelation Function',4,TRUE)
a<-table.row.end(a)
a<-table.row.start(a)
a<-table.element(a,'Time lag k',header=TRUE)
a<-table.element(a,'PACF(k)',header=TRUE)
a<-table.element(a,'T-STAT',header=TRUE)
a<-table.element(a,'P-value',header=TRUE)
a<-table.row.end(a)
for (i in 1:par1) {
a<-table.row.start(a)
a<-table.element(a,i,header=TRUE)
a<-table.element(a,round(mypacf[i],6))
mytstat <- mypacf[i]*sqrtn
a<-table.element(a,round(mytstat,4))
a<-table.element(a,round(1-pt(abs(mytstat),lengthx),6))
a<-table.row.end(a)
}
a<-table.end(a)
table.save(a,file='mytable1.tab')