Free Statistics

of Irreproducible Research!

Author's title

Author*The author of this computation has been verified*
R Software Modulerwasp_arimabackwardselection.wasp
Title produced by softwareARIMA Backward Selection
Date of computationWed, 21 Dec 2016 13:37:41 +0100
Cite this page as followsStatistical Computations at FreeStatistics.org, Office for Research Development and Education, URL https://freestatistics.org/blog/index.php?v=date/2016/Dec/21/t1482324010g0rowngpp2nnxil.htm/, Retrieved Fri, 17 May 2024 00:31:02 +0000
Statistical Computations at FreeStatistics.org, Office for Research Development and Education, URL https://freestatistics.org/blog/index.php?pk=302234, Retrieved Fri, 17 May 2024 00:31:02 +0000
QR Codes:

Original text written by user:
IsPrivate?No (this computation is public)
User-defined keywords
Estimated Impact66
Family? (F = Feedback message, R = changed R code, M = changed R Module, P = changed Parameters, D = changed Data)
-       [ARIMA Backward Selection] [ARIMA Backward Fo...] [2016-12-21 12:37:41] [7735a6b2a5b1338702c07df744ef5a34] [Current]
Feedback Forum

Post a new message
Dataseries X:
4956
5014.8
5053
5092.2
5126
5160
5188.8
5219.4
5255.6
5297
5349.8
5392.4
5429.8
5483.2
5540
5594.4
5650.2
5694
5741.8
5773.6
5816.8
5869.2
5927
5989.2
6038.8
6080.6
6111
6122.6
6154.4
6207
6231.2
6268.4
6309
6342.6
6376
6423.2
6465.2
6499.8
6552.2
6613.6
6658.6
6699.4
6763.4
6814.8
6869.4
6907.6
6936
6994.6
7043.2
7056.2
7068
7106.6
7141.2
7168.2
7184.6
7229.2
7273.4
7320.6
7350
7362.6
7411.2
7465.4
7510.2
7558.8
7605.4
7642.8
7681.6
7705
7729.8
7768.8
7810.4
7840.8
7855.4
7863.6
7904.4
7922.8
7929.4
7968
8018.6
8032.8
8052.6
8075.8
8106.4
8134.6
8140.6
8140
8152.2
8167.2
8166.6
8185
8203.8
8233.6
8251.6
8252.2
8235.6
8251.4
8293.8
8329.8
8342.4
8351.4
8347.8
8349.4
8337
8326
8313
8327.4
8346.4
8360.8
8374.6
8406
8406.2
8381.4
8379.8
8367.4
8372
8393.4


Summary of computational transaction
Raw Input view raw input (R code)
Raw Outputview raw output of R engine
Computing time3 seconds
R ServerBig Analytics Cloud Computing Center

\begin{tabular}{lllllllll}
\hline
Summary of computational transaction \tabularnewline
Raw Input view raw input (R code)  \tabularnewline
Raw Outputview raw output of R engine  \tabularnewline
Computing time3 seconds \tabularnewline
R ServerBig Analytics Cloud Computing Center \tabularnewline
\hline
\end{tabular}
%Source: https://freestatistics.org/blog/index.php?pk=302234&T=0

[TABLE]
[ROW]
Summary of computational transaction[/C][/ROW] [ROW]Raw Input[/C] view raw input (R code) [/C][/ROW] [ROW]Raw Output[/C]view raw output of R engine [/C][/ROW] [ROW]Computing time[/C]3 seconds[/C][/ROW] [ROW]R Server[/C]Big Analytics Cloud Computing Center[/C][/ROW] [/TABLE] Source: https://freestatistics.org/blog/index.php?pk=302234&T=0

Globally Unique Identifier (entire table): ba.freestatistics.org/blog/index.php?pk=302234&T=0

As an alternative you can also use a QR Code:  

The GUIDs for individual cells are displayed in the table below:

Summary of computational transaction
Raw Input view raw input (R code)
Raw Outputview raw output of R engine
Computing time3 seconds
R ServerBig Analytics Cloud Computing Center


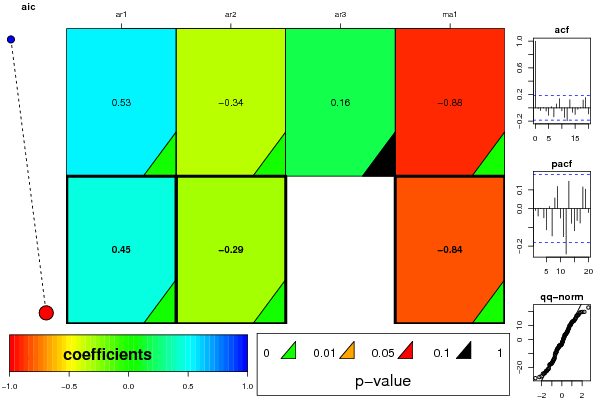
ARIMA Parameter Estimation and Backward Selection
Iterationar1ar2ar3ma1
Estimates ( 1 )0.5274-0.34480.1614-0.8815
(p-val)(0 )(9e-04 )(0.123 )(0 )
Estimates ( 2 )0.4474-0.2950-0.8399
(p-val)(0 )(0.0032 )(NA )(0 )
Estimates ( 3 )NANANANA
(p-val)(NA )(NA )(NA )(NA )
Estimates ( 4 )NANANANA
(p-val)(NA )(NA )(NA )(NA )
Estimates ( 5 )NANANANA
(p-val)(NA )(NA )(NA )(NA )
Estimates ( 6 )NANANANA
(p-val)(NA )(NA )(NA )(NA )
Estimates ( 7 )NANANANA
(p-val)(NA )(NA )(NA )(NA )

\begin{tabular}{lllllllll}
\hline
ARIMA Parameter Estimation and Backward Selection \tabularnewline
Iteration & ar1 & ar2 & ar3 & ma1 \tabularnewline
Estimates ( 1 ) & 0.5274 & -0.3448 & 0.1614 & -0.8815 \tabularnewline
(p-val) & (0 ) & (9e-04 ) & (0.123 ) & (0 ) \tabularnewline
Estimates ( 2 ) & 0.4474 & -0.295 & 0 & -0.8399 \tabularnewline
(p-val) & (0 ) & (0.0032 ) & (NA ) & (0 ) \tabularnewline
Estimates ( 3 ) & NA & NA & NA & NA \tabularnewline
(p-val) & (NA ) & (NA ) & (NA ) & (NA ) \tabularnewline
Estimates ( 4 ) & NA & NA & NA & NA \tabularnewline
(p-val) & (NA ) & (NA ) & (NA ) & (NA ) \tabularnewline
Estimates ( 5 ) & NA & NA & NA & NA \tabularnewline
(p-val) & (NA ) & (NA ) & (NA ) & (NA ) \tabularnewline
Estimates ( 6 ) & NA & NA & NA & NA \tabularnewline
(p-val) & (NA ) & (NA ) & (NA ) & (NA ) \tabularnewline
Estimates ( 7 ) & NA & NA & NA & NA \tabularnewline
(p-val) & (NA ) & (NA ) & (NA ) & (NA ) \tabularnewline
\hline
\end{tabular}
%Source: https://freestatistics.org/blog/index.php?pk=302234&T=1

[TABLE]
[ROW][C]ARIMA Parameter Estimation and Backward Selection[/C][/ROW]
[ROW][C]Iteration[/C][C]ar1[/C][C]ar2[/C][C]ar3[/C][C]ma1[/C][/ROW]
[ROW][C]Estimates ( 1 )[/C][C]0.5274[/C][C]-0.3448[/C][C]0.1614[/C][C]-0.8815[/C][/ROW]
[ROW][C](p-val)[/C][C](0 )[/C][C](9e-04 )[/C][C](0.123 )[/C][C](0 )[/C][/ROW]
[ROW][C]Estimates ( 2 )[/C][C]0.4474[/C][C]-0.295[/C][C]0[/C][C]-0.8399[/C][/ROW]
[ROW][C](p-val)[/C][C](0 )[/C][C](0.0032 )[/C][C](NA )[/C][C](0 )[/C][/ROW]
[ROW][C]Estimates ( 3 )[/C][C]NA[/C][C]NA[/C][C]NA[/C][C]NA[/C][/ROW]
[ROW][C](p-val)[/C][C](NA )[/C][C](NA )[/C][C](NA )[/C][C](NA )[/C][/ROW]
[ROW][C]Estimates ( 4 )[/C][C]NA[/C][C]NA[/C][C]NA[/C][C]NA[/C][/ROW]
[ROW][C](p-val)[/C][C](NA )[/C][C](NA )[/C][C](NA )[/C][C](NA )[/C][/ROW]
[ROW][C]Estimates ( 5 )[/C][C]NA[/C][C]NA[/C][C]NA[/C][C]NA[/C][/ROW]
[ROW][C](p-val)[/C][C](NA )[/C][C](NA )[/C][C](NA )[/C][C](NA )[/C][/ROW]
[ROW][C]Estimates ( 6 )[/C][C]NA[/C][C]NA[/C][C]NA[/C][C]NA[/C][/ROW]
[ROW][C](p-val)[/C][C](NA )[/C][C](NA )[/C][C](NA )[/C][C](NA )[/C][/ROW]
[ROW][C]Estimates ( 7 )[/C][C]NA[/C][C]NA[/C][C]NA[/C][C]NA[/C][/ROW]
[ROW][C](p-val)[/C][C](NA )[/C][C](NA )[/C][C](NA )[/C][C](NA )[/C][/ROW]
[/TABLE]
Source: https://freestatistics.org/blog/index.php?pk=302234&T=1

Globally Unique Identifier (entire table): ba.freestatistics.org/blog/index.php?pk=302234&T=1

As an alternative you can also use a QR Code:  

The GUIDs for individual cells are displayed in the table below:

ARIMA Parameter Estimation and Backward Selection
Iterationar1ar2ar3ma1
Estimates ( 1 )0.5274-0.34480.1614-0.8815
(p-val)(0 )(9e-04 )(0.123 )(0 )
Estimates ( 2 )0.4474-0.2950-0.8399
(p-val)(0 )(0.0032 )(NA )(0 )
Estimates ( 3 )NANANANA
(p-val)(NA )(NA )(NA )(NA )
Estimates ( 4 )NANANANA
(p-val)(NA )(NA )(NA )(NA )
Estimates ( 5 )NANANANA
(p-val)(NA )(NA )(NA )(NA )
Estimates ( 6 )NANANANA
(p-val)(NA )(NA )(NA )(NA )
Estimates ( 7 )NANANANA
(p-val)(NA )(NA )(NA )(NA )


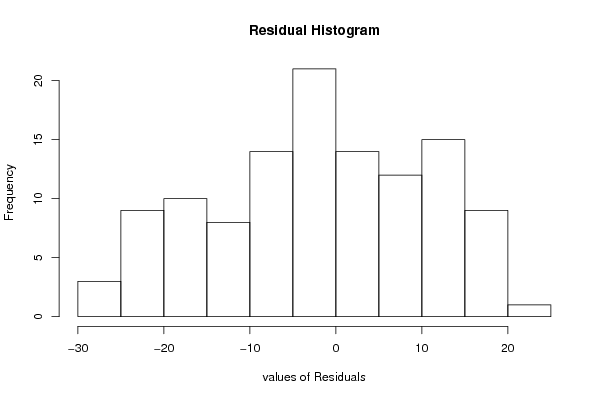
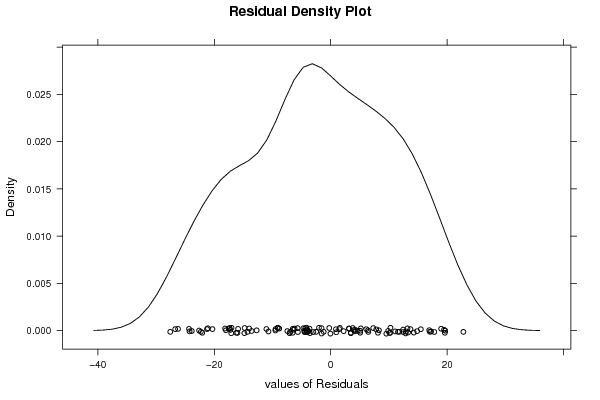
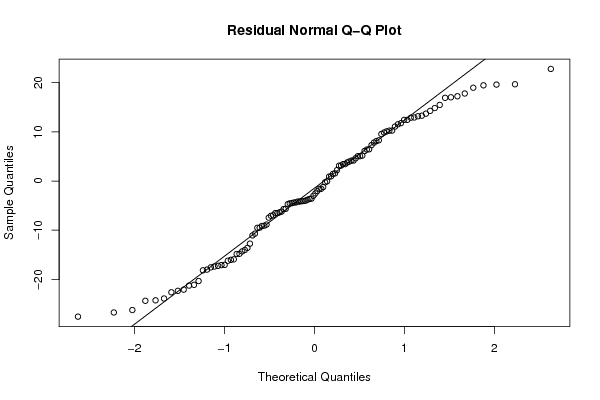
Estimated ARIMA Residuals
Value
-6.51766704299214
-17.244190464207
-1.21537425403081
-13.5853942898892
-4.37311991109549
-10.6939559891523
-3.58032059831223
-0.256039934211142
3.44080276748633
13.1657630939937
-3.79996297739268
-0.0547048633588768
13.2802580512932
6.45010777623067
7.80913927548662
8.10574315865265
-6.9725489185911
5.05524020645321
-18.00487700533
7.29114839696009
3.44708376923085
10.0933021851483
11.774028009721
-4.1666962534859
-4.18100404870314
-16.0231153159369
-27.5630244242881
3.14807819044811
8.27973444135007
-22.0713078749358
12.4325567453239
-5.64442884512701
-4.70327468923955
-1.58007665029287
9.5504284854997
-2.99803843765066
-2.51045310691515
15.4695233303198
11.5374421414854
-3.64473750192749
1.46611093843955
19.6006403562835
-6.35780906374408
12.9165232527079
-14.7894280639442
-11.051890477125
19.4550474035616
-9.50829231679509
-26.7146811956415
-14.296867283495
4.16995625231441
-9.12588961157772
-4.10176613595829
-15.9118452009936
17.7886794530651
-2.01843594881422
12.864700985051
-12.7303550257494
-17.5362665054015
22.7800471807121
3.77665906413462
6.09877122195349
10.2544194642312
0.890958162476292
-4.53284586570761
0.953106531475911
-18.147226739356
-4.50848265042268
3.95206086048398
1.56326598716941
-6.5232987929146
-17.0391852706864
-17.3691027507108
17.0240188642832
-24.2415339526621
-9.08433614146493
17.231112499927
9.86077208357858
-21.0990022055361
5.16971666722136
-9.48205706756329
5.05322873319731
-1.5794102173128
-20.3240256577078
-14.830332350391
-4.05917323542003
-6.2212450451147
-17.0825950498282
11.0678697921865
-5.69343844608063
14.8382687023129
-7.44896873058662
-14.0157213382814
-26.2225329662961
14.2601935105645
18.9622935217133
10.2341167489197
-7.0611905796487
-3.98362152246866
-21.2479095668342
-4.35066157844394
-24.340525283058
-8.84746367166404
-16.2033710142641
16.9131374846797
4.14425942095
6.3967949160765
4.62890924737181
19.6686004720279
-22.6077702871094
-22.3109467987543
3.11940223292531
-23.8690301258219
13.687526160847
12.4333388971332

\begin{tabular}{lllllllll}
\hline
Estimated ARIMA Residuals \tabularnewline
Value \tabularnewline
-6.51766704299214 \tabularnewline
-17.244190464207 \tabularnewline
-1.21537425403081 \tabularnewline
-13.5853942898892 \tabularnewline
-4.37311991109549 \tabularnewline
-10.6939559891523 \tabularnewline
-3.58032059831223 \tabularnewline
-0.256039934211142 \tabularnewline
3.44080276748633 \tabularnewline
13.1657630939937 \tabularnewline
-3.79996297739268 \tabularnewline
-0.0547048633588768 \tabularnewline
13.2802580512932 \tabularnewline
6.45010777623067 \tabularnewline
7.80913927548662 \tabularnewline
8.10574315865265 \tabularnewline
-6.9725489185911 \tabularnewline
5.05524020645321 \tabularnewline
-18.00487700533 \tabularnewline
7.29114839696009 \tabularnewline
3.44708376923085 \tabularnewline
10.0933021851483 \tabularnewline
11.774028009721 \tabularnewline
-4.1666962534859 \tabularnewline
-4.18100404870314 \tabularnewline
-16.0231153159369 \tabularnewline
-27.5630244242881 \tabularnewline
3.14807819044811 \tabularnewline
8.27973444135007 \tabularnewline
-22.0713078749358 \tabularnewline
12.4325567453239 \tabularnewline
-5.64442884512701 \tabularnewline
-4.70327468923955 \tabularnewline
-1.58007665029287 \tabularnewline
9.5504284854997 \tabularnewline
-2.99803843765066 \tabularnewline
-2.51045310691515 \tabularnewline
15.4695233303198 \tabularnewline
11.5374421414854 \tabularnewline
-3.64473750192749 \tabularnewline
1.46611093843955 \tabularnewline
19.6006403562835 \tabularnewline
-6.35780906374408 \tabularnewline
12.9165232527079 \tabularnewline
-14.7894280639442 \tabularnewline
-11.051890477125 \tabularnewline
19.4550474035616 \tabularnewline
-9.50829231679509 \tabularnewline
-26.7146811956415 \tabularnewline
-14.296867283495 \tabularnewline
4.16995625231441 \tabularnewline
-9.12588961157772 \tabularnewline
-4.10176613595829 \tabularnewline
-15.9118452009936 \tabularnewline
17.7886794530651 \tabularnewline
-2.01843594881422 \tabularnewline
12.864700985051 \tabularnewline
-12.7303550257494 \tabularnewline
-17.5362665054015 \tabularnewline
22.7800471807121 \tabularnewline
3.77665906413462 \tabularnewline
6.09877122195349 \tabularnewline
10.2544194642312 \tabularnewline
0.890958162476292 \tabularnewline
-4.53284586570761 \tabularnewline
0.953106531475911 \tabularnewline
-18.147226739356 \tabularnewline
-4.50848265042268 \tabularnewline
3.95206086048398 \tabularnewline
1.56326598716941 \tabularnewline
-6.5232987929146 \tabularnewline
-17.0391852706864 \tabularnewline
-17.3691027507108 \tabularnewline
17.0240188642832 \tabularnewline
-24.2415339526621 \tabularnewline
-9.08433614146493 \tabularnewline
17.231112499927 \tabularnewline
9.86077208357858 \tabularnewline
-21.0990022055361 \tabularnewline
5.16971666722136 \tabularnewline
-9.48205706756329 \tabularnewline
5.05322873319731 \tabularnewline
-1.5794102173128 \tabularnewline
-20.3240256577078 \tabularnewline
-14.830332350391 \tabularnewline
-4.05917323542003 \tabularnewline
-6.2212450451147 \tabularnewline
-17.0825950498282 \tabularnewline
11.0678697921865 \tabularnewline
-5.69343844608063 \tabularnewline
14.8382687023129 \tabularnewline
-7.44896873058662 \tabularnewline
-14.0157213382814 \tabularnewline
-26.2225329662961 \tabularnewline
14.2601935105645 \tabularnewline
18.9622935217133 \tabularnewline
10.2341167489197 \tabularnewline
-7.0611905796487 \tabularnewline
-3.98362152246866 \tabularnewline
-21.2479095668342 \tabularnewline
-4.35066157844394 \tabularnewline
-24.340525283058 \tabularnewline
-8.84746367166404 \tabularnewline
-16.2033710142641 \tabularnewline
16.9131374846797 \tabularnewline
4.14425942095 \tabularnewline
6.3967949160765 \tabularnewline
4.62890924737181 \tabularnewline
19.6686004720279 \tabularnewline
-22.6077702871094 \tabularnewline
-22.3109467987543 \tabularnewline
3.11940223292531 \tabularnewline
-23.8690301258219 \tabularnewline
13.687526160847 \tabularnewline
12.4333388971332 \tabularnewline
\hline
\end{tabular}
%Source: https://freestatistics.org/blog/index.php?pk=302234&T=2

[TABLE]
[ROW][C]Estimated ARIMA Residuals[/C][/ROW]
[ROW][C]Value[/C][/ROW]
[ROW][C]-6.51766704299214[/C][/ROW]
[ROW][C]-17.244190464207[/C][/ROW]
[ROW][C]-1.21537425403081[/C][/ROW]
[ROW][C]-13.5853942898892[/C][/ROW]
[ROW][C]-4.37311991109549[/C][/ROW]
[ROW][C]-10.6939559891523[/C][/ROW]
[ROW][C]-3.58032059831223[/C][/ROW]
[ROW][C]-0.256039934211142[/C][/ROW]
[ROW][C]3.44080276748633[/C][/ROW]
[ROW][C]13.1657630939937[/C][/ROW]
[ROW][C]-3.79996297739268[/C][/ROW]
[ROW][C]-0.0547048633588768[/C][/ROW]
[ROW][C]13.2802580512932[/C][/ROW]
[ROW][C]6.45010777623067[/C][/ROW]
[ROW][C]7.80913927548662[/C][/ROW]
[ROW][C]8.10574315865265[/C][/ROW]
[ROW][C]-6.9725489185911[/C][/ROW]
[ROW][C]5.05524020645321[/C][/ROW]
[ROW][C]-18.00487700533[/C][/ROW]
[ROW][C]7.29114839696009[/C][/ROW]
[ROW][C]3.44708376923085[/C][/ROW]
[ROW][C]10.0933021851483[/C][/ROW]
[ROW][C]11.774028009721[/C][/ROW]
[ROW][C]-4.1666962534859[/C][/ROW]
[ROW][C]-4.18100404870314[/C][/ROW]
[ROW][C]-16.0231153159369[/C][/ROW]
[ROW][C]-27.5630244242881[/C][/ROW]
[ROW][C]3.14807819044811[/C][/ROW]
[ROW][C]8.27973444135007[/C][/ROW]
[ROW][C]-22.0713078749358[/C][/ROW]
[ROW][C]12.4325567453239[/C][/ROW]
[ROW][C]-5.64442884512701[/C][/ROW]
[ROW][C]-4.70327468923955[/C][/ROW]
[ROW][C]-1.58007665029287[/C][/ROW]
[ROW][C]9.5504284854997[/C][/ROW]
[ROW][C]-2.99803843765066[/C][/ROW]
[ROW][C]-2.51045310691515[/C][/ROW]
[ROW][C]15.4695233303198[/C][/ROW]
[ROW][C]11.5374421414854[/C][/ROW]
[ROW][C]-3.64473750192749[/C][/ROW]
[ROW][C]1.46611093843955[/C][/ROW]
[ROW][C]19.6006403562835[/C][/ROW]
[ROW][C]-6.35780906374408[/C][/ROW]
[ROW][C]12.9165232527079[/C][/ROW]
[ROW][C]-14.7894280639442[/C][/ROW]
[ROW][C]-11.051890477125[/C][/ROW]
[ROW][C]19.4550474035616[/C][/ROW]
[ROW][C]-9.50829231679509[/C][/ROW]
[ROW][C]-26.7146811956415[/C][/ROW]
[ROW][C]-14.296867283495[/C][/ROW]
[ROW][C]4.16995625231441[/C][/ROW]
[ROW][C]-9.12588961157772[/C][/ROW]
[ROW][C]-4.10176613595829[/C][/ROW]
[ROW][C]-15.9118452009936[/C][/ROW]
[ROW][C]17.7886794530651[/C][/ROW]
[ROW][C]-2.01843594881422[/C][/ROW]
[ROW][C]12.864700985051[/C][/ROW]
[ROW][C]-12.7303550257494[/C][/ROW]
[ROW][C]-17.5362665054015[/C][/ROW]
[ROW][C]22.7800471807121[/C][/ROW]
[ROW][C]3.77665906413462[/C][/ROW]
[ROW][C]6.09877122195349[/C][/ROW]
[ROW][C]10.2544194642312[/C][/ROW]
[ROW][C]0.890958162476292[/C][/ROW]
[ROW][C]-4.53284586570761[/C][/ROW]
[ROW][C]0.953106531475911[/C][/ROW]
[ROW][C]-18.147226739356[/C][/ROW]
[ROW][C]-4.50848265042268[/C][/ROW]
[ROW][C]3.95206086048398[/C][/ROW]
[ROW][C]1.56326598716941[/C][/ROW]
[ROW][C]-6.5232987929146[/C][/ROW]
[ROW][C]-17.0391852706864[/C][/ROW]
[ROW][C]-17.3691027507108[/C][/ROW]
[ROW][C]17.0240188642832[/C][/ROW]
[ROW][C]-24.2415339526621[/C][/ROW]
[ROW][C]-9.08433614146493[/C][/ROW]
[ROW][C]17.231112499927[/C][/ROW]
[ROW][C]9.86077208357858[/C][/ROW]
[ROW][C]-21.0990022055361[/C][/ROW]
[ROW][C]5.16971666722136[/C][/ROW]
[ROW][C]-9.48205706756329[/C][/ROW]
[ROW][C]5.05322873319731[/C][/ROW]
[ROW][C]-1.5794102173128[/C][/ROW]
[ROW][C]-20.3240256577078[/C][/ROW]
[ROW][C]-14.830332350391[/C][/ROW]
[ROW][C]-4.05917323542003[/C][/ROW]
[ROW][C]-6.2212450451147[/C][/ROW]
[ROW][C]-17.0825950498282[/C][/ROW]
[ROW][C]11.0678697921865[/C][/ROW]
[ROW][C]-5.69343844608063[/C][/ROW]
[ROW][C]14.8382687023129[/C][/ROW]
[ROW][C]-7.44896873058662[/C][/ROW]
[ROW][C]-14.0157213382814[/C][/ROW]
[ROW][C]-26.2225329662961[/C][/ROW]
[ROW][C]14.2601935105645[/C][/ROW]
[ROW][C]18.9622935217133[/C][/ROW]
[ROW][C]10.2341167489197[/C][/ROW]
[ROW][C]-7.0611905796487[/C][/ROW]
[ROW][C]-3.98362152246866[/C][/ROW]
[ROW][C]-21.2479095668342[/C][/ROW]
[ROW][C]-4.35066157844394[/C][/ROW]
[ROW][C]-24.340525283058[/C][/ROW]
[ROW][C]-8.84746367166404[/C][/ROW]
[ROW][C]-16.2033710142641[/C][/ROW]
[ROW][C]16.9131374846797[/C][/ROW]
[ROW][C]4.14425942095[/C][/ROW]
[ROW][C]6.3967949160765[/C][/ROW]
[ROW][C]4.62890924737181[/C][/ROW]
[ROW][C]19.6686004720279[/C][/ROW]
[ROW][C]-22.6077702871094[/C][/ROW]
[ROW][C]-22.3109467987543[/C][/ROW]
[ROW][C]3.11940223292531[/C][/ROW]
[ROW][C]-23.8690301258219[/C][/ROW]
[ROW][C]13.687526160847[/C][/ROW]
[ROW][C]12.4333388971332[/C][/ROW]
[/TABLE]
Source: https://freestatistics.org/blog/index.php?pk=302234&T=2

Globally Unique Identifier (entire table): ba.freestatistics.org/blog/index.php?pk=302234&T=2

As an alternative you can also use a QR Code:  

The GUIDs for individual cells are displayed in the table below:

Estimated ARIMA Residuals
Value
-6.51766704299214
-17.244190464207
-1.21537425403081
-13.5853942898892
-4.37311991109549
-10.6939559891523
-3.58032059831223
-0.256039934211142
3.44080276748633
13.1657630939937
-3.79996297739268
-0.0547048633588768
13.2802580512932
6.45010777623067
7.80913927548662
8.10574315865265
-6.9725489185911
5.05524020645321
-18.00487700533
7.29114839696009
3.44708376923085
10.0933021851483
11.774028009721
-4.1666962534859
-4.18100404870314
-16.0231153159369
-27.5630244242881
3.14807819044811
8.27973444135007
-22.0713078749358
12.4325567453239
-5.64442884512701
-4.70327468923955
-1.58007665029287
9.5504284854997
-2.99803843765066
-2.51045310691515
15.4695233303198
11.5374421414854
-3.64473750192749
1.46611093843955
19.6006403562835
-6.35780906374408
12.9165232527079
-14.7894280639442
-11.051890477125
19.4550474035616
-9.50829231679509
-26.7146811956415
-14.296867283495
4.16995625231441
-9.12588961157772
-4.10176613595829
-15.9118452009936
17.7886794530651
-2.01843594881422
12.864700985051
-12.7303550257494
-17.5362665054015
22.7800471807121
3.77665906413462
6.09877122195349
10.2544194642312
0.890958162476292
-4.53284586570761
0.953106531475911
-18.147226739356
-4.50848265042268
3.95206086048398
1.56326598716941
-6.5232987929146
-17.0391852706864
-17.3691027507108
17.0240188642832
-24.2415339526621
-9.08433614146493
17.231112499927
9.86077208357858
-21.0990022055361
5.16971666722136
-9.48205706756329
5.05322873319731
-1.5794102173128
-20.3240256577078
-14.830332350391
-4.05917323542003
-6.2212450451147
-17.0825950498282
11.0678697921865
-5.69343844608063
14.8382687023129
-7.44896873058662
-14.0157213382814
-26.2225329662961
14.2601935105645
18.9622935217133
10.2341167489197
-7.0611905796487
-3.98362152246866
-21.2479095668342
-4.35066157844394
-24.340525283058
-8.84746367166404
-16.2033710142641
16.9131374846797
4.14425942095
6.3967949160765
4.62890924737181
19.6686004720279
-22.6077702871094
-22.3109467987543
3.11940223292531
-23.8690301258219
13.687526160847
12.4333388971332


Parameters (Session):
par1 = FALSE ; par2 = 1 ; par3 = 2 ; par4 = 0 ; par5 = 12 ; par6 = 3 ; par7 = 1 ; par8 = 0 ; par9 = 0 ;
Parameters (R input):
par1 = FALSE ; par2 = 1 ; par3 = 2 ; par4 = 0 ; par5 = 12 ; par6 = 3 ; par7 = 1 ; par8 = 0 ; par9 = 0 ;
R code (references can be found in the software module):
par9 <- '1'
par8 <- '2'
par7 <- '1'
par6 <- '3'
par5 <- '12'
par4 <- '0'
par3 <- '2'
par2 <- '1'
par1 <- 'FALSE'
library(lattice)
if (par1 == 'TRUE') par1 <- TRUE
if (par1 == 'FALSE') par1 <- FALSE
par2 <- as.numeric(par2) #Box-Cox lambda transformation parameter
par3 <- as.numeric(par3) #degree of non-seasonal differencing
par4 <- as.numeric(par4) #degree of seasonal differencing
par5 <- as.numeric(par5) #seasonal period
par6 <- as.numeric(par6) #degree (p) of the non-seasonal AR(p) polynomial
par7 <- as.numeric(par7) #degree (q) of the non-seasonal MA(q) polynomial
par8 <- as.numeric(par8) #degree (P) of the seasonal AR(P) polynomial
par9 <- as.numeric(par9) #degree (Q) of the seasonal MA(Q) polynomial
armaGR <- function(arima.out, names, n){
try1 <- arima.out$coef
try2 <- sqrt(diag(arima.out$var.coef))
try.data.frame <- data.frame(matrix(NA,ncol=4,nrow=length(names)))
dimnames(try.data.frame) <- list(names,c('coef','std','tstat','pv'))
try.data.frame[,1] <- try1
for(i in 1:length(try2)) try.data.frame[which(rownames(try.data.frame)==names(try2)[i]),2] <- try2[i]
try.data.frame[,3] <- try.data.frame[,1] / try.data.frame[,2]
try.data.frame[,4] <- round((1-pt(abs(try.data.frame[,3]),df=n-(length(try2)+1)))*2,5)
vector <- rep(NA,length(names))
vector[is.na(try.data.frame[,4])] <- 0
maxi <- which.max(try.data.frame[,4])
continue <- max(try.data.frame[,4],na.rm=TRUE) > .05
vector[maxi] <- 0
list(summary=try.data.frame,next.vector=vector,continue=continue)
}
arimaSelect <- function(series, order=c(13,0,0), seasonal=list(order=c(2,0,0),period=12), include.mean=F){
nrc <- order[1]+order[3]+seasonal$order[1]+seasonal$order[3]
coeff <- matrix(NA, nrow=nrc*2, ncol=nrc)
pval <- matrix(NA, nrow=nrc*2, ncol=nrc)
mylist <- rep(list(NULL), nrc)
names <- NULL
if(order[1] > 0) names <- paste('ar',1:order[1],sep='')
if(order[3] > 0) names <- c( names , paste('ma',1:order[3],sep='') )
if(seasonal$order[1] > 0) names <- c(names, paste('sar',1:seasonal$order[1],sep=''))
if(seasonal$order[3] > 0) names <- c(names, paste('sma',1:seasonal$order[3],sep=''))
arima.out <- arima(series, order=order, seasonal=seasonal, include.mean=include.mean, method='ML')
mylist[[1]] <- arima.out
last.arma <- armaGR(arima.out, names, length(series))
mystop <- FALSE
i <- 1
coeff[i,] <- last.arma[[1]][,1]
pval [i,] <- last.arma[[1]][,4]
i <- 2
aic <- arima.out$aic
while(!mystop){
mylist[[i]] <- arima.out
arima.out <- arima(series, order=order, seasonal=seasonal, include.mean=include.mean, method='ML', fixed=last.arma$next.vector)
aic <- c(aic, arima.out$aic)
last.arma <- armaGR(arima.out, names, length(series))
mystop <- !last.arma$continue
coeff[i,] <- last.arma[[1]][,1]
pval [i,] <- last.arma[[1]][,4]
i <- i+1
}
list(coeff, pval, mylist, aic=aic)
}
arimaSelectplot <- function(arimaSelect.out,noms,choix){
noms <- names(arimaSelect.out[[3]][[1]]$coef)
coeff <- arimaSelect.out[[1]]
k <- min(which(is.na(coeff[,1])))-1
coeff <- coeff[1:k,]
pval <- arimaSelect.out[[2]][1:k,]
aic <- arimaSelect.out$aic[1:k]
coeff[coeff==0] <- NA
n <- ncol(coeff)
if(missing(choix)) choix <- k
layout(matrix(c(1,1,1,2,
3,3,3,2,
3,3,3,4,
5,6,7,7),nr=4),
widths=c(10,35,45,15),
heights=c(30,30,15,15))
couleurs <- rainbow(75)[1:50]#(50)
ticks <- pretty(coeff)
par(mar=c(1,1,3,1))
plot(aic,k:1-.5,type='o',pch=21,bg='blue',cex=2,axes=F,lty=2,xpd=NA)
points(aic[choix],k-choix+.5,pch=21,cex=4,bg=2,xpd=NA)
title('aic',line=2)
par(mar=c(3,0,0,0))
plot(0,axes=F,xlab='',ylab='',xlim=range(ticks),ylim=c(.1,1))
rect(xleft = min(ticks) + (0:49)/50*(max(ticks)-min(ticks)),
xright = min(ticks) + (1:50)/50*(max(ticks)-min(ticks)),
ytop = rep(1,50),
ybottom= rep(0,50),col=couleurs,border=NA)
axis(1,ticks)
rect(xleft=min(ticks),xright=max(ticks),ytop=1,ybottom=0)
text(mean(coeff,na.rm=T),.5,'coefficients',cex=2,font=2)
par(mar=c(1,1,3,1))
image(1:n,1:k,t(coeff[k:1,]),axes=F,col=couleurs,zlim=range(ticks))
for(i in 1:n) for(j in 1:k) if(!is.na(coeff[j,i])) {
if(pval[j,i]<.01) symb = 'green'
else if( (pval[j,i]<.05) & (pval[j,i]>=.01)) symb = 'orange'
else if( (pval[j,i]<.1) & (pval[j,i]>=.05)) symb = 'red'
else symb = 'black'
polygon(c(i+.5 ,i+.2 ,i+.5 ,i+.5),
c(k-j+0.5,k-j+0.5,k-j+0.8,k-j+0.5),
col=symb)
if(j==choix) {
rect(xleft=i-.5,
xright=i+.5,
ybottom=k-j+1.5,
ytop=k-j+.5,
lwd=4)
text(i,
k-j+1,
round(coeff[j,i],2),
cex=1.2,
font=2)
}
else{
rect(xleft=i-.5,xright=i+.5,ybottom=k-j+1.5,ytop=k-j+.5)
text(i,k-j+1,round(coeff[j,i],2),cex=1.2,font=1)
}
}
axis(3,1:n,noms)
par(mar=c(0.5,0,0,0.5))
plot(0,axes=F,xlab='',ylab='',type='n',xlim=c(0,8),ylim=c(-.2,.8))
cols <- c('green','orange','red','black')
niv <- c('0','0.01','0.05','0.1')
for(i in 0:3){
polygon(c(1+2*i ,1+2*i ,1+2*i-.5 ,1+2*i),
c(.4 ,.7 , .4 , .4),
col=cols[i+1])
text(2*i,0.5,niv[i+1],cex=1.5)
}
text(8,.5,1,cex=1.5)
text(4,0,'p-value',cex=2)
box()
residus <- arimaSelect.out[[3]][[choix]]$res
par(mar=c(1,2,4,1))
acf(residus,main='')
title('acf',line=.5)
par(mar=c(1,2,4,1))
pacf(residus,main='')
title('pacf',line=.5)
par(mar=c(2,2,4,1))
qqnorm(residus,main='')
title('qq-norm',line=.5)
qqline(residus)
residus
}
if (par2 == 0) x <- log(x)
if (par2 != 0) x <- x^par2
(selection <- arimaSelect(x, order=c(par6,par3,par7), seasonal=list(order=c(par8,par4,par9), period=par5)))
bitmap(file='test1.png')
resid <- arimaSelectplot(selection)
dev.off()
resid
bitmap(file='test2.png')
acf(resid,length(resid)/2, main='Residual Autocorrelation Function')
dev.off()
bitmap(file='test3.png')
pacf(resid,length(resid)/2, main='Residual Partial Autocorrelation Function')
dev.off()
bitmap(file='test4.png')
cpgram(resid, main='Residual Cumulative Periodogram')
dev.off()
bitmap(file='test5.png')
hist(resid, main='Residual Histogram', xlab='values of Residuals')
dev.off()
bitmap(file='test6.png')
densityplot(~resid,col='black',main='Residual Density Plot', xlab='values of Residuals')
dev.off()
bitmap(file='test7.png')
qqnorm(resid, main='Residual Normal Q-Q Plot')
qqline(resid)
dev.off()
ncols <- length(selection[[1]][1,])
nrows <- length(selection[[2]][,1])-1
load(file='createtable')
a<-table.start()
a<-table.row.start(a)
a<-table.element(a,'ARIMA Parameter Estimation and Backward Selection', ncols+1,TRUE)
a<-table.row.end(a)
a<-table.row.start(a)
a<-table.element(a,'Iteration', header=TRUE)
for (i in 1:ncols) {
a<-table.element(a,names(selection[[3]][[1]]$coef)[i],header=TRUE)
}
a<-table.row.end(a)
for (j in 1:nrows) {
a<-table.row.start(a)
mydum <- 'Estimates ('
mydum <- paste(mydum,j)
mydum <- paste(mydum,')')
a<-table.element(a,mydum, header=TRUE)
for (i in 1:ncols) {
a<-table.element(a,round(selection[[1]][j,i],4))
}
a<-table.row.end(a)
a<-table.row.start(a)
a<-table.element(a,'(p-val)', header=TRUE)
for (i in 1:ncols) {
mydum <- '('
mydum <- paste(mydum,round(selection[[2]][j,i],4),sep='')
mydum <- paste(mydum,')')
a<-table.element(a,mydum)
}
a<-table.row.end(a)
}
a<-table.end(a)
table.save(a,file='mytable.tab')
a<-table.start()
a<-table.row.start(a)
a<-table.element(a,'Estimated ARIMA Residuals', 1,TRUE)
a<-table.row.end(a)
a<-table.row.start(a)
a<-table.element(a,'Value', 1,TRUE)
a<-table.row.end(a)
for (i in (par4*par5+par3):length(resid)) {
a<-table.row.start(a)
a<-table.element(a,resid[i])
a<-table.row.end(a)
}
a<-table.end(a)
table.save(a,file='mytable1.tab')