Free Statistics

of Irreproducible Research!

Author's title

Author*The author of this computation has been verified*
R Software Modulerwasp_autocorrelation.wasp
Title produced by software(Partial) Autocorrelation Function
Date of computationMon, 19 Dec 2016 22:59:36 +0100
Cite this page as followsStatistical Computations at FreeStatistics.org, Office for Research Development and Education, URL https://freestatistics.org/blog/index.php?v=date/2016/Dec/19/t1482185092ad6jky9e39gs3wg.htm/, Retrieved Fri, 17 May 2024 15:48:28 +0000
Statistical Computations at FreeStatistics.org, Office for Research Development and Education, URL https://freestatistics.org/blog/index.php?pk=301535, Retrieved Fri, 17 May 2024 15:48:28 +0000
QR Codes:

Original text written by user:
IsPrivate?No (this computation is public)
User-defined keywords
Estimated Impact65
Family? (F = Feedback message, R = changed R code, M = changed R Module, P = changed Parameters, D = changed Data)
-       [(Partial) Autocorrelation Function] [] [2016-12-19 21:59:36] [b2e25925e4919b0d6985405fcb461c0d] [Current]
Feedback Forum

Post a new message
Dataseries X:
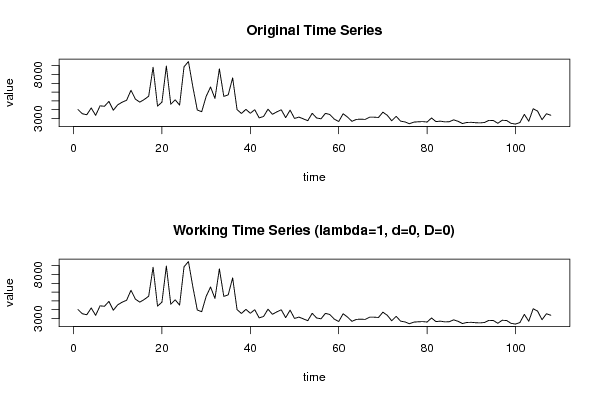
4020
3540
3430
4200
3360
4440
4390
4940
3940
4560
4850
5070
6210
5200
4860
5160
5530
8830
4410
4850
8960
4620
5120
4520
8870
9470
6590
3970
3770
5500
6580
5280
8640
5510
5690
7620
4010
3570
4040
3600
4000
3070
3230
4060
3480
3750
3990
3100
3950
3010
3160
2960
2750
3590
3060
2970
3590
3450
2930
2660
3540
3160
2680
2900
2920
2900
3150
3150
3120
3720
3360
2740
3250
2700
2610
2410
2590
2630
2650
2600
3060
2650
2700
2620
2630
2850
2680
2430
2550
2570
2520
2500
2550
2790
2770
2460
2800
2770
2450
2370
2540
3470
2690
4110
3840
2860
3540
3370


Summary of computational transaction
Raw Input view raw input (R code)
Raw Outputview raw output of R engine
Computing time1 seconds
R ServerBig Analytics Cloud Computing Center

\begin{tabular}{lllllllll}
\hline
Summary of computational transaction \tabularnewline
Raw Input view raw input (R code)  \tabularnewline
Raw Outputview raw output of R engine  \tabularnewline
Computing time1 seconds \tabularnewline
R ServerBig Analytics Cloud Computing Center \tabularnewline
\hline
\end{tabular}
%Source: https://freestatistics.org/blog/index.php?pk=301535&T=0

[TABLE]
[ROW]
Summary of computational transaction[/C][/ROW] [ROW]Raw Input[/C] view raw input (R code) [/C][/ROW] [ROW]Raw Output[/C]view raw output of R engine [/C][/ROW] [ROW]Computing time[/C]1 seconds[/C][/ROW] [ROW]R Server[/C]Big Analytics Cloud Computing Center[/C][/ROW] [/TABLE] Source: https://freestatistics.org/blog/index.php?pk=301535&T=0

Globally Unique Identifier (entire table): ba.freestatistics.org/blog/index.php?pk=301535&T=0

As an alternative you can also use a QR Code:  

The GUIDs for individual cells are displayed in the table below:

Summary of computational transaction
Raw Input view raw input (R code)
Raw Outputview raw output of R engine
Computing time1 seconds
R ServerBig Analytics Cloud Computing Center


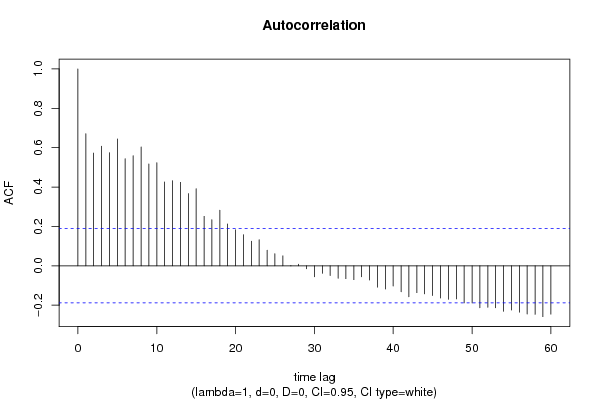
Autocorrelation Function
Time lag kACF(k)T-STATP-value
10.6708776.9720
20.5725775.95040
30.6078456.31690
40.5748185.97370
50.6440536.69320
60.5440335.65380
70.5595125.81460
80.6039936.27690
90.5173855.37680
100.5238475.4440
110.4260234.42741.1e-05
120.431954.4899e-06
130.4241354.40771.2e-05
140.3667133.8110.000115
150.3916694.07034.5e-05
160.2512812.61140.00515
170.2338512.43020.008368
180.2822942.93370.002046
190.2122342.20560.014766
200.182651.89820.030173
210.1580351.64230.051713
220.1250551.29960.098251
230.1328051.38010.085196
240.0791460.82250.2063
250.0617210.64140.261304
260.0506840.52670.299734
27-0.000888-0.00920.496325
280.0083960.08730.465314
29-0.014652-0.15230.439631
30-0.055693-0.57880.281973
31-0.037873-0.39360.347331
32-0.049059-0.50980.305603
33-0.063187-0.65670.256397
34-0.065034-0.67590.25029
35-0.070158-0.72910.233759
36-0.055255-0.57420.283503
37-0.07188-0.7470.228345
38-0.108148-1.12390.131772
39-0.117672-1.22290.112017
40-0.102831-1.06870.143804
41-0.131777-1.36950.086848
42-0.157446-1.63620.052351
43-0.136159-1.4150.079973
44-0.142299-1.47880.07105
45-0.150424-1.56330.060459
46-0.163472-1.69890.046113
47-0.169613-1.76270.040393
48-0.168019-1.74610.041818
49-0.188198-1.95580.026535
50-0.188537-1.95930.026326
51-0.212888-2.21240.014522
52-0.210111-2.18350.01558
53-0.212612-2.20950.014624
54-0.230793-2.39850.009089
55-0.224421-2.33230.010771
56-0.235356-2.44590.008032
57-0.244679-2.54280.006207
58-0.246399-2.56070.005914
59-0.258105-2.68230.00423
60-0.245482-2.55110.006069

\begin{tabular}{lllllllll}
\hline
Autocorrelation Function \tabularnewline
Time lag k & ACF(k) & T-STAT & P-value \tabularnewline
1 & 0.670877 & 6.972 & 0 \tabularnewline
2 & 0.572577 & 5.9504 & 0 \tabularnewline
3 & 0.607845 & 6.3169 & 0 \tabularnewline
4 & 0.574818 & 5.9737 & 0 \tabularnewline
5 & 0.644053 & 6.6932 & 0 \tabularnewline
6 & 0.544033 & 5.6538 & 0 \tabularnewline
7 & 0.559512 & 5.8146 & 0 \tabularnewline
8 & 0.603993 & 6.2769 & 0 \tabularnewline
9 & 0.517385 & 5.3768 & 0 \tabularnewline
10 & 0.523847 & 5.444 & 0 \tabularnewline
11 & 0.426023 & 4.4274 & 1.1e-05 \tabularnewline
12 & 0.43195 & 4.489 & 9e-06 \tabularnewline
13 & 0.424135 & 4.4077 & 1.2e-05 \tabularnewline
14 & 0.366713 & 3.811 & 0.000115 \tabularnewline
15 & 0.391669 & 4.0703 & 4.5e-05 \tabularnewline
16 & 0.251281 & 2.6114 & 0.00515 \tabularnewline
17 & 0.233851 & 2.4302 & 0.008368 \tabularnewline
18 & 0.282294 & 2.9337 & 0.002046 \tabularnewline
19 & 0.212234 & 2.2056 & 0.014766 \tabularnewline
20 & 0.18265 & 1.8982 & 0.030173 \tabularnewline
21 & 0.158035 & 1.6423 & 0.051713 \tabularnewline
22 & 0.125055 & 1.2996 & 0.098251 \tabularnewline
23 & 0.132805 & 1.3801 & 0.085196 \tabularnewline
24 & 0.079146 & 0.8225 & 0.2063 \tabularnewline
25 & 0.061721 & 0.6414 & 0.261304 \tabularnewline
26 & 0.050684 & 0.5267 & 0.299734 \tabularnewline
27 & -0.000888 & -0.0092 & 0.496325 \tabularnewline
28 & 0.008396 & 0.0873 & 0.465314 \tabularnewline
29 & -0.014652 & -0.1523 & 0.439631 \tabularnewline
30 & -0.055693 & -0.5788 & 0.281973 \tabularnewline
31 & -0.037873 & -0.3936 & 0.347331 \tabularnewline
32 & -0.049059 & -0.5098 & 0.305603 \tabularnewline
33 & -0.063187 & -0.6567 & 0.256397 \tabularnewline
34 & -0.065034 & -0.6759 & 0.25029 \tabularnewline
35 & -0.070158 & -0.7291 & 0.233759 \tabularnewline
36 & -0.055255 & -0.5742 & 0.283503 \tabularnewline
37 & -0.07188 & -0.747 & 0.228345 \tabularnewline
38 & -0.108148 & -1.1239 & 0.131772 \tabularnewline
39 & -0.117672 & -1.2229 & 0.112017 \tabularnewline
40 & -0.102831 & -1.0687 & 0.143804 \tabularnewline
41 & -0.131777 & -1.3695 & 0.086848 \tabularnewline
42 & -0.157446 & -1.6362 & 0.052351 \tabularnewline
43 & -0.136159 & -1.415 & 0.079973 \tabularnewline
44 & -0.142299 & -1.4788 & 0.07105 \tabularnewline
45 & -0.150424 & -1.5633 & 0.060459 \tabularnewline
46 & -0.163472 & -1.6989 & 0.046113 \tabularnewline
47 & -0.169613 & -1.7627 & 0.040393 \tabularnewline
48 & -0.168019 & -1.7461 & 0.041818 \tabularnewline
49 & -0.188198 & -1.9558 & 0.026535 \tabularnewline
50 & -0.188537 & -1.9593 & 0.026326 \tabularnewline
51 & -0.212888 & -2.2124 & 0.014522 \tabularnewline
52 & -0.210111 & -2.1835 & 0.01558 \tabularnewline
53 & -0.212612 & -2.2095 & 0.014624 \tabularnewline
54 & -0.230793 & -2.3985 & 0.009089 \tabularnewline
55 & -0.224421 & -2.3323 & 0.010771 \tabularnewline
56 & -0.235356 & -2.4459 & 0.008032 \tabularnewline
57 & -0.244679 & -2.5428 & 0.006207 \tabularnewline
58 & -0.246399 & -2.5607 & 0.005914 \tabularnewline
59 & -0.258105 & -2.6823 & 0.00423 \tabularnewline
60 & -0.245482 & -2.5511 & 0.006069 \tabularnewline
\hline
\end{tabular}
%Source: https://freestatistics.org/blog/index.php?pk=301535&T=1

[TABLE]
[ROW][C]Autocorrelation Function[/C][/ROW]
[ROW][C]Time lag k[/C][C]ACF(k)[/C][C]T-STAT[/C][C]P-value[/C][/ROW]
[ROW][C]1[/C][C]0.670877[/C][C]6.972[/C][C]0[/C][/ROW]
[ROW][C]2[/C][C]0.572577[/C][C]5.9504[/C][C]0[/C][/ROW]
[ROW][C]3[/C][C]0.607845[/C][C]6.3169[/C][C]0[/C][/ROW]
[ROW][C]4[/C][C]0.574818[/C][C]5.9737[/C][C]0[/C][/ROW]
[ROW][C]5[/C][C]0.644053[/C][C]6.6932[/C][C]0[/C][/ROW]
[ROW][C]6[/C][C]0.544033[/C][C]5.6538[/C][C]0[/C][/ROW]
[ROW][C]7[/C][C]0.559512[/C][C]5.8146[/C][C]0[/C][/ROW]
[ROW][C]8[/C][C]0.603993[/C][C]6.2769[/C][C]0[/C][/ROW]
[ROW][C]9[/C][C]0.517385[/C][C]5.3768[/C][C]0[/C][/ROW]
[ROW][C]10[/C][C]0.523847[/C][C]5.444[/C][C]0[/C][/ROW]
[ROW][C]11[/C][C]0.426023[/C][C]4.4274[/C][C]1.1e-05[/C][/ROW]
[ROW][C]12[/C][C]0.43195[/C][C]4.489[/C][C]9e-06[/C][/ROW]
[ROW][C]13[/C][C]0.424135[/C][C]4.4077[/C][C]1.2e-05[/C][/ROW]
[ROW][C]14[/C][C]0.366713[/C][C]3.811[/C][C]0.000115[/C][/ROW]
[ROW][C]15[/C][C]0.391669[/C][C]4.0703[/C][C]4.5e-05[/C][/ROW]
[ROW][C]16[/C][C]0.251281[/C][C]2.6114[/C][C]0.00515[/C][/ROW]
[ROW][C]17[/C][C]0.233851[/C][C]2.4302[/C][C]0.008368[/C][/ROW]
[ROW][C]18[/C][C]0.282294[/C][C]2.9337[/C][C]0.002046[/C][/ROW]
[ROW][C]19[/C][C]0.212234[/C][C]2.2056[/C][C]0.014766[/C][/ROW]
[ROW][C]20[/C][C]0.18265[/C][C]1.8982[/C][C]0.030173[/C][/ROW]
[ROW][C]21[/C][C]0.158035[/C][C]1.6423[/C][C]0.051713[/C][/ROW]
[ROW][C]22[/C][C]0.125055[/C][C]1.2996[/C][C]0.098251[/C][/ROW]
[ROW][C]23[/C][C]0.132805[/C][C]1.3801[/C][C]0.085196[/C][/ROW]
[ROW][C]24[/C][C]0.079146[/C][C]0.8225[/C][C]0.2063[/C][/ROW]
[ROW][C]25[/C][C]0.061721[/C][C]0.6414[/C][C]0.261304[/C][/ROW]
[ROW][C]26[/C][C]0.050684[/C][C]0.5267[/C][C]0.299734[/C][/ROW]
[ROW][C]27[/C][C]-0.000888[/C][C]-0.0092[/C][C]0.496325[/C][/ROW]
[ROW][C]28[/C][C]0.008396[/C][C]0.0873[/C][C]0.465314[/C][/ROW]
[ROW][C]29[/C][C]-0.014652[/C][C]-0.1523[/C][C]0.439631[/C][/ROW]
[ROW][C]30[/C][C]-0.055693[/C][C]-0.5788[/C][C]0.281973[/C][/ROW]
[ROW][C]31[/C][C]-0.037873[/C][C]-0.3936[/C][C]0.347331[/C][/ROW]
[ROW][C]32[/C][C]-0.049059[/C][C]-0.5098[/C][C]0.305603[/C][/ROW]
[ROW][C]33[/C][C]-0.063187[/C][C]-0.6567[/C][C]0.256397[/C][/ROW]
[ROW][C]34[/C][C]-0.065034[/C][C]-0.6759[/C][C]0.25029[/C][/ROW]
[ROW][C]35[/C][C]-0.070158[/C][C]-0.7291[/C][C]0.233759[/C][/ROW]
[ROW][C]36[/C][C]-0.055255[/C][C]-0.5742[/C][C]0.283503[/C][/ROW]
[ROW][C]37[/C][C]-0.07188[/C][C]-0.747[/C][C]0.228345[/C][/ROW]
[ROW][C]38[/C][C]-0.108148[/C][C]-1.1239[/C][C]0.131772[/C][/ROW]
[ROW][C]39[/C][C]-0.117672[/C][C]-1.2229[/C][C]0.112017[/C][/ROW]
[ROW][C]40[/C][C]-0.102831[/C][C]-1.0687[/C][C]0.143804[/C][/ROW]
[ROW][C]41[/C][C]-0.131777[/C][C]-1.3695[/C][C]0.086848[/C][/ROW]
[ROW][C]42[/C][C]-0.157446[/C][C]-1.6362[/C][C]0.052351[/C][/ROW]
[ROW][C]43[/C][C]-0.136159[/C][C]-1.415[/C][C]0.079973[/C][/ROW]
[ROW][C]44[/C][C]-0.142299[/C][C]-1.4788[/C][C]0.07105[/C][/ROW]
[ROW][C]45[/C][C]-0.150424[/C][C]-1.5633[/C][C]0.060459[/C][/ROW]
[ROW][C]46[/C][C]-0.163472[/C][C]-1.6989[/C][C]0.046113[/C][/ROW]
[ROW][C]47[/C][C]-0.169613[/C][C]-1.7627[/C][C]0.040393[/C][/ROW]
[ROW][C]48[/C][C]-0.168019[/C][C]-1.7461[/C][C]0.041818[/C][/ROW]
[ROW][C]49[/C][C]-0.188198[/C][C]-1.9558[/C][C]0.026535[/C][/ROW]
[ROW][C]50[/C][C]-0.188537[/C][C]-1.9593[/C][C]0.026326[/C][/ROW]
[ROW][C]51[/C][C]-0.212888[/C][C]-2.2124[/C][C]0.014522[/C][/ROW]
[ROW][C]52[/C][C]-0.210111[/C][C]-2.1835[/C][C]0.01558[/C][/ROW]
[ROW][C]53[/C][C]-0.212612[/C][C]-2.2095[/C][C]0.014624[/C][/ROW]
[ROW][C]54[/C][C]-0.230793[/C][C]-2.3985[/C][C]0.009089[/C][/ROW]
[ROW][C]55[/C][C]-0.224421[/C][C]-2.3323[/C][C]0.010771[/C][/ROW]
[ROW][C]56[/C][C]-0.235356[/C][C]-2.4459[/C][C]0.008032[/C][/ROW]
[ROW][C]57[/C][C]-0.244679[/C][C]-2.5428[/C][C]0.006207[/C][/ROW]
[ROW][C]58[/C][C]-0.246399[/C][C]-2.5607[/C][C]0.005914[/C][/ROW]
[ROW][C]59[/C][C]-0.258105[/C][C]-2.6823[/C][C]0.00423[/C][/ROW]
[ROW][C]60[/C][C]-0.245482[/C][C]-2.5511[/C][C]0.006069[/C][/ROW]
[/TABLE]
Source: https://freestatistics.org/blog/index.php?pk=301535&T=1

Globally Unique Identifier (entire table): ba.freestatistics.org/blog/index.php?pk=301535&T=1

As an alternative you can also use a QR Code:  

The GUIDs for individual cells are displayed in the table below:

Autocorrelation Function
Time lag kACF(k)T-STATP-value
10.6708776.9720
20.5725775.95040
30.6078456.31690
40.5748185.97370
50.6440536.69320
60.5440335.65380
70.5595125.81460
80.6039936.27690
90.5173855.37680
100.5238475.4440
110.4260234.42741.1e-05
120.431954.4899e-06
130.4241354.40771.2e-05
140.3667133.8110.000115
150.3916694.07034.5e-05
160.2512812.61140.00515
170.2338512.43020.008368
180.2822942.93370.002046
190.2122342.20560.014766
200.182651.89820.030173
210.1580351.64230.051713
220.1250551.29960.098251
230.1328051.38010.085196
240.0791460.82250.2063
250.0617210.64140.261304
260.0506840.52670.299734
27-0.000888-0.00920.496325
280.0083960.08730.465314
29-0.014652-0.15230.439631
30-0.055693-0.57880.281973
31-0.037873-0.39360.347331
32-0.049059-0.50980.305603
33-0.063187-0.65670.256397
34-0.065034-0.67590.25029
35-0.070158-0.72910.233759
36-0.055255-0.57420.283503
37-0.07188-0.7470.228345
38-0.108148-1.12390.131772
39-0.117672-1.22290.112017
40-0.102831-1.06870.143804
41-0.131777-1.36950.086848
42-0.157446-1.63620.052351
43-0.136159-1.4150.079973
44-0.142299-1.47880.07105
45-0.150424-1.56330.060459
46-0.163472-1.69890.046113
47-0.169613-1.76270.040393
48-0.168019-1.74610.041818
49-0.188198-1.95580.026535
50-0.188537-1.95930.026326
51-0.212888-2.21240.014522
52-0.210111-2.18350.01558
53-0.212612-2.20950.014624
54-0.230793-2.39850.009089
55-0.224421-2.33230.010771
56-0.235356-2.44590.008032
57-0.244679-2.54280.006207
58-0.246399-2.56070.005914
59-0.258105-2.68230.00423
60-0.245482-2.55110.006069


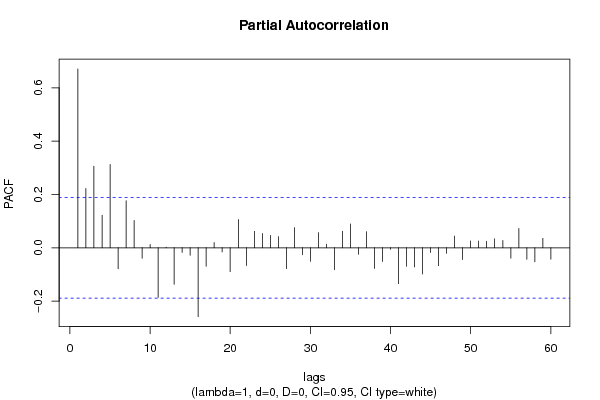
Partial Autocorrelation Function
Time lag kPACF(k)T-STATP-value
10.6708776.9720
20.222762.3150.011252
30.3058353.17830.000966
40.1221411.26930.103526
50.3124883.24750.000776
6-0.07853-0.81610.208118
70.1762541.83170.034877
80.1022791.06290.145097
9-0.039323-0.40870.341801
100.0120860.12560.45014
11-0.186121-1.93420.027851
120.0021480.02230.491118
13-0.136907-1.42280.07884
14-0.017322-0.180.42874
15-0.028153-0.29260.385206
16-0.258283-2.68420.004209
17-0.069563-0.72290.235646
180.0198070.20580.418651
19-0.015424-0.16030.436475
20-0.089547-0.93060.177069
210.106271.10440.135939
22-0.066499-0.69110.245499
230.0615360.63950.261927
240.0538140.55920.288576
250.0464990.48320.314955
260.0419630.43610.331821
27-0.078206-0.81270.209079
280.075850.78830.216137
29-0.026393-0.27430.392193
30-0.050538-0.52520.30026
310.0570110.59250.277385
320.0135420.14070.444172
33-0.082277-0.8550.19721
340.062420.64870.25896
350.0893960.9290.177472
36-0.024343-0.2530.400384
370.0602310.62590.266337
38-0.077761-0.80810.210401
39-0.051718-0.53750.296024
40-0.00542-0.05630.477593
41-0.135074-1.40370.081635
42-0.069528-0.72260.235758
43-0.072215-0.75050.227297
44-0.098114-1.01960.15509
45-0.017638-0.18330.427453
46-0.067019-0.69650.243812
47-0.02095-0.21770.414028
480.0438420.45560.32479
49-0.044234-0.45970.323332
500.0254870.26490.395806
510.0251680.26160.397082
520.0248870.25860.398207
530.0334520.34760.364391
540.0274410.28520.388027
55-0.038747-0.40270.343993
560.0725050.75350.226397
57-0.042763-0.44440.32882
58-0.052629-0.54690.292775
590.0354340.36820.356708
60-0.042428-0.44090.330073

\begin{tabular}{lllllllll}
\hline
Partial Autocorrelation Function \tabularnewline
Time lag k & PACF(k) & T-STAT & P-value \tabularnewline
1 & 0.670877 & 6.972 & 0 \tabularnewline
2 & 0.22276 & 2.315 & 0.011252 \tabularnewline
3 & 0.305835 & 3.1783 & 0.000966 \tabularnewline
4 & 0.122141 & 1.2693 & 0.103526 \tabularnewline
5 & 0.312488 & 3.2475 & 0.000776 \tabularnewline
6 & -0.07853 & -0.8161 & 0.208118 \tabularnewline
7 & 0.176254 & 1.8317 & 0.034877 \tabularnewline
8 & 0.102279 & 1.0629 & 0.145097 \tabularnewline
9 & -0.039323 & -0.4087 & 0.341801 \tabularnewline
10 & 0.012086 & 0.1256 & 0.45014 \tabularnewline
11 & -0.186121 & -1.9342 & 0.027851 \tabularnewline
12 & 0.002148 & 0.0223 & 0.491118 \tabularnewline
13 & -0.136907 & -1.4228 & 0.07884 \tabularnewline
14 & -0.017322 & -0.18 & 0.42874 \tabularnewline
15 & -0.028153 & -0.2926 & 0.385206 \tabularnewline
16 & -0.258283 & -2.6842 & 0.004209 \tabularnewline
17 & -0.069563 & -0.7229 & 0.235646 \tabularnewline
18 & 0.019807 & 0.2058 & 0.418651 \tabularnewline
19 & -0.015424 & -0.1603 & 0.436475 \tabularnewline
20 & -0.089547 & -0.9306 & 0.177069 \tabularnewline
21 & 0.10627 & 1.1044 & 0.135939 \tabularnewline
22 & -0.066499 & -0.6911 & 0.245499 \tabularnewline
23 & 0.061536 & 0.6395 & 0.261927 \tabularnewline
24 & 0.053814 & 0.5592 & 0.288576 \tabularnewline
25 & 0.046499 & 0.4832 & 0.314955 \tabularnewline
26 & 0.041963 & 0.4361 & 0.331821 \tabularnewline
27 & -0.078206 & -0.8127 & 0.209079 \tabularnewline
28 & 0.07585 & 0.7883 & 0.216137 \tabularnewline
29 & -0.026393 & -0.2743 & 0.392193 \tabularnewline
30 & -0.050538 & -0.5252 & 0.30026 \tabularnewline
31 & 0.057011 & 0.5925 & 0.277385 \tabularnewline
32 & 0.013542 & 0.1407 & 0.444172 \tabularnewline
33 & -0.082277 & -0.855 & 0.19721 \tabularnewline
34 & 0.06242 & 0.6487 & 0.25896 \tabularnewline
35 & 0.089396 & 0.929 & 0.177472 \tabularnewline
36 & -0.024343 & -0.253 & 0.400384 \tabularnewline
37 & 0.060231 & 0.6259 & 0.266337 \tabularnewline
38 & -0.077761 & -0.8081 & 0.210401 \tabularnewline
39 & -0.051718 & -0.5375 & 0.296024 \tabularnewline
40 & -0.00542 & -0.0563 & 0.477593 \tabularnewline
41 & -0.135074 & -1.4037 & 0.081635 \tabularnewline
42 & -0.069528 & -0.7226 & 0.235758 \tabularnewline
43 & -0.072215 & -0.7505 & 0.227297 \tabularnewline
44 & -0.098114 & -1.0196 & 0.15509 \tabularnewline
45 & -0.017638 & -0.1833 & 0.427453 \tabularnewline
46 & -0.067019 & -0.6965 & 0.243812 \tabularnewline
47 & -0.02095 & -0.2177 & 0.414028 \tabularnewline
48 & 0.043842 & 0.4556 & 0.32479 \tabularnewline
49 & -0.044234 & -0.4597 & 0.323332 \tabularnewline
50 & 0.025487 & 0.2649 & 0.395806 \tabularnewline
51 & 0.025168 & 0.2616 & 0.397082 \tabularnewline
52 & 0.024887 & 0.2586 & 0.398207 \tabularnewline
53 & 0.033452 & 0.3476 & 0.364391 \tabularnewline
54 & 0.027441 & 0.2852 & 0.388027 \tabularnewline
55 & -0.038747 & -0.4027 & 0.343993 \tabularnewline
56 & 0.072505 & 0.7535 & 0.226397 \tabularnewline
57 & -0.042763 & -0.4444 & 0.32882 \tabularnewline
58 & -0.052629 & -0.5469 & 0.292775 \tabularnewline
59 & 0.035434 & 0.3682 & 0.356708 \tabularnewline
60 & -0.042428 & -0.4409 & 0.330073 \tabularnewline
\hline
\end{tabular}
%Source: https://freestatistics.org/blog/index.php?pk=301535&T=2

[TABLE]
[ROW][C]Partial Autocorrelation Function[/C][/ROW]
[ROW][C]Time lag k[/C][C]PACF(k)[/C][C]T-STAT[/C][C]P-value[/C][/ROW]
[ROW][C]1[/C][C]0.670877[/C][C]6.972[/C][C]0[/C][/ROW]
[ROW][C]2[/C][C]0.22276[/C][C]2.315[/C][C]0.011252[/C][/ROW]
[ROW][C]3[/C][C]0.305835[/C][C]3.1783[/C][C]0.000966[/C][/ROW]
[ROW][C]4[/C][C]0.122141[/C][C]1.2693[/C][C]0.103526[/C][/ROW]
[ROW][C]5[/C][C]0.312488[/C][C]3.2475[/C][C]0.000776[/C][/ROW]
[ROW][C]6[/C][C]-0.07853[/C][C]-0.8161[/C][C]0.208118[/C][/ROW]
[ROW][C]7[/C][C]0.176254[/C][C]1.8317[/C][C]0.034877[/C][/ROW]
[ROW][C]8[/C][C]0.102279[/C][C]1.0629[/C][C]0.145097[/C][/ROW]
[ROW][C]9[/C][C]-0.039323[/C][C]-0.4087[/C][C]0.341801[/C][/ROW]
[ROW][C]10[/C][C]0.012086[/C][C]0.1256[/C][C]0.45014[/C][/ROW]
[ROW][C]11[/C][C]-0.186121[/C][C]-1.9342[/C][C]0.027851[/C][/ROW]
[ROW][C]12[/C][C]0.002148[/C][C]0.0223[/C][C]0.491118[/C][/ROW]
[ROW][C]13[/C][C]-0.136907[/C][C]-1.4228[/C][C]0.07884[/C][/ROW]
[ROW][C]14[/C][C]-0.017322[/C][C]-0.18[/C][C]0.42874[/C][/ROW]
[ROW][C]15[/C][C]-0.028153[/C][C]-0.2926[/C][C]0.385206[/C][/ROW]
[ROW][C]16[/C][C]-0.258283[/C][C]-2.6842[/C][C]0.004209[/C][/ROW]
[ROW][C]17[/C][C]-0.069563[/C][C]-0.7229[/C][C]0.235646[/C][/ROW]
[ROW][C]18[/C][C]0.019807[/C][C]0.2058[/C][C]0.418651[/C][/ROW]
[ROW][C]19[/C][C]-0.015424[/C][C]-0.1603[/C][C]0.436475[/C][/ROW]
[ROW][C]20[/C][C]-0.089547[/C][C]-0.9306[/C][C]0.177069[/C][/ROW]
[ROW][C]21[/C][C]0.10627[/C][C]1.1044[/C][C]0.135939[/C][/ROW]
[ROW][C]22[/C][C]-0.066499[/C][C]-0.6911[/C][C]0.245499[/C][/ROW]
[ROW][C]23[/C][C]0.061536[/C][C]0.6395[/C][C]0.261927[/C][/ROW]
[ROW][C]24[/C][C]0.053814[/C][C]0.5592[/C][C]0.288576[/C][/ROW]
[ROW][C]25[/C][C]0.046499[/C][C]0.4832[/C][C]0.314955[/C][/ROW]
[ROW][C]26[/C][C]0.041963[/C][C]0.4361[/C][C]0.331821[/C][/ROW]
[ROW][C]27[/C][C]-0.078206[/C][C]-0.8127[/C][C]0.209079[/C][/ROW]
[ROW][C]28[/C][C]0.07585[/C][C]0.7883[/C][C]0.216137[/C][/ROW]
[ROW][C]29[/C][C]-0.026393[/C][C]-0.2743[/C][C]0.392193[/C][/ROW]
[ROW][C]30[/C][C]-0.050538[/C][C]-0.5252[/C][C]0.30026[/C][/ROW]
[ROW][C]31[/C][C]0.057011[/C][C]0.5925[/C][C]0.277385[/C][/ROW]
[ROW][C]32[/C][C]0.013542[/C][C]0.1407[/C][C]0.444172[/C][/ROW]
[ROW][C]33[/C][C]-0.082277[/C][C]-0.855[/C][C]0.19721[/C][/ROW]
[ROW][C]34[/C][C]0.06242[/C][C]0.6487[/C][C]0.25896[/C][/ROW]
[ROW][C]35[/C][C]0.089396[/C][C]0.929[/C][C]0.177472[/C][/ROW]
[ROW][C]36[/C][C]-0.024343[/C][C]-0.253[/C][C]0.400384[/C][/ROW]
[ROW][C]37[/C][C]0.060231[/C][C]0.6259[/C][C]0.266337[/C][/ROW]
[ROW][C]38[/C][C]-0.077761[/C][C]-0.8081[/C][C]0.210401[/C][/ROW]
[ROW][C]39[/C][C]-0.051718[/C][C]-0.5375[/C][C]0.296024[/C][/ROW]
[ROW][C]40[/C][C]-0.00542[/C][C]-0.0563[/C][C]0.477593[/C][/ROW]
[ROW][C]41[/C][C]-0.135074[/C][C]-1.4037[/C][C]0.081635[/C][/ROW]
[ROW][C]42[/C][C]-0.069528[/C][C]-0.7226[/C][C]0.235758[/C][/ROW]
[ROW][C]43[/C][C]-0.072215[/C][C]-0.7505[/C][C]0.227297[/C][/ROW]
[ROW][C]44[/C][C]-0.098114[/C][C]-1.0196[/C][C]0.15509[/C][/ROW]
[ROW][C]45[/C][C]-0.017638[/C][C]-0.1833[/C][C]0.427453[/C][/ROW]
[ROW][C]46[/C][C]-0.067019[/C][C]-0.6965[/C][C]0.243812[/C][/ROW]
[ROW][C]47[/C][C]-0.02095[/C][C]-0.2177[/C][C]0.414028[/C][/ROW]
[ROW][C]48[/C][C]0.043842[/C][C]0.4556[/C][C]0.32479[/C][/ROW]
[ROW][C]49[/C][C]-0.044234[/C][C]-0.4597[/C][C]0.323332[/C][/ROW]
[ROW][C]50[/C][C]0.025487[/C][C]0.2649[/C][C]0.395806[/C][/ROW]
[ROW][C]51[/C][C]0.025168[/C][C]0.2616[/C][C]0.397082[/C][/ROW]
[ROW][C]52[/C][C]0.024887[/C][C]0.2586[/C][C]0.398207[/C][/ROW]
[ROW][C]53[/C][C]0.033452[/C][C]0.3476[/C][C]0.364391[/C][/ROW]
[ROW][C]54[/C][C]0.027441[/C][C]0.2852[/C][C]0.388027[/C][/ROW]
[ROW][C]55[/C][C]-0.038747[/C][C]-0.4027[/C][C]0.343993[/C][/ROW]
[ROW][C]56[/C][C]0.072505[/C][C]0.7535[/C][C]0.226397[/C][/ROW]
[ROW][C]57[/C][C]-0.042763[/C][C]-0.4444[/C][C]0.32882[/C][/ROW]
[ROW][C]58[/C][C]-0.052629[/C][C]-0.5469[/C][C]0.292775[/C][/ROW]
[ROW][C]59[/C][C]0.035434[/C][C]0.3682[/C][C]0.356708[/C][/ROW]
[ROW][C]60[/C][C]-0.042428[/C][C]-0.4409[/C][C]0.330073[/C][/ROW]
[/TABLE]
Source: https://freestatistics.org/blog/index.php?pk=301535&T=2

Globally Unique Identifier (entire table): ba.freestatistics.org/blog/index.php?pk=301535&T=2

As an alternative you can also use a QR Code:  

The GUIDs for individual cells are displayed in the table below:

Partial Autocorrelation Function
Time lag kPACF(k)T-STATP-value
10.6708776.9720
20.222762.3150.011252
30.3058353.17830.000966
40.1221411.26930.103526
50.3124883.24750.000776
6-0.07853-0.81610.208118
70.1762541.83170.034877
80.1022791.06290.145097
9-0.039323-0.40870.341801
100.0120860.12560.45014
11-0.186121-1.93420.027851
120.0021480.02230.491118
13-0.136907-1.42280.07884
14-0.017322-0.180.42874
15-0.028153-0.29260.385206
16-0.258283-2.68420.004209
17-0.069563-0.72290.235646
180.0198070.20580.418651
19-0.015424-0.16030.436475
20-0.089547-0.93060.177069
210.106271.10440.135939
22-0.066499-0.69110.245499
230.0615360.63950.261927
240.0538140.55920.288576
250.0464990.48320.314955
260.0419630.43610.331821
27-0.078206-0.81270.209079
280.075850.78830.216137
29-0.026393-0.27430.392193
30-0.050538-0.52520.30026
310.0570110.59250.277385
320.0135420.14070.444172
33-0.082277-0.8550.19721
340.062420.64870.25896
350.0893960.9290.177472
36-0.024343-0.2530.400384
370.0602310.62590.266337
38-0.077761-0.80810.210401
39-0.051718-0.53750.296024
40-0.00542-0.05630.477593
41-0.135074-1.40370.081635
42-0.069528-0.72260.235758
43-0.072215-0.75050.227297
44-0.098114-1.01960.15509
45-0.017638-0.18330.427453
46-0.067019-0.69650.243812
47-0.02095-0.21770.414028
480.0438420.45560.32479
49-0.044234-0.45970.323332
500.0254870.26490.395806
510.0251680.26160.397082
520.0248870.25860.398207
530.0334520.34760.364391
540.0274410.28520.388027
55-0.038747-0.40270.343993
560.0725050.75350.226397
57-0.042763-0.44440.32882
58-0.052629-0.54690.292775
590.0354340.36820.356708
60-0.042428-0.44090.330073


Parameters (Session):
par1 = 60 ; par2 = 1 ; par3 = 0 ; par4 = 0 ; par5 = 12 ; par6 = White Noise ; par7 = 0.95 ;
Parameters (R input):
par1 = 60 ; par2 = 1 ; par3 = 0 ; par4 = 0 ; par5 = 12 ; par6 = White Noise ; par7 = 0.95 ; par8 = ;
R code (references can be found in the software module):
if (par1 == 'Default') {
par1 = 10*log10(length(x))
} else {
par1 <- as.numeric(par1)
}
par2 <- as.numeric(par2)
par3 <- as.numeric(par3)
par4 <- as.numeric(par4)
par5 <- as.numeric(par5)
if (par6 == 'White Noise') par6 <- 'white' else par6 <- 'ma'
par7 <- as.numeric(par7)
if (par8 != '') par8 <- as.numeric(par8)
x <- na.omit(x)
ox <- x
if (par8 == '') {
if (par2 == 0) {
x <- log(x)
} else {
x <- (x ^ par2 - 1) / par2
}
} else {
x <- log(x,base=par8)
}
if (par3 > 0) x <- diff(x,lag=1,difference=par3)
if (par4 > 0) x <- diff(x,lag=par5,difference=par4)
bitmap(file='picts.png')
op <- par(mfrow=c(2,1))
plot(ox,type='l',main='Original Time Series',xlab='time',ylab='value')
if (par8=='') {
mytitle <- paste('Working Time Series (lambda=',par2,', d=',par3,', D=',par4,')',sep='')
mysub <- paste('(lambda=',par2,', d=',par3,', D=',par4,', CI=', par7, ', CI type=',par6,')',sep='')
} else {
mytitle <- paste('Working Time Series (base=',par8,', d=',par3,', D=',par4,')',sep='')
mysub <- paste('(base=',par8,', d=',par3,', D=',par4,', CI=', par7, ', CI type=',par6,')',sep='')
}
plot(x,type='l', main=mytitle,xlab='time',ylab='value')
par(op)
dev.off()
bitmap(file='pic1.png')
racf <- acf(x, par1, main='Autocorrelation', xlab='time lag', ylab='ACF', ci.type=par6, ci=par7, sub=mysub)
dev.off()
bitmap(file='pic2.png')
rpacf <- pacf(x,par1,main='Partial Autocorrelation',xlab='lags',ylab='PACF',sub=mysub)
dev.off()
(myacf <- c(racf$acf))
(mypacf <- c(rpacf$acf))
lengthx <- length(x)
sqrtn <- sqrt(lengthx)
load(file='createtable')
a<-table.start()
a<-table.row.start(a)
a<-table.element(a,'Autocorrelation Function',4,TRUE)
a<-table.row.end(a)
a<-table.row.start(a)
a<-table.element(a,'Time lag k',header=TRUE)
a<-table.element(a,'ACF(k)',header=TRUE)
a<-table.element(a,'T-STAT',header=TRUE)
a<-table.element(a,'P-value',header=TRUE)
a<-table.row.end(a)
for (i in 2:(par1+1)) {
a<-table.row.start(a)
a<-table.element(a,i-1,header=TRUE)
a<-table.element(a,round(myacf[i],6))
mytstat <- myacf[i]*sqrtn
a<-table.element(a,round(mytstat,4))
a<-table.element(a,round(1-pt(abs(mytstat),lengthx),6))
a<-table.row.end(a)
}
a<-table.end(a)
table.save(a,file='mytable.tab')
a<-table.start()
a<-table.row.start(a)
a<-table.element(a,'Partial Autocorrelation Function',4,TRUE)
a<-table.row.end(a)
a<-table.row.start(a)
a<-table.element(a,'Time lag k',header=TRUE)
a<-table.element(a,'PACF(k)',header=TRUE)
a<-table.element(a,'T-STAT',header=TRUE)
a<-table.element(a,'P-value',header=TRUE)
a<-table.row.end(a)
for (i in 1:par1) {
a<-table.row.start(a)
a<-table.element(a,i,header=TRUE)
a<-table.element(a,round(mypacf[i],6))
mytstat <- mypacf[i]*sqrtn
a<-table.element(a,round(mytstat,4))
a<-table.element(a,round(1-pt(abs(mytstat),lengthx),6))
a<-table.row.end(a)
}
a<-table.end(a)
table.save(a,file='mytable1.tab')