Free Statistics

of Irreproducible Research!

Author's title

Author*The author of this computation has been verified*
R Software Modulerwasp_arimaforecasting.wasp
Title produced by softwareARIMA Forecasting
Date of computationMon, 19 Dec 2016 22:10:35 +0100
Cite this page as followsStatistical Computations at FreeStatistics.org, Office for Research Development and Education, URL https://freestatistics.org/blog/index.php?v=date/2016/Dec/19/t1482181863m29vrstmkvssh94.htm/, Retrieved Fri, 17 May 2024 12:27:05 +0000
Statistical Computations at FreeStatistics.org, Office for Research Development and Education, URL https://freestatistics.org/blog/index.php?pk=301514, Retrieved Fri, 17 May 2024 12:27:05 +0000
QR Codes:

Original text written by user:
IsPrivate?No (this computation is public)
User-defined keywords
Estimated Impact62
Family? (F = Feedback message, R = changed R code, M = changed R Module, P = changed Parameters, D = changed Data)
-       [ARIMA Forecasting] [] [2016-12-19 21:10:35] [2e11ca31a00cf8de75c33c1af2d59434] [Current]
Feedback Forum

Post a new message
Dataseries X:
3894.5
3850
3823
4091
4145.5
4432.5
4245
4172
3815
3565.5
3560
3477.5
3597
3685.5
4012.5
4422
4548.5
4599
4675
4583
4755.5
5001
5113
5131
5336
5276
5431
5479
5550
5601.5
5681.5
6191.5
6433.5
6489.5
6609
6673
6877
6972
6993
7032
7125.5
7233
7109
6935.5


Summary of computational transaction
Raw Input view raw input (R code)
Raw Outputview raw output of R engine
Computing time1 seconds
R ServerBig Analytics Cloud Computing Center

\begin{tabular}{lllllllll}
\hline
Summary of computational transaction \tabularnewline
Raw Input view raw input (R code)  \tabularnewline
Raw Outputview raw output of R engine  \tabularnewline
Computing time1 seconds \tabularnewline
R ServerBig Analytics Cloud Computing Center \tabularnewline
\hline
\end{tabular}
%Source: https://freestatistics.org/blog/index.php?pk=301514&T=0

[TABLE]
[ROW]
Summary of computational transaction[/C][/ROW] [ROW]Raw Input[/C] view raw input (R code) [/C][/ROW] [ROW]Raw Output[/C]view raw output of R engine [/C][/ROW] [ROW]Computing time[/C]1 seconds[/C][/ROW] [ROW]R Server[/C]Big Analytics Cloud Computing Center[/C][/ROW] [/TABLE] Source: https://freestatistics.org/blog/index.php?pk=301514&T=0

Globally Unique Identifier (entire table): ba.freestatistics.org/blog/index.php?pk=301514&T=0

As an alternative you can also use a QR Code:  

The GUIDs for individual cells are displayed in the table below:

Summary of computational transaction
Raw Input view raw input (R code)
Raw Outputview raw output of R engine
Computing time1 seconds
R ServerBig Analytics Cloud Computing Center


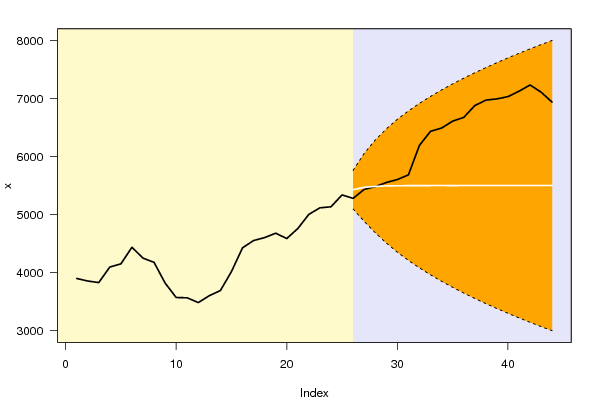
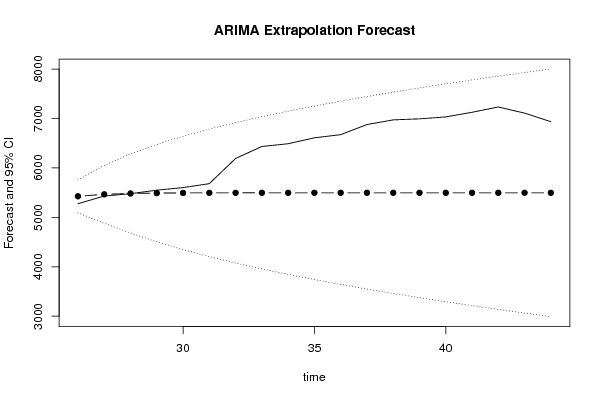
Univariate ARIMA Extrapolation Forecast
timeY[t]F[t]95% LB95% UBp-value(H0: Y[t] = F[t])P(F[t]>Y[t-1])P(F[t]>Y[t-s])P(F[t]>Y[25])
245131-------
255336-------
2652765426.06575091.87715760.25440.18940.70130.70130.7013
2754315465.63574879.92646051.3450.45390.73720.73720.6678
2854795483.02064682.61656283.42460.49610.55070.55070.6406
2955505490.65854505.79216475.5250.4530.50930.50930.6209
305601.55494.01424347.83686640.19170.42710.46190.46190.6065
315681.55495.48854205.55516785.42190.38870.4360.4360.5957
326191.55496.13634075.93066916.34190.16860.3990.3990.5875
336433.55496.42083956.51967036.32210.11650.18820.18820.5809
346489.55496.54593845.43717147.65460.11930.1330.1330.5756
3566095496.60083741.24697251.95470.10710.13380.13380.5712
3666735496.62493642.85017350.39980.10680.11980.11980.5674
3768775496.63553549.39597443.87510.08240.11820.11820.5642
3869725496.64023460.2167533.06440.07780.0920.0920.5614
3969935496.64223374.77667618.50790.08350.08650.08650.559
4070325496.64313292.64497700.64140.08610.09160.09160.5568
417125.55496.64353213.46497779.82210.0810.09370.09370.5548
4272335496.64373136.947856.34740.07460.0880.0880.5531
4371095496.64383062.81997930.46770.09710.0810.0810.5515
446935.55496.64382990.89128002.39640.13020.10360.10360.55

\begin{tabular}{lllllllll}
\hline
Univariate ARIMA Extrapolation Forecast \tabularnewline
time & Y[t] & F[t] & 95% LB & 95% UB & p-value(H0: Y[t] = F[t]) & P(F[t]>Y[t-1]) & P(F[t]>Y[t-s]) & P(F[t]>Y[25]) \tabularnewline
24 & 5131 & - & - & - & - & - & - & - \tabularnewline
25 & 5336 & - & - & - & - & - & - & - \tabularnewline
26 & 5276 & 5426.0657 & 5091.8771 & 5760.2544 & 0.1894 & 0.7013 & 0.7013 & 0.7013 \tabularnewline
27 & 5431 & 5465.6357 & 4879.9264 & 6051.345 & 0.4539 & 0.7372 & 0.7372 & 0.6678 \tabularnewline
28 & 5479 & 5483.0206 & 4682.6165 & 6283.4246 & 0.4961 & 0.5507 & 0.5507 & 0.6406 \tabularnewline
29 & 5550 & 5490.6585 & 4505.7921 & 6475.525 & 0.453 & 0.5093 & 0.5093 & 0.6209 \tabularnewline
30 & 5601.5 & 5494.0142 & 4347.8368 & 6640.1917 & 0.4271 & 0.4619 & 0.4619 & 0.6065 \tabularnewline
31 & 5681.5 & 5495.4885 & 4205.5551 & 6785.4219 & 0.3887 & 0.436 & 0.436 & 0.5957 \tabularnewline
32 & 6191.5 & 5496.1363 & 4075.9306 & 6916.3419 & 0.1686 & 0.399 & 0.399 & 0.5875 \tabularnewline
33 & 6433.5 & 5496.4208 & 3956.5196 & 7036.3221 & 0.1165 & 0.1882 & 0.1882 & 0.5809 \tabularnewline
34 & 6489.5 & 5496.5459 & 3845.4371 & 7147.6546 & 0.1193 & 0.133 & 0.133 & 0.5756 \tabularnewline
35 & 6609 & 5496.6008 & 3741.2469 & 7251.9547 & 0.1071 & 0.1338 & 0.1338 & 0.5712 \tabularnewline
36 & 6673 & 5496.6249 & 3642.8501 & 7350.3998 & 0.1068 & 0.1198 & 0.1198 & 0.5674 \tabularnewline
37 & 6877 & 5496.6355 & 3549.3959 & 7443.8751 & 0.0824 & 0.1182 & 0.1182 & 0.5642 \tabularnewline
38 & 6972 & 5496.6402 & 3460.216 & 7533.0644 & 0.0778 & 0.092 & 0.092 & 0.5614 \tabularnewline
39 & 6993 & 5496.6422 & 3374.7766 & 7618.5079 & 0.0835 & 0.0865 & 0.0865 & 0.559 \tabularnewline
40 & 7032 & 5496.6431 & 3292.6449 & 7700.6414 & 0.0861 & 0.0916 & 0.0916 & 0.5568 \tabularnewline
41 & 7125.5 & 5496.6435 & 3213.4649 & 7779.8221 & 0.081 & 0.0937 & 0.0937 & 0.5548 \tabularnewline
42 & 7233 & 5496.6437 & 3136.94 & 7856.3474 & 0.0746 & 0.088 & 0.088 & 0.5531 \tabularnewline
43 & 7109 & 5496.6438 & 3062.8199 & 7930.4677 & 0.0971 & 0.081 & 0.081 & 0.5515 \tabularnewline
44 & 6935.5 & 5496.6438 & 2990.8912 & 8002.3964 & 0.1302 & 0.1036 & 0.1036 & 0.55 \tabularnewline
\hline
\end{tabular}
%Source: https://freestatistics.org/blog/index.php?pk=301514&T=1

[TABLE]
[ROW][C]Univariate ARIMA Extrapolation Forecast[/C][/ROW]
[ROW][C]time[/C][C]Y[t][/C][C]F[t][/C][C]95% LB[/C][C]95% UB[/C][C]p-value(H0: Y[t] = F[t])[/C][C]P(F[t]>Y[t-1])[/C][C]P(F[t]>Y[t-s])[/C][C]P(F[t]>Y[25])[/C][/ROW]
[ROW][C]24[/C][C]5131[/C][C]-[/C][C]-[/C][C]-[/C][C]-[/C][C]-[/C][C]-[/C][C]-[/C][/ROW]
[ROW][C]25[/C][C]5336[/C][C]-[/C][C]-[/C][C]-[/C][C]-[/C][C]-[/C][C]-[/C][C]-[/C][/ROW]
[ROW][C]26[/C][C]5276[/C][C]5426.0657[/C][C]5091.8771[/C][C]5760.2544[/C][C]0.1894[/C][C]0.7013[/C][C]0.7013[/C][C]0.7013[/C][/ROW]
[ROW][C]27[/C][C]5431[/C][C]5465.6357[/C][C]4879.9264[/C][C]6051.345[/C][C]0.4539[/C][C]0.7372[/C][C]0.7372[/C][C]0.6678[/C][/ROW]
[ROW][C]28[/C][C]5479[/C][C]5483.0206[/C][C]4682.6165[/C][C]6283.4246[/C][C]0.4961[/C][C]0.5507[/C][C]0.5507[/C][C]0.6406[/C][/ROW]
[ROW][C]29[/C][C]5550[/C][C]5490.6585[/C][C]4505.7921[/C][C]6475.525[/C][C]0.453[/C][C]0.5093[/C][C]0.5093[/C][C]0.6209[/C][/ROW]
[ROW][C]30[/C][C]5601.5[/C][C]5494.0142[/C][C]4347.8368[/C][C]6640.1917[/C][C]0.4271[/C][C]0.4619[/C][C]0.4619[/C][C]0.6065[/C][/ROW]
[ROW][C]31[/C][C]5681.5[/C][C]5495.4885[/C][C]4205.5551[/C][C]6785.4219[/C][C]0.3887[/C][C]0.436[/C][C]0.436[/C][C]0.5957[/C][/ROW]
[ROW][C]32[/C][C]6191.5[/C][C]5496.1363[/C][C]4075.9306[/C][C]6916.3419[/C][C]0.1686[/C][C]0.399[/C][C]0.399[/C][C]0.5875[/C][/ROW]
[ROW][C]33[/C][C]6433.5[/C][C]5496.4208[/C][C]3956.5196[/C][C]7036.3221[/C][C]0.1165[/C][C]0.1882[/C][C]0.1882[/C][C]0.5809[/C][/ROW]
[ROW][C]34[/C][C]6489.5[/C][C]5496.5459[/C][C]3845.4371[/C][C]7147.6546[/C][C]0.1193[/C][C]0.133[/C][C]0.133[/C][C]0.5756[/C][/ROW]
[ROW][C]35[/C][C]6609[/C][C]5496.6008[/C][C]3741.2469[/C][C]7251.9547[/C][C]0.1071[/C][C]0.1338[/C][C]0.1338[/C][C]0.5712[/C][/ROW]
[ROW][C]36[/C][C]6673[/C][C]5496.6249[/C][C]3642.8501[/C][C]7350.3998[/C][C]0.1068[/C][C]0.1198[/C][C]0.1198[/C][C]0.5674[/C][/ROW]
[ROW][C]37[/C][C]6877[/C][C]5496.6355[/C][C]3549.3959[/C][C]7443.8751[/C][C]0.0824[/C][C]0.1182[/C][C]0.1182[/C][C]0.5642[/C][/ROW]
[ROW][C]38[/C][C]6972[/C][C]5496.6402[/C][C]3460.216[/C][C]7533.0644[/C][C]0.0778[/C][C]0.092[/C][C]0.092[/C][C]0.5614[/C][/ROW]
[ROW][C]39[/C][C]6993[/C][C]5496.6422[/C][C]3374.7766[/C][C]7618.5079[/C][C]0.0835[/C][C]0.0865[/C][C]0.0865[/C][C]0.559[/C][/ROW]
[ROW][C]40[/C][C]7032[/C][C]5496.6431[/C][C]3292.6449[/C][C]7700.6414[/C][C]0.0861[/C][C]0.0916[/C][C]0.0916[/C][C]0.5568[/C][/ROW]
[ROW][C]41[/C][C]7125.5[/C][C]5496.6435[/C][C]3213.4649[/C][C]7779.8221[/C][C]0.081[/C][C]0.0937[/C][C]0.0937[/C][C]0.5548[/C][/ROW]
[ROW][C]42[/C][C]7233[/C][C]5496.6437[/C][C]3136.94[/C][C]7856.3474[/C][C]0.0746[/C][C]0.088[/C][C]0.088[/C][C]0.5531[/C][/ROW]
[ROW][C]43[/C][C]7109[/C][C]5496.6438[/C][C]3062.8199[/C][C]7930.4677[/C][C]0.0971[/C][C]0.081[/C][C]0.081[/C][C]0.5515[/C][/ROW]
[ROW][C]44[/C][C]6935.5[/C][C]5496.6438[/C][C]2990.8912[/C][C]8002.3964[/C][C]0.1302[/C][C]0.1036[/C][C]0.1036[/C][C]0.55[/C][/ROW]
[/TABLE]
Source: https://freestatistics.org/blog/index.php?pk=301514&T=1

Globally Unique Identifier (entire table): ba.freestatistics.org/blog/index.php?pk=301514&T=1

As an alternative you can also use a QR Code:  

The GUIDs for individual cells are displayed in the table below:

Univariate ARIMA Extrapolation Forecast
timeY[t]F[t]95% LB95% UBp-value(H0: Y[t] = F[t])P(F[t]>Y[t-1])P(F[t]>Y[t-s])P(F[t]>Y[25])
245131-------
255336-------
2652765426.06575091.87715760.25440.18940.70130.70130.7013
2754315465.63574879.92646051.3450.45390.73720.73720.6678
2854795483.02064682.61656283.42460.49610.55070.55070.6406
2955505490.65854505.79216475.5250.4530.50930.50930.6209
305601.55494.01424347.83686640.19170.42710.46190.46190.6065
315681.55495.48854205.55516785.42190.38870.4360.4360.5957
326191.55496.13634075.93066916.34190.16860.3990.3990.5875
336433.55496.42083956.51967036.32210.11650.18820.18820.5809
346489.55496.54593845.43717147.65460.11930.1330.1330.5756
3566095496.60083741.24697251.95470.10710.13380.13380.5712
3666735496.62493642.85017350.39980.10680.11980.11980.5674
3768775496.63553549.39597443.87510.08240.11820.11820.5642
3869725496.64023460.2167533.06440.07780.0920.0920.5614
3969935496.64223374.77667618.50790.08350.08650.08650.559
4070325496.64313292.64497700.64140.08610.09160.09160.5568
417125.55496.64353213.46497779.82210.0810.09370.09370.5548
4272335496.64373136.947856.34740.07460.0880.0880.5531
4371095496.64383062.81997930.46770.09710.0810.0810.5515
446935.55496.64382990.89128002.39640.13020.10360.10360.55


Univariate ARIMA Extrapolation Forecast Performance
time% S.E.PEMAPEsMAPESq.EMSERMSEScaledEMASE
260.0314-0.02840.02840.02822519.729300-1.19811.1981
270.0547-0.00640.01740.01721199.631511859.6804108.9022-0.27650.7373
280.0745-7e-040.01190.011716.16497911.841988.9485-0.03210.5023
290.09150.01070.01160.01153521.41176814.234482.54840.47380.4951
300.10640.01920.01310.013111553.19417762.026388.10240.85820.5677
310.11980.03270.01640.016434600.269212235.0668110.61221.48510.7206
320.13180.11230.03010.0311483530.738279563.0199282.06925.55181.4108
330.14290.14570.04450.0468878117.367179382.3133423.53557.48172.1697
340.15330.1530.05660.06985957.9247269001.8256518.65397.92782.8095
350.16290.16830.06770.07241237432.0023365844.8433604.85118.88143.4167
360.17210.17630.07760.08341383858.3209458391.5231677.04629.39223.9599
370.18070.20070.08790.0951905406.0804578976.0695760.904811.02094.5483
380.1890.21160.09740.10592176686.5849701876.8784837.780911.77935.1045
390.1970.2140.10570.11552239086.5723811677.5708900.931511.9475.5933
400.20460.21830.11320.12412357320.7171914720.4472956.410212.25836.0376
410.21190.22860.12040.13252653173.41481023373.75771011.619413.00486.4731
420.2190.24010.12750.14083014933.20411140524.31341067.953313.86316.9078
430.22590.22680.1330.14712599692.59561221589.2181105.255312.87317.2392
440.23260.20750.13690.15162070307.13921266258.58221125.281611.48797.4628

\begin{tabular}{lllllllll}
\hline
Univariate ARIMA Extrapolation Forecast Performance \tabularnewline
time & % S.E. & PE & MAPE & sMAPE & Sq.E & MSE & RMSE & ScaledE & MASE \tabularnewline
26 & 0.0314 & -0.0284 & 0.0284 & 0.028 & 22519.7293 & 0 & 0 & -1.1981 & 1.1981 \tabularnewline
27 & 0.0547 & -0.0064 & 0.0174 & 0.0172 & 1199.6315 & 11859.6804 & 108.9022 & -0.2765 & 0.7373 \tabularnewline
28 & 0.0745 & -7e-04 & 0.0119 & 0.0117 & 16.1649 & 7911.8419 & 88.9485 & -0.0321 & 0.5023 \tabularnewline
29 & 0.0915 & 0.0107 & 0.0116 & 0.0115 & 3521.4117 & 6814.2344 & 82.5484 & 0.4738 & 0.4951 \tabularnewline
30 & 0.1064 & 0.0192 & 0.0131 & 0.0131 & 11553.1941 & 7762.0263 & 88.1024 & 0.8582 & 0.5677 \tabularnewline
31 & 0.1198 & 0.0327 & 0.0164 & 0.0164 & 34600.2692 & 12235.0668 & 110.6122 & 1.4851 & 0.7206 \tabularnewline
32 & 0.1318 & 0.1123 & 0.0301 & 0.0311 & 483530.7382 & 79563.0199 & 282.0692 & 5.5518 & 1.4108 \tabularnewline
33 & 0.1429 & 0.1457 & 0.0445 & 0.0468 & 878117.367 & 179382.3133 & 423.5355 & 7.4817 & 2.1697 \tabularnewline
34 & 0.1533 & 0.153 & 0.0566 & 0.06 & 985957.9247 & 269001.8256 & 518.6539 & 7.9278 & 2.8095 \tabularnewline
35 & 0.1629 & 0.1683 & 0.0677 & 0.0724 & 1237432.0023 & 365844.8433 & 604.8511 & 8.8814 & 3.4167 \tabularnewline
36 & 0.1721 & 0.1763 & 0.0776 & 0.0834 & 1383858.3209 & 458391.5231 & 677.0462 & 9.3922 & 3.9599 \tabularnewline
37 & 0.1807 & 0.2007 & 0.0879 & 0.095 & 1905406.0804 & 578976.0695 & 760.9048 & 11.0209 & 4.5483 \tabularnewline
38 & 0.189 & 0.2116 & 0.0974 & 0.1059 & 2176686.5849 & 701876.8784 & 837.7809 & 11.7793 & 5.1045 \tabularnewline
39 & 0.197 & 0.214 & 0.1057 & 0.1155 & 2239086.5723 & 811677.5708 & 900.9315 & 11.947 & 5.5933 \tabularnewline
40 & 0.2046 & 0.2183 & 0.1132 & 0.1241 & 2357320.7171 & 914720.4472 & 956.4102 & 12.2583 & 6.0376 \tabularnewline
41 & 0.2119 & 0.2286 & 0.1204 & 0.1325 & 2653173.4148 & 1023373.7577 & 1011.6194 & 13.0048 & 6.4731 \tabularnewline
42 & 0.219 & 0.2401 & 0.1275 & 0.1408 & 3014933.2041 & 1140524.3134 & 1067.9533 & 13.8631 & 6.9078 \tabularnewline
43 & 0.2259 & 0.2268 & 0.133 & 0.1471 & 2599692.5956 & 1221589.218 & 1105.2553 & 12.8731 & 7.2392 \tabularnewline
44 & 0.2326 & 0.2075 & 0.1369 & 0.1516 & 2070307.1392 & 1266258.5822 & 1125.2816 & 11.4879 & 7.4628 \tabularnewline
\hline
\end{tabular}
%Source: https://freestatistics.org/blog/index.php?pk=301514&T=2

[TABLE]
[ROW][C]Univariate ARIMA Extrapolation Forecast Performance[/C][/ROW]
[ROW][C]time[/C][C]% S.E.[/C][C]PE[/C][C]MAPE[/C][C]sMAPE[/C][C]Sq.E[/C][C]MSE[/C][C]RMSE[/C][C]ScaledE[/C][C]MASE[/C][/ROW]
[ROW][C]26[/C][C]0.0314[/C][C]-0.0284[/C][C]0.0284[/C][C]0.028[/C][C]22519.7293[/C][C]0[/C][C]0[/C][C]-1.1981[/C][C]1.1981[/C][/ROW]
[ROW][C]27[/C][C]0.0547[/C][C]-0.0064[/C][C]0.0174[/C][C]0.0172[/C][C]1199.6315[/C][C]11859.6804[/C][C]108.9022[/C][C]-0.2765[/C][C]0.7373[/C][/ROW]
[ROW][C]28[/C][C]0.0745[/C][C]-7e-04[/C][C]0.0119[/C][C]0.0117[/C][C]16.1649[/C][C]7911.8419[/C][C]88.9485[/C][C]-0.0321[/C][C]0.5023[/C][/ROW]
[ROW][C]29[/C][C]0.0915[/C][C]0.0107[/C][C]0.0116[/C][C]0.0115[/C][C]3521.4117[/C][C]6814.2344[/C][C]82.5484[/C][C]0.4738[/C][C]0.4951[/C][/ROW]
[ROW][C]30[/C][C]0.1064[/C][C]0.0192[/C][C]0.0131[/C][C]0.0131[/C][C]11553.1941[/C][C]7762.0263[/C][C]88.1024[/C][C]0.8582[/C][C]0.5677[/C][/ROW]
[ROW][C]31[/C][C]0.1198[/C][C]0.0327[/C][C]0.0164[/C][C]0.0164[/C][C]34600.2692[/C][C]12235.0668[/C][C]110.6122[/C][C]1.4851[/C][C]0.7206[/C][/ROW]
[ROW][C]32[/C][C]0.1318[/C][C]0.1123[/C][C]0.0301[/C][C]0.0311[/C][C]483530.7382[/C][C]79563.0199[/C][C]282.0692[/C][C]5.5518[/C][C]1.4108[/C][/ROW]
[ROW][C]33[/C][C]0.1429[/C][C]0.1457[/C][C]0.0445[/C][C]0.0468[/C][C]878117.367[/C][C]179382.3133[/C][C]423.5355[/C][C]7.4817[/C][C]2.1697[/C][/ROW]
[ROW][C]34[/C][C]0.1533[/C][C]0.153[/C][C]0.0566[/C][C]0.06[/C][C]985957.9247[/C][C]269001.8256[/C][C]518.6539[/C][C]7.9278[/C][C]2.8095[/C][/ROW]
[ROW][C]35[/C][C]0.1629[/C][C]0.1683[/C][C]0.0677[/C][C]0.0724[/C][C]1237432.0023[/C][C]365844.8433[/C][C]604.8511[/C][C]8.8814[/C][C]3.4167[/C][/ROW]
[ROW][C]36[/C][C]0.1721[/C][C]0.1763[/C][C]0.0776[/C][C]0.0834[/C][C]1383858.3209[/C][C]458391.5231[/C][C]677.0462[/C][C]9.3922[/C][C]3.9599[/C][/ROW]
[ROW][C]37[/C][C]0.1807[/C][C]0.2007[/C][C]0.0879[/C][C]0.095[/C][C]1905406.0804[/C][C]578976.0695[/C][C]760.9048[/C][C]11.0209[/C][C]4.5483[/C][/ROW]
[ROW][C]38[/C][C]0.189[/C][C]0.2116[/C][C]0.0974[/C][C]0.1059[/C][C]2176686.5849[/C][C]701876.8784[/C][C]837.7809[/C][C]11.7793[/C][C]5.1045[/C][/ROW]
[ROW][C]39[/C][C]0.197[/C][C]0.214[/C][C]0.1057[/C][C]0.1155[/C][C]2239086.5723[/C][C]811677.5708[/C][C]900.9315[/C][C]11.947[/C][C]5.5933[/C][/ROW]
[ROW][C]40[/C][C]0.2046[/C][C]0.2183[/C][C]0.1132[/C][C]0.1241[/C][C]2357320.7171[/C][C]914720.4472[/C][C]956.4102[/C][C]12.2583[/C][C]6.0376[/C][/ROW]
[ROW][C]41[/C][C]0.2119[/C][C]0.2286[/C][C]0.1204[/C][C]0.1325[/C][C]2653173.4148[/C][C]1023373.7577[/C][C]1011.6194[/C][C]13.0048[/C][C]6.4731[/C][/ROW]
[ROW][C]42[/C][C]0.219[/C][C]0.2401[/C][C]0.1275[/C][C]0.1408[/C][C]3014933.2041[/C][C]1140524.3134[/C][C]1067.9533[/C][C]13.8631[/C][C]6.9078[/C][/ROW]
[ROW][C]43[/C][C]0.2259[/C][C]0.2268[/C][C]0.133[/C][C]0.1471[/C][C]2599692.5956[/C][C]1221589.218[/C][C]1105.2553[/C][C]12.8731[/C][C]7.2392[/C][/ROW]
[ROW][C]44[/C][C]0.2326[/C][C]0.2075[/C][C]0.1369[/C][C]0.1516[/C][C]2070307.1392[/C][C]1266258.5822[/C][C]1125.2816[/C][C]11.4879[/C][C]7.4628[/C][/ROW]
[/TABLE]
Source: https://freestatistics.org/blog/index.php?pk=301514&T=2

Globally Unique Identifier (entire table): ba.freestatistics.org/blog/index.php?pk=301514&T=2

As an alternative you can also use a QR Code:  

The GUIDs for individual cells are displayed in the table below:

Univariate ARIMA Extrapolation Forecast Performance
time% S.E.PEMAPEsMAPESq.EMSERMSEScaledEMASE
260.0314-0.02840.02840.02822519.729300-1.19811.1981
270.0547-0.00640.01740.01721199.631511859.6804108.9022-0.27650.7373
280.0745-7e-040.01190.011716.16497911.841988.9485-0.03210.5023
290.09150.01070.01160.01153521.41176814.234482.54840.47380.4951
300.10640.01920.01310.013111553.19417762.026388.10240.85820.5677
310.11980.03270.01640.016434600.269212235.0668110.61221.48510.7206
320.13180.11230.03010.0311483530.738279563.0199282.06925.55181.4108
330.14290.14570.04450.0468878117.367179382.3133423.53557.48172.1697
340.15330.1530.05660.06985957.9247269001.8256518.65397.92782.8095
350.16290.16830.06770.07241237432.0023365844.8433604.85118.88143.4167
360.17210.17630.07760.08341383858.3209458391.5231677.04629.39223.9599
370.18070.20070.08790.0951905406.0804578976.0695760.904811.02094.5483
380.1890.21160.09740.10592176686.5849701876.8784837.780911.77935.1045
390.1970.2140.10570.11552239086.5723811677.5708900.931511.9475.5933
400.20460.21830.11320.12412357320.7171914720.4472956.410212.25836.0376
410.21190.22860.12040.13252653173.41481023373.75771011.619413.00486.4731
420.2190.24010.12750.14083014933.20411140524.31341067.953313.86316.9078
430.22590.22680.1330.14712599692.59561221589.2181105.255312.87317.2392
440.23260.20750.13690.15162070307.13921266258.58221125.281611.48797.4628


Parameters (Session):
par1 = 12 ;
Parameters (R input):
par1 = 19 ; par2 = 1 ; par3 = 1 ; par4 = 0 ; par5 = 1 ; par6 = 1 ; par7 = 0 ; par8 = 0 ; par9 = 0 ; par10 = FALSE ;
R code (references can be found in the software module):
par1 <- as.numeric(par1) #cut off periods
par2 <- as.numeric(par2) #lambda
par3 <- as.numeric(par3) #degree of non-seasonal differencing
par4 <- as.numeric(par4) #degree of seasonal differencing
par5 <- as.numeric(par5) #seasonal period
par6 <- as.numeric(par6) #p
par7 <- as.numeric(par7) #q
par8 <- as.numeric(par8) #P
par9 <- as.numeric(par9) #Q
if (par10 == 'TRUE') par10 <- TRUE
if (par10 == 'FALSE') par10 <- FALSE
if (par2 == 0) x <- log(x)
if (par2 != 0) x <- x^par2
lx <- length(x)
first <- lx - 2*par1
nx <- lx - par1
nx1 <- nx + 1
fx <- lx - nx
if (fx < 1) {
fx <- par5*2
nx1 <- lx + fx - 1
first <- lx - 2*fx
}
first <- 1
if (fx < 3) fx <- round(lx/10,0)
(arima.out <- arima(x[1:nx], order=c(par6,par3,par7), seasonal=list(order=c(par8,par4,par9), period=par5), include.mean=par10, method='ML'))
(forecast <- predict(arima.out,fx))
(lb <- forecast$pred - 1.96 * forecast$se)
(ub <- forecast$pred + 1.96 * forecast$se)
if (par2 == 0) {
x <- exp(x)
forecast$pred <- exp(forecast$pred)
lb <- exp(lb)
ub <- exp(ub)
}
if (par2 != 0) {
x <- x^(1/par2)
forecast$pred <- forecast$pred^(1/par2)
lb <- lb^(1/par2)
ub <- ub^(1/par2)
}
if (par2 < 0) {
olb <- lb
lb <- ub
ub <- olb
}
(actandfor <- c(x[1:nx], forecast$pred))
(perc.se <- (ub-forecast$pred)/1.96/forecast$pred)
bitmap(file='test1.png')
opar <- par(mar=c(4,4,2,2),las=1)
ylim <- c( min(x[first:nx],lb), max(x[first:nx],ub))
plot(x,ylim=ylim,type='n',xlim=c(first,lx))
usr <- par('usr')
rect(usr[1],usr[3],nx+1,usr[4],border=NA,col='lemonchiffon')
rect(nx1,usr[3],usr[2],usr[4],border=NA,col='lavender')
abline(h= (-3:3)*2 , col ='gray', lty =3)
polygon( c(nx1:lx,lx:nx1), c(lb,rev(ub)), col = 'orange', lty=2,border=NA)
lines(nx1:lx, lb , lty=2)
lines(nx1:lx, ub , lty=2)
lines(x, lwd=2)
lines(nx1:lx, forecast$pred , lwd=2 , col ='white')
box()
par(opar)
dev.off()
prob.dec <- array(NA, dim=fx)
prob.sdec <- array(NA, dim=fx)
prob.ldec <- array(NA, dim=fx)
prob.pval <- array(NA, dim=fx)
perf.pe <- array(0, dim=fx)
perf.spe <- array(0, dim=fx)
perf.scalederr <- array(0, dim=fx)
perf.mase <- array(0, dim=fx)
perf.mase1 <- array(0, dim=fx)
perf.mape <- array(0, dim=fx)
perf.smape <- array(0, dim=fx)
perf.mape1 <- array(0, dim=fx)
perf.smape1 <- array(0,dim=fx)
perf.se <- array(0, dim=fx)
perf.mse <- array(0, dim=fx)
perf.mse1 <- array(0, dim=fx)
perf.rmse <- array(0, dim=fx)
perf.scaleddenom <- 0
for (i in 2:fx) {
perf.scaleddenom = perf.scaleddenom + abs(x[nx+i] - x[nx+i-1])
}
perf.scaleddenom = perf.scaleddenom / (fx-1)
for (i in 1:fx) {
locSD <- (ub[i] - forecast$pred[i]) / 1.96
perf.scalederr[i] = (x[nx+i] - forecast$pred[i]) / perf.scaleddenom
perf.pe[i] = (x[nx+i] - forecast$pred[i]) / x[nx+i]
perf.spe[i] = 2*(x[nx+i] - forecast$pred[i]) / (x[nx+i] + forecast$pred[i])
perf.se[i] = (x[nx+i] - forecast$pred[i])^2
prob.dec[i] = pnorm((x[nx+i-1] - forecast$pred[i]) / locSD)
prob.sdec[i] = pnorm((x[nx+i-par5] - forecast$pred[i]) / locSD)
prob.ldec[i] = pnorm((x[nx] - forecast$pred[i]) / locSD)
prob.pval[i] = pnorm(abs(x[nx+i] - forecast$pred[i]) / locSD)
}
perf.mape[1] = abs(perf.pe[1])
perf.smape[1] = abs(perf.spe[1])
perf.mape1[1] = perf.mape[1]
perf.smape1[1] = perf.smape[1]
perf.mse[1] = perf.se[1]
perf.mase[1] = abs(perf.scalederr[1])
perf.mase1[1] = perf.mase[1]
for (i in 2:fx) {
perf.mape[i] = perf.mape[i-1] + abs(perf.pe[i])
perf.mape1[i] = perf.mape[i] / i
perf.smape[i] = perf.smape[i-1] + abs(perf.spe[i])
perf.smape1[i] = perf.smape[i] / i
perf.mse[i] = perf.mse[i-1] + perf.se[i]
perf.mse1[i] = perf.mse[i] / i
perf.mase[i] = perf.mase[i-1] + abs(perf.scalederr[i])
perf.mase1[i] = perf.mase[i] / i
}
perf.rmse = sqrt(perf.mse1)
bitmap(file='test2.png')
plot(forecast$pred, pch=19, type='b',main='ARIMA Extrapolation Forecast', ylab='Forecast and 95% CI', xlab='time',ylim=c(min(lb),max(ub)))
dum <- forecast$pred
dum[1:par1] <- x[(nx+1):lx]
lines(dum, lty=1)
lines(ub,lty=3)
lines(lb,lty=3)
dev.off()
load(file='createtable')
a<-table.start()
a<-table.row.start(a)
a<-table.element(a,'Univariate ARIMA Extrapolation Forecast',9,TRUE)
a<-table.row.end(a)
a<-table.row.start(a)
a<-table.element(a,'time',1,header=TRUE)
a<-table.element(a,'Y[t]',1,header=TRUE)
a<-table.element(a,'F[t]',1,header=TRUE)
a<-table.element(a,'95% LB',1,header=TRUE)
a<-table.element(a,'95% UB',1,header=TRUE)
a<-table.element(a,'p-value
(H0: Y[t] = F[t])',1,header=TRUE)
a<-table.element(a,'P(F[t]>Y[t-1])',1,header=TRUE)
a<-table.element(a,'P(F[t]>Y[t-s])',1,header=TRUE)
mylab <- paste('P(F[t]>Y[',nx,sep='')
mylab <- paste(mylab,'])',sep='')
a<-table.element(a,mylab,1,header=TRUE)
a<-table.row.end(a)
for (i in (nx-par5):nx) {
a<-table.row.start(a)
a<-table.element(a,i,header=TRUE)
a<-table.element(a,x[i])
a<-table.element(a,'-')
a<-table.row.end(a)
}
for (i in 1:fx) {
a<-table.row.start(a)
a<-table.element(a,nx+i,header=TRUE)
a<-table.element(a,round(x[nx+i],4))
a<-table.element(a,round(forecast$pred[i],4))
a<-table.element(a,round(lb[i],4))
a<-table.element(a,round(ub[i],4))
a<-table.element(a,round((1-prob.pval[i]),4))
a<-table.element(a,round((1-prob.dec[i]),4))
a<-table.element(a,round((1-prob.sdec[i]),4))
a<-table.element(a,round((1-prob.ldec[i]),4))
a<-table.row.end(a)
}
a<-table.end(a)
table.save(a,file='mytable.tab')
a<-table.start()
a<-table.row.start(a)
a<-table.element(a,'Univariate ARIMA Extrapolation Forecast Performance',10,TRUE)
a<-table.row.end(a)
a<-table.row.start(a)
a<-table.element(a,'time',1,header=TRUE)
a<-table.element(a,'% S.E.',1,header=TRUE)
a<-table.element(a,'PE',1,header=TRUE)
a<-table.element(a,'MAPE',1,header=TRUE)
a<-table.element(a,'sMAPE',1,header=TRUE)
a<-table.element(a,'Sq.E',1,header=TRUE)
a<-table.element(a,'MSE',1,header=TRUE)
a<-table.element(a,'RMSE',1,header=TRUE)
a<-table.element(a,'ScaledE',1,header=TRUE)
a<-table.element(a,'MASE',1,header=TRUE)
a<-table.row.end(a)
for (i in 1:fx) {
a<-table.row.start(a)
a<-table.element(a,nx+i,header=TRUE)
a<-table.element(a,round(perc.se[i],4))
a<-table.element(a,round(perf.pe[i],4))
a<-table.element(a,round(perf.mape1[i],4))
a<-table.element(a,round(perf.smape1[i],4))
a<-table.element(a,round(perf.se[i],4))
a<-table.element(a,round(perf.mse1[i],4))
a<-table.element(a,round(perf.rmse[i],4))
a<-table.element(a,round(perf.scalederr[i],4))
a<-table.element(a,round(perf.mase1[i],4))
a<-table.row.end(a)
}
a<-table.end(a)
table.save(a,file='mytable1.tab')