Free Statistics

of Irreproducible Research!

Author's title

Author*The author of this computation has been verified*
R Software Modulerwasp_arimabackwardselection.wasp
Title produced by softwareARIMA Backward Selection
Date of computationMon, 19 Dec 2016 22:09:25 +0100
Cite this page as followsStatistical Computations at FreeStatistics.org, Office for Research Development and Education, URL https://freestatistics.org/blog/index.php?v=date/2016/Dec/19/t1482181785iy66zrgcyn9ny0e.htm/, Retrieved Fri, 17 May 2024 14:23:51 +0000
Statistical Computations at FreeStatistics.org, Office for Research Development and Education, URL https://freestatistics.org/blog/index.php?pk=301512, Retrieved Fri, 17 May 2024 14:23:51 +0000
QR Codes:

Original text written by user:
IsPrivate?No (this computation is public)
User-defined keywords
Estimated Impact59
Family? (F = Feedback message, R = changed R code, M = changed R Module, P = changed Parameters, D = changed Data)
-       [ARIMA Backward Selection] [] [2016-12-19 21:09:25] [2e11ca31a00cf8de75c33c1af2d59434] [Current]
Feedback Forum

Post a new message
Dataseries X:
3894.5
3850
3823
4091
4145.5
4432.5
4245
4172
3815
3565.5
3560
3477.5
3597
3685.5
4012.5
4422
4548.5
4599
4675
4583
4755.5
5001
5113
5131
5336
5276
5431
5479
5550
5601.5
5681.5
6191.5
6433.5
6489.5
6609
6673
6877
6972
6993
7032
7125.5
7233
7109
6935.5


Summary of computational transaction
Raw Input view raw input (R code)
Raw Outputview raw output of R engine
Computing time3 seconds
R ServerBig Analytics Cloud Computing Center

\begin{tabular}{lllllllll}
\hline
Summary of computational transaction \tabularnewline
Raw Input view raw input (R code)  \tabularnewline
Raw Outputview raw output of R engine  \tabularnewline
Computing time3 seconds \tabularnewline
R ServerBig Analytics Cloud Computing Center \tabularnewline
\hline
\end{tabular}
%Source: https://freestatistics.org/blog/index.php?pk=301512&T=0

[TABLE]
[ROW]
Summary of computational transaction[/C][/ROW] [ROW]Raw Input[/C] view raw input (R code) [/C][/ROW] [ROW]Raw Output[/C]view raw output of R engine [/C][/ROW] [ROW]Computing time[/C]3 seconds[/C][/ROW] [ROW]R Server[/C]Big Analytics Cloud Computing Center[/C][/ROW] [/TABLE] Source: https://freestatistics.org/blog/index.php?pk=301512&T=0

Globally Unique Identifier (entire table): ba.freestatistics.org/blog/index.php?pk=301512&T=0

As an alternative you can also use a QR Code:  

The GUIDs for individual cells are displayed in the table below:

Summary of computational transaction
Raw Input view raw input (R code)
Raw Outputview raw output of R engine
Computing time3 seconds
R ServerBig Analytics Cloud Computing Center


ARIMA Parameter Estimation and Backward Selection
Iterationar1ar2ar3ma1
Estimates ( 1 )0.54740.1766-0.1598-0.1478
(p-val)(0.4232 )(0.5636 )(0.4008 )(0.8277 )
Estimates ( 2 )0.40150.2295-0.13070
(p-val)(0.0109 )(0.1545 )(0.4085 )(NA )
Estimates ( 3 )0.37280.179600
(p-val)(0.0159 )(0.2322 )(NA )(NA )
Estimates ( 4 )0.4555000
(p-val)(0.0016 )(NA )(NA )(NA )
Estimates ( 5 )NANANANA
(p-val)(NA )(NA )(NA )(NA )
Estimates ( 6 )NANANANA
(p-val)(NA )(NA )(NA )(NA )
Estimates ( 7 )NANANANA
(p-val)(NA )(NA )(NA )(NA )

\begin{tabular}{lllllllll}
\hline
ARIMA Parameter Estimation and Backward Selection \tabularnewline
Iteration & ar1 & ar2 & ar3 & ma1 \tabularnewline
Estimates ( 1 ) & 0.5474 & 0.1766 & -0.1598 & -0.1478 \tabularnewline
(p-val) & (0.4232 ) & (0.5636 ) & (0.4008 ) & (0.8277 ) \tabularnewline
Estimates ( 2 ) & 0.4015 & 0.2295 & -0.1307 & 0 \tabularnewline
(p-val) & (0.0109 ) & (0.1545 ) & (0.4085 ) & (NA ) \tabularnewline
Estimates ( 3 ) & 0.3728 & 0.1796 & 0 & 0 \tabularnewline
(p-val) & (0.0159 ) & (0.2322 ) & (NA ) & (NA ) \tabularnewline
Estimates ( 4 ) & 0.4555 & 0 & 0 & 0 \tabularnewline
(p-val) & (0.0016 ) & (NA ) & (NA ) & (NA ) \tabularnewline
Estimates ( 5 ) & NA & NA & NA & NA \tabularnewline
(p-val) & (NA ) & (NA ) & (NA ) & (NA ) \tabularnewline
Estimates ( 6 ) & NA & NA & NA & NA \tabularnewline
(p-val) & (NA ) & (NA ) & (NA ) & (NA ) \tabularnewline
Estimates ( 7 ) & NA & NA & NA & NA \tabularnewline
(p-val) & (NA ) & (NA ) & (NA ) & (NA ) \tabularnewline
\hline
\end{tabular}
%Source: https://freestatistics.org/blog/index.php?pk=301512&T=1

[TABLE]
[ROW][C]ARIMA Parameter Estimation and Backward Selection[/C][/ROW]
[ROW][C]Iteration[/C][C]ar1[/C][C]ar2[/C][C]ar3[/C][C]ma1[/C][/ROW]
[ROW][C]Estimates ( 1 )[/C][C]0.5474[/C][C]0.1766[/C][C]-0.1598[/C][C]-0.1478[/C][/ROW]
[ROW][C](p-val)[/C][C](0.4232 )[/C][C](0.5636 )[/C][C](0.4008 )[/C][C](0.8277 )[/C][/ROW]
[ROW][C]Estimates ( 2 )[/C][C]0.4015[/C][C]0.2295[/C][C]-0.1307[/C][C]0[/C][/ROW]
[ROW][C](p-val)[/C][C](0.0109 )[/C][C](0.1545 )[/C][C](0.4085 )[/C][C](NA )[/C][/ROW]
[ROW][C]Estimates ( 3 )[/C][C]0.3728[/C][C]0.1796[/C][C]0[/C][C]0[/C][/ROW]
[ROW][C](p-val)[/C][C](0.0159 )[/C][C](0.2322 )[/C][C](NA )[/C][C](NA )[/C][/ROW]
[ROW][C]Estimates ( 4 )[/C][C]0.4555[/C][C]0[/C][C]0[/C][C]0[/C][/ROW]
[ROW][C](p-val)[/C][C](0.0016 )[/C][C](NA )[/C][C](NA )[/C][C](NA )[/C][/ROW]
[ROW][C]Estimates ( 5 )[/C][C]NA[/C][C]NA[/C][C]NA[/C][C]NA[/C][/ROW]
[ROW][C](p-val)[/C][C](NA )[/C][C](NA )[/C][C](NA )[/C][C](NA )[/C][/ROW]
[ROW][C]Estimates ( 6 )[/C][C]NA[/C][C]NA[/C][C]NA[/C][C]NA[/C][/ROW]
[ROW][C](p-val)[/C][C](NA )[/C][C](NA )[/C][C](NA )[/C][C](NA )[/C][/ROW]
[ROW][C]Estimates ( 7 )[/C][C]NA[/C][C]NA[/C][C]NA[/C][C]NA[/C][/ROW]
[ROW][C](p-val)[/C][C](NA )[/C][C](NA )[/C][C](NA )[/C][C](NA )[/C][/ROW]
[/TABLE]
Source: https://freestatistics.org/blog/index.php?pk=301512&T=1

Globally Unique Identifier (entire table): ba.freestatistics.org/blog/index.php?pk=301512&T=1

As an alternative you can also use a QR Code:  

The GUIDs for individual cells are displayed in the table below:

ARIMA Parameter Estimation and Backward Selection
Iterationar1ar2ar3ma1
Estimates ( 1 )0.54740.1766-0.1598-0.1478
(p-val)(0.4232 )(0.5636 )(0.4008 )(0.8277 )
Estimates ( 2 )0.40150.2295-0.13070
(p-val)(0.0109 )(0.1545 )(0.4085 )(NA )
Estimates ( 3 )0.37280.179600
(p-val)(0.0159 )(0.2322 )(NA )(NA )
Estimates ( 4 )0.4555000
(p-val)(0.0016 )(NA )(NA )(NA )
Estimates ( 5 )NANANANA
(p-val)(NA )(NA )(NA )(NA )
Estimates ( 6 )NANANANA
(p-val)(NA )(NA )(NA )(NA )
Estimates ( 7 )NANANANA
(p-val)(NA )(NA )(NA )(NA )


Estimated ARIMA Residuals
Value
3.89449746423009
-38.9976360935958
-6.66880398558056
286.057369230953
-40.5658090230309
218.553847039613
-304.285154572849
-54.6368930766303
-296.113038242227
-103.295525949185
151.627847042902
-35.6440454677177
151.244957008649
58.7640091934168
272.54591226062
271.696478411721
-84.8908618207197
-70.1995714116401
34.4558259008372
-129.402804610625
193.150847169358
197.710818841568
-10.503883294884
-67.842458538209
178.176247899964
-139.659592847997
140.554803290138
0.988492978993236
25.2698043705086
16.4102244395162
48.0497585480289
470.926353193142
37.497719564466
-125.807632095714
55.1637312483326
9.39203461618399
158.679886818793
7.45249442166096
-51.0519853197266
14.1106797816392
75.189001843084
65.6381098524316
-180.868471072212
-146.575866493991

\begin{tabular}{lllllllll}
\hline
Estimated ARIMA Residuals \tabularnewline
Value \tabularnewline
3.89449746423009 \tabularnewline
-38.9976360935958 \tabularnewline
-6.66880398558056 \tabularnewline
286.057369230953 \tabularnewline
-40.5658090230309 \tabularnewline
218.553847039613 \tabularnewline
-304.285154572849 \tabularnewline
-54.6368930766303 \tabularnewline
-296.113038242227 \tabularnewline
-103.295525949185 \tabularnewline
151.627847042902 \tabularnewline
-35.6440454677177 \tabularnewline
151.244957008649 \tabularnewline
58.7640091934168 \tabularnewline
272.54591226062 \tabularnewline
271.696478411721 \tabularnewline
-84.8908618207197 \tabularnewline
-70.1995714116401 \tabularnewline
34.4558259008372 \tabularnewline
-129.402804610625 \tabularnewline
193.150847169358 \tabularnewline
197.710818841568 \tabularnewline
-10.503883294884 \tabularnewline
-67.842458538209 \tabularnewline
178.176247899964 \tabularnewline
-139.659592847997 \tabularnewline
140.554803290138 \tabularnewline
0.988492978993236 \tabularnewline
25.2698043705086 \tabularnewline
16.4102244395162 \tabularnewline
48.0497585480289 \tabularnewline
470.926353193142 \tabularnewline
37.497719564466 \tabularnewline
-125.807632095714 \tabularnewline
55.1637312483326 \tabularnewline
9.39203461618399 \tabularnewline
158.679886818793 \tabularnewline
7.45249442166096 \tabularnewline
-51.0519853197266 \tabularnewline
14.1106797816392 \tabularnewline
75.189001843084 \tabularnewline
65.6381098524316 \tabularnewline
-180.868471072212 \tabularnewline
-146.575866493991 \tabularnewline
\hline
\end{tabular}
%Source: https://freestatistics.org/blog/index.php?pk=301512&T=2

[TABLE]
[ROW][C]Estimated ARIMA Residuals[/C][/ROW]
[ROW][C]Value[/C][/ROW]
[ROW][C]3.89449746423009[/C][/ROW]
[ROW][C]-38.9976360935958[/C][/ROW]
[ROW][C]-6.66880398558056[/C][/ROW]
[ROW][C]286.057369230953[/C][/ROW]
[ROW][C]-40.5658090230309[/C][/ROW]
[ROW][C]218.553847039613[/C][/ROW]
[ROW][C]-304.285154572849[/C][/ROW]
[ROW][C]-54.6368930766303[/C][/ROW]
[ROW][C]-296.113038242227[/C][/ROW]
[ROW][C]-103.295525949185[/C][/ROW]
[ROW][C]151.627847042902[/C][/ROW]
[ROW][C]-35.6440454677177[/C][/ROW]
[ROW][C]151.244957008649[/C][/ROW]
[ROW][C]58.7640091934168[/C][/ROW]
[ROW][C]272.54591226062[/C][/ROW]
[ROW][C]271.696478411721[/C][/ROW]
[ROW][C]-84.8908618207197[/C][/ROW]
[ROW][C]-70.1995714116401[/C][/ROW]
[ROW][C]34.4558259008372[/C][/ROW]
[ROW][C]-129.402804610625[/C][/ROW]
[ROW][C]193.150847169358[/C][/ROW]
[ROW][C]197.710818841568[/C][/ROW]
[ROW][C]-10.503883294884[/C][/ROW]
[ROW][C]-67.842458538209[/C][/ROW]
[ROW][C]178.176247899964[/C][/ROW]
[ROW][C]-139.659592847997[/C][/ROW]
[ROW][C]140.554803290138[/C][/ROW]
[ROW][C]0.988492978993236[/C][/ROW]
[ROW][C]25.2698043705086[/C][/ROW]
[ROW][C]16.4102244395162[/C][/ROW]
[ROW][C]48.0497585480289[/C][/ROW]
[ROW][C]470.926353193142[/C][/ROW]
[ROW][C]37.497719564466[/C][/ROW]
[ROW][C]-125.807632095714[/C][/ROW]
[ROW][C]55.1637312483326[/C][/ROW]
[ROW][C]9.39203461618399[/C][/ROW]
[ROW][C]158.679886818793[/C][/ROW]
[ROW][C]7.45249442166096[/C][/ROW]
[ROW][C]-51.0519853197266[/C][/ROW]
[ROW][C]14.1106797816392[/C][/ROW]
[ROW][C]75.189001843084[/C][/ROW]
[ROW][C]65.6381098524316[/C][/ROW]
[ROW][C]-180.868471072212[/C][/ROW]
[ROW][C]-146.575866493991[/C][/ROW]
[/TABLE]
Source: https://freestatistics.org/blog/index.php?pk=301512&T=2

Globally Unique Identifier (entire table): ba.freestatistics.org/blog/index.php?pk=301512&T=2

As an alternative you can also use a QR Code:  

The GUIDs for individual cells are displayed in the table below:

Estimated ARIMA Residuals
Value
3.89449746423009
-38.9976360935958
-6.66880398558056
286.057369230953
-40.5658090230309
218.553847039613
-304.285154572849
-54.6368930766303
-296.113038242227
-103.295525949185
151.627847042902
-35.6440454677177
151.244957008649
58.7640091934168
272.54591226062
271.696478411721
-84.8908618207197
-70.1995714116401
34.4558259008372
-129.402804610625
193.150847169358
197.710818841568
-10.503883294884
-67.842458538209
178.176247899964
-139.659592847997
140.554803290138
0.988492978993236
25.2698043705086
16.4102244395162
48.0497585480289
470.926353193142
37.497719564466
-125.807632095714
55.1637312483326
9.39203461618399
158.679886818793
7.45249442166096
-51.0519853197266
14.1106797816392
75.189001843084
65.6381098524316
-180.868471072212
-146.575866493991


Parameters (Session):
par1 = 12 ;
Parameters (R input):
par1 = FALSE ; par2 = 1 ; par3 = 1 ; par4 = 0 ; par5 = 1 ; par6 = 3 ; par7 = 1 ; par8 = 0 ; par9 = 0 ;
R code (references can be found in the software module):
par9 <- '1'
par8 <- '2'
par7 <- '1'
par6 <- '3'
par5 <- '1'
par4 <- '0'
par3 <- '1'
par2 <- '1'
par1 <- 'FALSE'
library(lattice)
if (par1 == 'TRUE') par1 <- TRUE
if (par1 == 'FALSE') par1 <- FALSE
par2 <- as.numeric(par2) #Box-Cox lambda transformation parameter
par3 <- as.numeric(par3) #degree of non-seasonal differencing
par4 <- as.numeric(par4) #degree of seasonal differencing
par5 <- as.numeric(par5) #seasonal period
par6 <- as.numeric(par6) #degree (p) of the non-seasonal AR(p) polynomial
par7 <- as.numeric(par7) #degree (q) of the non-seasonal MA(q) polynomial
par8 <- as.numeric(par8) #degree (P) of the seasonal AR(P) polynomial
par9 <- as.numeric(par9) #degree (Q) of the seasonal MA(Q) polynomial
armaGR <- function(arima.out, names, n){
try1 <- arima.out$coef
try2 <- sqrt(diag(arima.out$var.coef))
try.data.frame <- data.frame(matrix(NA,ncol=4,nrow=length(names)))
dimnames(try.data.frame) <- list(names,c('coef','std','tstat','pv'))
try.data.frame[,1] <- try1
for(i in 1:length(try2)) try.data.frame[which(rownames(try.data.frame)==names(try2)[i]),2] <- try2[i]
try.data.frame[,3] <- try.data.frame[,1] / try.data.frame[,2]
try.data.frame[,4] <- round((1-pt(abs(try.data.frame[,3]),df=n-(length(try2)+1)))*2,5)
vector <- rep(NA,length(names))
vector[is.na(try.data.frame[,4])] <- 0
maxi <- which.max(try.data.frame[,4])
continue <- max(try.data.frame[,4],na.rm=TRUE) > .05
vector[maxi] <- 0
list(summary=try.data.frame,next.vector=vector,continue=continue)
}
arimaSelect <- function(series, order=c(13,0,0), seasonal=list(order=c(2,0,0),period=12), include.mean=F){
nrc <- order[1]+order[3]+seasonal$order[1]+seasonal$order[3]
coeff <- matrix(NA, nrow=nrc*2, ncol=nrc)
pval <- matrix(NA, nrow=nrc*2, ncol=nrc)
mylist <- rep(list(NULL), nrc)
names <- NULL
if(order[1] > 0) names <- paste('ar',1:order[1],sep='')
if(order[3] > 0) names <- c( names , paste('ma',1:order[3],sep='') )
if(seasonal$order[1] > 0) names <- c(names, paste('sar',1:seasonal$order[1],sep=''))
if(seasonal$order[3] > 0) names <- c(names, paste('sma',1:seasonal$order[3],sep=''))
arima.out <- arima(series, order=order, seasonal=seasonal, include.mean=include.mean, method='ML')
mylist[[1]] <- arima.out
last.arma <- armaGR(arima.out, names, length(series))
mystop <- FALSE
i <- 1
coeff[i,] <- last.arma[[1]][,1]
pval [i,] <- last.arma[[1]][,4]
i <- 2
aic <- arima.out$aic
while(!mystop){
mylist[[i]] <- arima.out
arima.out <- arima(series, order=order, seasonal=seasonal, include.mean=include.mean, method='ML', fixed=last.arma$next.vector)
aic <- c(aic, arima.out$aic)
last.arma <- armaGR(arima.out, names, length(series))
mystop <- !last.arma$continue
coeff[i,] <- last.arma[[1]][,1]
pval [i,] <- last.arma[[1]][,4]
i <- i+1
}
list(coeff, pval, mylist, aic=aic)
}
arimaSelectplot <- function(arimaSelect.out,noms,choix){
noms <- names(arimaSelect.out[[3]][[1]]$coef)
coeff <- arimaSelect.out[[1]]
k <- min(which(is.na(coeff[,1])))-1
coeff <- coeff[1:k,]
pval <- arimaSelect.out[[2]][1:k,]
aic <- arimaSelect.out$aic[1:k]
coeff[coeff==0] <- NA
n <- ncol(coeff)
if(missing(choix)) choix <- k
layout(matrix(c(1,1,1,2,
3,3,3,2,
3,3,3,4,
5,6,7,7),nr=4),
widths=c(10,35,45,15),
heights=c(30,30,15,15))
couleurs <- rainbow(75)[1:50]#(50)
ticks <- pretty(coeff)
par(mar=c(1,1,3,1))
plot(aic,k:1-.5,type='o',pch=21,bg='blue',cex=2,axes=F,lty=2,xpd=NA)
points(aic[choix],k-choix+.5,pch=21,cex=4,bg=2,xpd=NA)
title('aic',line=2)
par(mar=c(3,0,0,0))
plot(0,axes=F,xlab='',ylab='',xlim=range(ticks),ylim=c(.1,1))
rect(xleft = min(ticks) + (0:49)/50*(max(ticks)-min(ticks)),
xright = min(ticks) + (1:50)/50*(max(ticks)-min(ticks)),
ytop = rep(1,50),
ybottom= rep(0,50),col=couleurs,border=NA)
axis(1,ticks)
rect(xleft=min(ticks),xright=max(ticks),ytop=1,ybottom=0)
text(mean(coeff,na.rm=T),.5,'coefficients',cex=2,font=2)
par(mar=c(1,1,3,1))
image(1:n,1:k,t(coeff[k:1,]),axes=F,col=couleurs,zlim=range(ticks))
for(i in 1:n) for(j in 1:k) if(!is.na(coeff[j,i])) {
if(pval[j,i]<.01) symb = 'green'
else if( (pval[j,i]<.05) & (pval[j,i]>=.01)) symb = 'orange'
else if( (pval[j,i]<.1) & (pval[j,i]>=.05)) symb = 'red'
else symb = 'black'
polygon(c(i+.5 ,i+.2 ,i+.5 ,i+.5),
c(k-j+0.5,k-j+0.5,k-j+0.8,k-j+0.5),
col=symb)
if(j==choix) {
rect(xleft=i-.5,
xright=i+.5,
ybottom=k-j+1.5,
ytop=k-j+.5,
lwd=4)
text(i,
k-j+1,
round(coeff[j,i],2),
cex=1.2,
font=2)
}
else{
rect(xleft=i-.5,xright=i+.5,ybottom=k-j+1.5,ytop=k-j+.5)
text(i,k-j+1,round(coeff[j,i],2),cex=1.2,font=1)
}
}
axis(3,1:n,noms)
par(mar=c(0.5,0,0,0.5))
plot(0,axes=F,xlab='',ylab='',type='n',xlim=c(0,8),ylim=c(-.2,.8))
cols <- c('green','orange','red','black')
niv <- c('0','0.01','0.05','0.1')
for(i in 0:3){
polygon(c(1+2*i ,1+2*i ,1+2*i-.5 ,1+2*i),
c(.4 ,.7 , .4 , .4),
col=cols[i+1])
text(2*i,0.5,niv[i+1],cex=1.5)
}
text(8,.5,1,cex=1.5)
text(4,0,'p-value',cex=2)
box()
residus <- arimaSelect.out[[3]][[choix]]$res
par(mar=c(1,2,4,1))
acf(residus,main='')
title('acf',line=.5)
par(mar=c(1,2,4,1))
pacf(residus,main='')
title('pacf',line=.5)
par(mar=c(2,2,4,1))
qqnorm(residus,main='')
title('qq-norm',line=.5)
qqline(residus)
residus
}
if (par2 == 0) x <- log(x)
if (par2 != 0) x <- x^par2
(selection <- arimaSelect(x, order=c(par6,par3,par7), seasonal=list(order=c(par8,par4,par9), period=par5)))
bitmap(file='test1.png')
resid <- arimaSelectplot(selection)
dev.off()
resid
bitmap(file='test2.png')
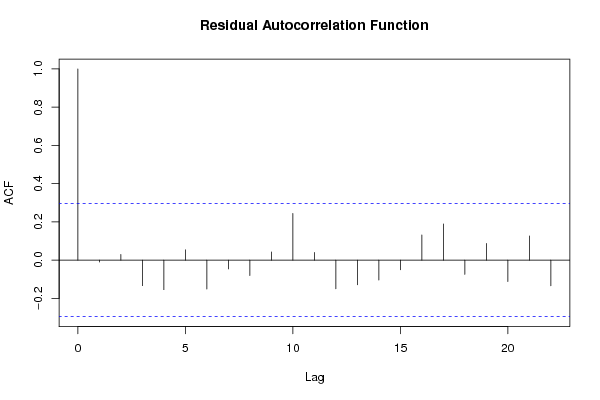
acf(resid,length(resid)/2, main='Residual Autocorrelation Function')
dev.off()
bitmap(file='test3.png')
pacf(resid,length(resid)/2, main='Residual Partial Autocorrelation Function')
dev.off()
bitmap(file='test4.png')
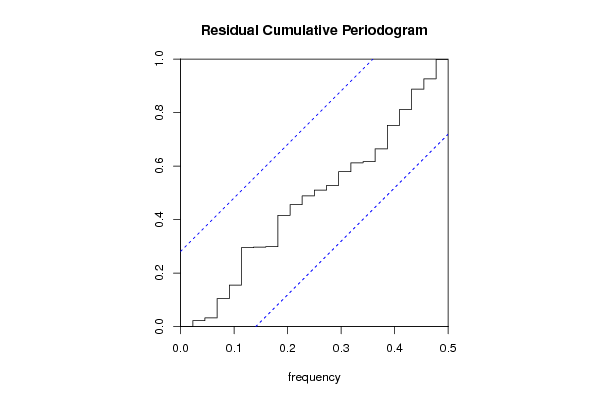
cpgram(resid, main='Residual Cumulative Periodogram')
dev.off()
bitmap(file='test5.png')
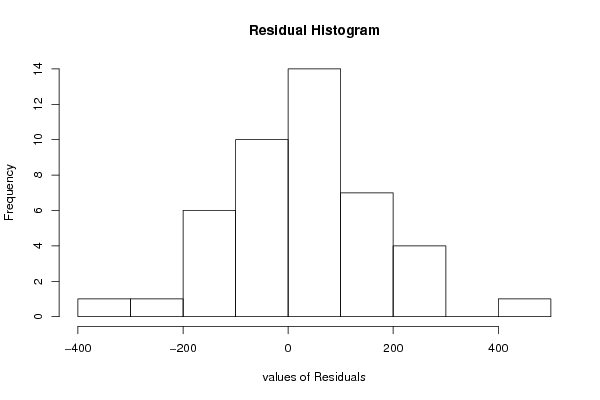
hist(resid, main='Residual Histogram', xlab='values of Residuals')
dev.off()
bitmap(file='test6.png')
densityplot(~resid,col='black',main='Residual Density Plot', xlab='values of Residuals')
dev.off()
bitmap(file='test7.png')
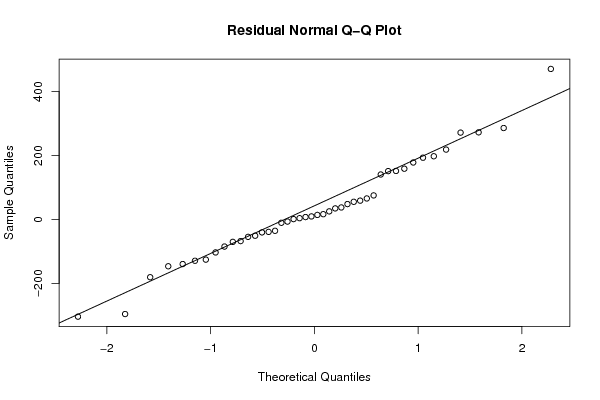
qqnorm(resid, main='Residual Normal Q-Q Plot')
qqline(resid)
dev.off()
ncols <- length(selection[[1]][1,])
nrows <- length(selection[[2]][,1])-1
load(file='createtable')
a<-table.start()
a<-table.row.start(a)
a<-table.element(a,'ARIMA Parameter Estimation and Backward Selection', ncols+1,TRUE)
a<-table.row.end(a)
a<-table.row.start(a)
a<-table.element(a,'Iteration', header=TRUE)
for (i in 1:ncols) {
a<-table.element(a,names(selection[[3]][[1]]$coef)[i],header=TRUE)
}
a<-table.row.end(a)
for (j in 1:nrows) {
a<-table.row.start(a)
mydum <- 'Estimates ('
mydum <- paste(mydum,j)
mydum <- paste(mydum,')')
a<-table.element(a,mydum, header=TRUE)
for (i in 1:ncols) {
a<-table.element(a,round(selection[[1]][j,i],4))
}
a<-table.row.end(a)
a<-table.row.start(a)
a<-table.element(a,'(p-val)', header=TRUE)
for (i in 1:ncols) {
mydum <- '('
mydum <- paste(mydum,round(selection[[2]][j,i],4),sep='')
mydum <- paste(mydum,')')
a<-table.element(a,mydum)
}
a<-table.row.end(a)
}
a<-table.end(a)
table.save(a,file='mytable.tab')
a<-table.start()
a<-table.row.start(a)
a<-table.element(a,'Estimated ARIMA Residuals', 1,TRUE)
a<-table.row.end(a)
a<-table.row.start(a)
a<-table.element(a,'Value', 1,TRUE)
a<-table.row.end(a)
for (i in (par4*par5+par3):length(resid)) {
a<-table.row.start(a)
a<-table.element(a,resid[i])
a<-table.row.end(a)
}
a<-table.end(a)
table.save(a,file='mytable1.tab')