Free Statistics

of Irreproducible Research!

Author's title

Author*The author of this computation has been verified*
R Software Modulerwasp_exponentialsmoothing.wasp
Title produced by softwareExponential Smoothing
Date of computationMon, 19 Dec 2016 22:07:38 +0100
Cite this page as followsStatistical Computations at FreeStatistics.org, Office for Research Development and Education, URL https://freestatistics.org/blog/index.php?v=date/2016/Dec/19/t1482181724qqdh32trys9101u.htm/, Retrieved Tue, 21 May 2024 08:56:38 +0000
Statistical Computations at FreeStatistics.org, Office for Research Development and Education, URL https://freestatistics.org/blog/index.php?pk=301511, Retrieved Tue, 21 May 2024 08:56:38 +0000
QR Codes:

Original text written by user:
IsPrivate?No (this computation is public)
User-defined keywords
Estimated Impact50
Family? (F = Feedback message, R = changed R code, M = changed R Module, P = changed Parameters, D = changed Data)
-       [Exponential Smoothing] [] [2016-12-19 21:07:38] [2e11ca31a00cf8de75c33c1af2d59434] [Current]
Feedback Forum

Post a new message
Dataseries X:
3894.5
3850
3823
4091
4145.5
4432.5
4245
4172
3815
3565.5
3560
3477.5
3597
3685.5
4012.5
4422
4548.5
4599
4675
4583
4755.5
5001
5113
5131
5336
5276
5431
5479
5550
5601.5
5681.5
6191.5
6433.5
6489.5
6609
6673
6877
6972
6993
7032
7125.5
7233
7109
6935.5


Summary of computational transaction
Raw Input view raw input (R code)
Raw Outputview raw output of R engine
Computing time1 seconds
R ServerBig Analytics Cloud Computing Center

\begin{tabular}{lllllllll}
\hline
Summary of computational transaction \tabularnewline
Raw Input view raw input (R code)  \tabularnewline
Raw Outputview raw output of R engine  \tabularnewline
Computing time1 seconds \tabularnewline
R ServerBig Analytics Cloud Computing Center \tabularnewline
\hline
\end{tabular}
%Source: https://freestatistics.org/blog/index.php?pk=301511&T=0

[TABLE]
[ROW]
Summary of computational transaction[/C][/ROW] [ROW]Raw Input[/C] view raw input (R code) [/C][/ROW] [ROW]Raw Output[/C]view raw output of R engine [/C][/ROW] [ROW]Computing time[/C]1 seconds[/C][/ROW] [ROW]R Server[/C]Big Analytics Cloud Computing Center[/C][/ROW] [/TABLE] Source: https://freestatistics.org/blog/index.php?pk=301511&T=0

Globally Unique Identifier (entire table): ba.freestatistics.org/blog/index.php?pk=301511&T=0

As an alternative you can also use a QR Code:  

The GUIDs for individual cells are displayed in the table below:

Summary of computational transaction
Raw Input view raw input (R code)
Raw Outputview raw output of R engine
Computing time1 seconds
R ServerBig Analytics Cloud Computing Center


Estimated Parameters of Exponential Smoothing
ParameterValue
alpha1
beta0.435726865225226
gammaFALSE

\begin{tabular}{lllllllll}
\hline
Estimated Parameters of Exponential Smoothing \tabularnewline
Parameter & Value \tabularnewline
alpha & 1 \tabularnewline
beta & 0.435726865225226 \tabularnewline
gamma & FALSE \tabularnewline
\hline
\end{tabular}
%Source: https://freestatistics.org/blog/index.php?pk=301511&T=1

[TABLE]
[ROW][C]Estimated Parameters of Exponential Smoothing[/C][/ROW]
[ROW][C]Parameter[/C][C]Value[/C][/ROW]
[ROW][C]alpha[/C][C]1[/C][/ROW]
[ROW][C]beta[/C][C]0.435726865225226[/C][/ROW]
[ROW][C]gamma[/C][C]FALSE[/C][/ROW]
[/TABLE]
Source: https://freestatistics.org/blog/index.php?pk=301511&T=1

Globally Unique Identifier (entire table): ba.freestatistics.org/blog/index.php?pk=301511&T=1

As an alternative you can also use a QR Code:  

The GUIDs for individual cells are displayed in the table below:

Estimated Parameters of Exponential Smoothing
ParameterValue
alpha1
beta0.435726865225226
gammaFALSE


Interpolation Forecasts of Exponential Smoothing
tObservedFittedResiduals
338233805.517.5
440913786.12522014144304.874779858559
54145.54186.96735225544-41.4673522554422
64432.54223.39891284799209.101087152012
742454601.50987406792-356.50987406792
841724258.66894421847-86.6689442184661
938154147.90495684177-332.904956841774
103565.53645.84932357917-80.3493235791684
1135603361.33896469305198.66103530695
123477.53442.4009148497535.0990851502547
1335973375.19452919454221.805470805461
143685.53591.3411316784194.1588683215923
154012.53720.86868020533291.63131979467
1644224174.94028098096247.059719019043
174548.54692.09083787255-143.59083787255
1845994756.02445221128-157.02445221128
1946754738.10467988555-63.1046798855505
2045834786.60827553798-203.608275537978
214755.54605.8906799039149.609320096099
2250014843.57947995785157.420520042148
2351135157.67182967794-44.6718296779418
2451315250.2071133685-119.207113368497
2553365216.26537154789119.734628452106
2652765473.43696586224-197.436965862237
2754315327.4083756475103.591624352495
2854795527.54602939021-48.546029390207
2955505554.39322018488-4.39322018488019
305601.55623.47897612548-21.9789761254779
315681.55665.4021457574616.0978542425364
326191.55752.41641332342439.083586676584
336433.56453.73692811785-20.2369281178526
346489.56686.91915486727-197.419154867272
3566096656.89832538154-47.8983253815422
3666736755.52773821351-82.5277382135055
3768776783.5681855476193.4318144523932
3869727028.27893717125-56.2789371712524
3969937098.75669229942-105.756692299416
4070327073.6756602872-41.6756602872019
417125.57094.5164554740730.9835445259314
4272337201.5168182039231.4831817960812
4371097322.73488631524-213.734886315241
446935.57105.60485431183-170.104854311831

\begin{tabular}{lllllllll}
\hline
Interpolation Forecasts of Exponential Smoothing \tabularnewline
t & Observed & Fitted & Residuals \tabularnewline
3 & 3823 & 3805.5 & 17.5 \tabularnewline
4 & 4091 & 3786.12522014144 & 304.874779858559 \tabularnewline
5 & 4145.5 & 4186.96735225544 & -41.4673522554422 \tabularnewline
6 & 4432.5 & 4223.39891284799 & 209.101087152012 \tabularnewline
7 & 4245 & 4601.50987406792 & -356.50987406792 \tabularnewline
8 & 4172 & 4258.66894421847 & -86.6689442184661 \tabularnewline
9 & 3815 & 4147.90495684177 & -332.904956841774 \tabularnewline
10 & 3565.5 & 3645.84932357917 & -80.3493235791684 \tabularnewline
11 & 3560 & 3361.33896469305 & 198.66103530695 \tabularnewline
12 & 3477.5 & 3442.40091484975 & 35.0990851502547 \tabularnewline
13 & 3597 & 3375.19452919454 & 221.805470805461 \tabularnewline
14 & 3685.5 & 3591.34113167841 & 94.1588683215923 \tabularnewline
15 & 4012.5 & 3720.86868020533 & 291.63131979467 \tabularnewline
16 & 4422 & 4174.94028098096 & 247.059719019043 \tabularnewline
17 & 4548.5 & 4692.09083787255 & -143.59083787255 \tabularnewline
18 & 4599 & 4756.02445221128 & -157.02445221128 \tabularnewline
19 & 4675 & 4738.10467988555 & -63.1046798855505 \tabularnewline
20 & 4583 & 4786.60827553798 & -203.608275537978 \tabularnewline
21 & 4755.5 & 4605.8906799039 & 149.609320096099 \tabularnewline
22 & 5001 & 4843.57947995785 & 157.420520042148 \tabularnewline
23 & 5113 & 5157.67182967794 & -44.6718296779418 \tabularnewline
24 & 5131 & 5250.2071133685 & -119.207113368497 \tabularnewline
25 & 5336 & 5216.26537154789 & 119.734628452106 \tabularnewline
26 & 5276 & 5473.43696586224 & -197.436965862237 \tabularnewline
27 & 5431 & 5327.4083756475 & 103.591624352495 \tabularnewline
28 & 5479 & 5527.54602939021 & -48.546029390207 \tabularnewline
29 & 5550 & 5554.39322018488 & -4.39322018488019 \tabularnewline
30 & 5601.5 & 5623.47897612548 & -21.9789761254779 \tabularnewline
31 & 5681.5 & 5665.40214575746 & 16.0978542425364 \tabularnewline
32 & 6191.5 & 5752.41641332342 & 439.083586676584 \tabularnewline
33 & 6433.5 & 6453.73692811785 & -20.2369281178526 \tabularnewline
34 & 6489.5 & 6686.91915486727 & -197.419154867272 \tabularnewline
35 & 6609 & 6656.89832538154 & -47.8983253815422 \tabularnewline
36 & 6673 & 6755.52773821351 & -82.5277382135055 \tabularnewline
37 & 6877 & 6783.56818554761 & 93.4318144523932 \tabularnewline
38 & 6972 & 7028.27893717125 & -56.2789371712524 \tabularnewline
39 & 6993 & 7098.75669229942 & -105.756692299416 \tabularnewline
40 & 7032 & 7073.6756602872 & -41.6756602872019 \tabularnewline
41 & 7125.5 & 7094.51645547407 & 30.9835445259314 \tabularnewline
42 & 7233 & 7201.51681820392 & 31.4831817960812 \tabularnewline
43 & 7109 & 7322.73488631524 & -213.734886315241 \tabularnewline
44 & 6935.5 & 7105.60485431183 & -170.104854311831 \tabularnewline
\hline
\end{tabular}
%Source: https://freestatistics.org/blog/index.php?pk=301511&T=2

[TABLE]
[ROW][C]Interpolation Forecasts of Exponential Smoothing[/C][/ROW]
[ROW][C]t[/C][C]Observed[/C][C]Fitted[/C][C]Residuals[/C][/ROW]
[ROW][C]3[/C][C]3823[/C][C]3805.5[/C][C]17.5[/C][/ROW]
[ROW][C]4[/C][C]4091[/C][C]3786.12522014144[/C][C]304.874779858559[/C][/ROW]
[ROW][C]5[/C][C]4145.5[/C][C]4186.96735225544[/C][C]-41.4673522554422[/C][/ROW]
[ROW][C]6[/C][C]4432.5[/C][C]4223.39891284799[/C][C]209.101087152012[/C][/ROW]
[ROW][C]7[/C][C]4245[/C][C]4601.50987406792[/C][C]-356.50987406792[/C][/ROW]
[ROW][C]8[/C][C]4172[/C][C]4258.66894421847[/C][C]-86.6689442184661[/C][/ROW]
[ROW][C]9[/C][C]3815[/C][C]4147.90495684177[/C][C]-332.904956841774[/C][/ROW]
[ROW][C]10[/C][C]3565.5[/C][C]3645.84932357917[/C][C]-80.3493235791684[/C][/ROW]
[ROW][C]11[/C][C]3560[/C][C]3361.33896469305[/C][C]198.66103530695[/C][/ROW]
[ROW][C]12[/C][C]3477.5[/C][C]3442.40091484975[/C][C]35.0990851502547[/C][/ROW]
[ROW][C]13[/C][C]3597[/C][C]3375.19452919454[/C][C]221.805470805461[/C][/ROW]
[ROW][C]14[/C][C]3685.5[/C][C]3591.34113167841[/C][C]94.1588683215923[/C][/ROW]
[ROW][C]15[/C][C]4012.5[/C][C]3720.86868020533[/C][C]291.63131979467[/C][/ROW]
[ROW][C]16[/C][C]4422[/C][C]4174.94028098096[/C][C]247.059719019043[/C][/ROW]
[ROW][C]17[/C][C]4548.5[/C][C]4692.09083787255[/C][C]-143.59083787255[/C][/ROW]
[ROW][C]18[/C][C]4599[/C][C]4756.02445221128[/C][C]-157.02445221128[/C][/ROW]
[ROW][C]19[/C][C]4675[/C][C]4738.10467988555[/C][C]-63.1046798855505[/C][/ROW]
[ROW][C]20[/C][C]4583[/C][C]4786.60827553798[/C][C]-203.608275537978[/C][/ROW]
[ROW][C]21[/C][C]4755.5[/C][C]4605.8906799039[/C][C]149.609320096099[/C][/ROW]
[ROW][C]22[/C][C]5001[/C][C]4843.57947995785[/C][C]157.420520042148[/C][/ROW]
[ROW][C]23[/C][C]5113[/C][C]5157.67182967794[/C][C]-44.6718296779418[/C][/ROW]
[ROW][C]24[/C][C]5131[/C][C]5250.2071133685[/C][C]-119.207113368497[/C][/ROW]
[ROW][C]25[/C][C]5336[/C][C]5216.26537154789[/C][C]119.734628452106[/C][/ROW]
[ROW][C]26[/C][C]5276[/C][C]5473.43696586224[/C][C]-197.436965862237[/C][/ROW]
[ROW][C]27[/C][C]5431[/C][C]5327.4083756475[/C][C]103.591624352495[/C][/ROW]
[ROW][C]28[/C][C]5479[/C][C]5527.54602939021[/C][C]-48.546029390207[/C][/ROW]
[ROW][C]29[/C][C]5550[/C][C]5554.39322018488[/C][C]-4.39322018488019[/C][/ROW]
[ROW][C]30[/C][C]5601.5[/C][C]5623.47897612548[/C][C]-21.9789761254779[/C][/ROW]
[ROW][C]31[/C][C]5681.5[/C][C]5665.40214575746[/C][C]16.0978542425364[/C][/ROW]
[ROW][C]32[/C][C]6191.5[/C][C]5752.41641332342[/C][C]439.083586676584[/C][/ROW]
[ROW][C]33[/C][C]6433.5[/C][C]6453.73692811785[/C][C]-20.2369281178526[/C][/ROW]
[ROW][C]34[/C][C]6489.5[/C][C]6686.91915486727[/C][C]-197.419154867272[/C][/ROW]
[ROW][C]35[/C][C]6609[/C][C]6656.89832538154[/C][C]-47.8983253815422[/C][/ROW]
[ROW][C]36[/C][C]6673[/C][C]6755.52773821351[/C][C]-82.5277382135055[/C][/ROW]
[ROW][C]37[/C][C]6877[/C][C]6783.56818554761[/C][C]93.4318144523932[/C][/ROW]
[ROW][C]38[/C][C]6972[/C][C]7028.27893717125[/C][C]-56.2789371712524[/C][/ROW]
[ROW][C]39[/C][C]6993[/C][C]7098.75669229942[/C][C]-105.756692299416[/C][/ROW]
[ROW][C]40[/C][C]7032[/C][C]7073.6756602872[/C][C]-41.6756602872019[/C][/ROW]
[ROW][C]41[/C][C]7125.5[/C][C]7094.51645547407[/C][C]30.9835445259314[/C][/ROW]
[ROW][C]42[/C][C]7233[/C][C]7201.51681820392[/C][C]31.4831817960812[/C][/ROW]
[ROW][C]43[/C][C]7109[/C][C]7322.73488631524[/C][C]-213.734886315241[/C][/ROW]
[ROW][C]44[/C][C]6935.5[/C][C]7105.60485431183[/C][C]-170.104854311831[/C][/ROW]
[/TABLE]
Source: https://freestatistics.org/blog/index.php?pk=301511&T=2

Globally Unique Identifier (entire table): ba.freestatistics.org/blog/index.php?pk=301511&T=2

As an alternative you can also use a QR Code:  

The GUIDs for individual cells are displayed in the table below:

Interpolation Forecasts of Exponential Smoothing
tObservedFittedResiduals
338233805.517.5
440913786.12522014144304.874779858559
54145.54186.96735225544-41.4673522554422
64432.54223.39891284799209.101087152012
742454601.50987406792-356.50987406792
841724258.66894421847-86.6689442184661
938154147.90495684177-332.904956841774
103565.53645.84932357917-80.3493235791684
1135603361.33896469305198.66103530695
123477.53442.4009148497535.0990851502547
1335973375.19452919454221.805470805461
143685.53591.3411316784194.1588683215923
154012.53720.86868020533291.63131979467
1644224174.94028098096247.059719019043
174548.54692.09083787255-143.59083787255
1845994756.02445221128-157.02445221128
1946754738.10467988555-63.1046798855505
2045834786.60827553798-203.608275537978
214755.54605.8906799039149.609320096099
2250014843.57947995785157.420520042148
2351135157.67182967794-44.6718296779418
2451315250.2071133685-119.207113368497
2553365216.26537154789119.734628452106
2652765473.43696586224-197.436965862237
2754315327.4083756475103.591624352495
2854795527.54602939021-48.546029390207
2955505554.39322018488-4.39322018488019
305601.55623.47897612548-21.9789761254779
315681.55665.4021457574616.0978542425364
326191.55752.41641332342439.083586676584
336433.56453.73692811785-20.2369281178526
346489.56686.91915486727-197.419154867272
3566096656.89832538154-47.8983253815422
3666736755.52773821351-82.5277382135055
3768776783.5681855476193.4318144523932
3869727028.27893717125-56.2789371712524
3969937098.75669229942-105.756692299416
4070327073.6756602872-41.6756602872019
417125.57094.5164554740730.9835445259314
4272337201.5168182039231.4831817960812
4371097322.73488631524-213.734886315241
446935.57105.60485431183-170.104854311831


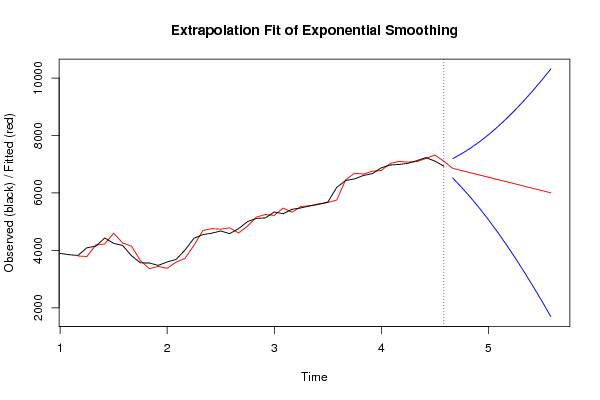
Extrapolation Forecasts of Exponential Smoothing
tForecast95% Lower Bound95% Upper Bound
456857.985599382946522.783776039897193.187422726
466780.471198765896193.981831323767366.96056620802
476702.956798148835844.182372348947561.73122394872
486625.442397531775469.762321392297781.12247367126
496547.927996914725071.12621021028024.72978361923
506470.413596297664649.370016904518291.45717569081
516392.89919568064205.656637561068580.14175380015
526315.384795063553741.06947747488889.70011265229
536237.870394446493256.583302572479219.15748632051
546160.355993829432753.067470000759567.64451765811
556082.841593212382231.297564793469934.38562163129
566005.327192595321691.9681018127710318.6862833779

\begin{tabular}{lllllllll}
\hline
Extrapolation Forecasts of Exponential Smoothing \tabularnewline
t & Forecast & 95% Lower Bound & 95% Upper Bound \tabularnewline
45 & 6857.98559938294 & 6522.78377603989 & 7193.187422726 \tabularnewline
46 & 6780.47119876589 & 6193.98183132376 & 7366.96056620802 \tabularnewline
47 & 6702.95679814883 & 5844.18237234894 & 7561.73122394872 \tabularnewline
48 & 6625.44239753177 & 5469.76232139229 & 7781.12247367126 \tabularnewline
49 & 6547.92799691472 & 5071.1262102102 & 8024.72978361923 \tabularnewline
50 & 6470.41359629766 & 4649.37001690451 & 8291.45717569081 \tabularnewline
51 & 6392.8991956806 & 4205.65663756106 & 8580.14175380015 \tabularnewline
52 & 6315.38479506355 & 3741.0694774748 & 8889.70011265229 \tabularnewline
53 & 6237.87039444649 & 3256.58330257247 & 9219.15748632051 \tabularnewline
54 & 6160.35599382943 & 2753.06747000075 & 9567.64451765811 \tabularnewline
55 & 6082.84159321238 & 2231.29756479346 & 9934.38562163129 \tabularnewline
56 & 6005.32719259532 & 1691.96810181277 & 10318.6862833779 \tabularnewline
\hline
\end{tabular}
%Source: https://freestatistics.org/blog/index.php?pk=301511&T=3

[TABLE]
[ROW][C]Extrapolation Forecasts of Exponential Smoothing[/C][/ROW]
[ROW][C]t[/C][C]Forecast[/C][C]95% Lower Bound[/C][C]95% Upper Bound[/C][/ROW]
[ROW][C]45[/C][C]6857.98559938294[/C][C]6522.78377603989[/C][C]7193.187422726[/C][/ROW]
[ROW][C]46[/C][C]6780.47119876589[/C][C]6193.98183132376[/C][C]7366.96056620802[/C][/ROW]
[ROW][C]47[/C][C]6702.95679814883[/C][C]5844.18237234894[/C][C]7561.73122394872[/C][/ROW]
[ROW][C]48[/C][C]6625.44239753177[/C][C]5469.76232139229[/C][C]7781.12247367126[/C][/ROW]
[ROW][C]49[/C][C]6547.92799691472[/C][C]5071.1262102102[/C][C]8024.72978361923[/C][/ROW]
[ROW][C]50[/C][C]6470.41359629766[/C][C]4649.37001690451[/C][C]8291.45717569081[/C][/ROW]
[ROW][C]51[/C][C]6392.8991956806[/C][C]4205.65663756106[/C][C]8580.14175380015[/C][/ROW]
[ROW][C]52[/C][C]6315.38479506355[/C][C]3741.0694774748[/C][C]8889.70011265229[/C][/ROW]
[ROW][C]53[/C][C]6237.87039444649[/C][C]3256.58330257247[/C][C]9219.15748632051[/C][/ROW]
[ROW][C]54[/C][C]6160.35599382943[/C][C]2753.06747000075[/C][C]9567.64451765811[/C][/ROW]
[ROW][C]55[/C][C]6082.84159321238[/C][C]2231.29756479346[/C][C]9934.38562163129[/C][/ROW]
[ROW][C]56[/C][C]6005.32719259532[/C][C]1691.96810181277[/C][C]10318.6862833779[/C][/ROW]
[/TABLE]
Source: https://freestatistics.org/blog/index.php?pk=301511&T=3

Globally Unique Identifier (entire table): ba.freestatistics.org/blog/index.php?pk=301511&T=3

As an alternative you can also use a QR Code:  

The GUIDs for individual cells are displayed in the table below:

Extrapolation Forecasts of Exponential Smoothing
tForecast95% Lower Bound95% Upper Bound
456857.985599382946522.783776039897193.187422726
466780.471198765896193.981831323767366.96056620802
476702.956798148835844.182372348947561.73122394872
486625.442397531775469.762321392297781.12247367126
496547.927996914725071.12621021028024.72978361923
506470.413596297664649.370016904518291.45717569081
516392.89919568064205.656637561068580.14175380015
526315.384795063553741.06947747488889.70011265229
536237.870394446493256.583302572479219.15748632051
546160.355993829432753.067470000759567.64451765811
556082.841593212382231.297564793469934.38562163129
566005.327192595321691.9681018127710318.6862833779


Parameters (Session):
par1 = 12 ;
Parameters (R input):
par1 = 12 ; par2 = Double ; par3 = additive ; par4 = 12 ;
R code (references can be found in the software module):
par1 <- as.numeric(par1)
par4 <- as.numeric(par4)
if (par2 == 'Single') K <- 1
if (par2 == 'Double') K <- 2
if (par2 == 'Triple') K <- par1
nx <- length(x)
nxmK <- nx - K
x <- ts(x, frequency = par1)
if (par2 == 'Single') fit <- HoltWinters(x, gamma=F, beta=F)
if (par2 == 'Double') fit <- HoltWinters(x, gamma=F)
if (par2 == 'Triple') fit <- HoltWinters(x, seasonal=par3)
fit
myresid <- x - fit$fitted[,'xhat']
bitmap(file='test1.png')
op <- par(mfrow=c(2,1))
plot(fit,ylab='Observed (black) / Fitted (red)',main='Interpolation Fit of Exponential Smoothing')
plot(myresid,ylab='Residuals',main='Interpolation Prediction Errors')
par(op)
dev.off()
bitmap(file='test2.png')
p <- predict(fit, par4, prediction.interval=TRUE)
np <- length(p[,1])
plot(fit,p,ylab='Observed (black) / Fitted (red)',main='Extrapolation Fit of Exponential Smoothing')
dev.off()
bitmap(file='test3.png')
op <- par(mfrow = c(2,2))
acf(as.numeric(myresid),lag.max = nx/2,main='Residual ACF')
spectrum(myresid,main='Residals Periodogram')
cpgram(myresid,main='Residal Cumulative Periodogram')
qqnorm(myresid,main='Residual Normal QQ Plot')
qqline(myresid)
par(op)
dev.off()
load(file='createtable')
a<-table.start()
a<-table.row.start(a)
a<-table.element(a,'Estimated Parameters of Exponential Smoothing',2,TRUE)
a<-table.row.end(a)
a<-table.row.start(a)
a<-table.element(a,'Parameter',header=TRUE)
a<-table.element(a,'Value',header=TRUE)
a<-table.row.end(a)
a<-table.row.start(a)
a<-table.element(a,'alpha',header=TRUE)
a<-table.element(a,fit$alpha)
a<-table.row.end(a)
a<-table.row.start(a)
a<-table.element(a,'beta',header=TRUE)
a<-table.element(a,fit$beta)
a<-table.row.end(a)
a<-table.row.start(a)
a<-table.element(a,'gamma',header=TRUE)
a<-table.element(a,fit$gamma)
a<-table.row.end(a)
a<-table.end(a)
table.save(a,file='mytable.tab')
a<-table.start()
a<-table.row.start(a)
a<-table.element(a,'Interpolation Forecasts of Exponential Smoothing',4,TRUE)
a<-table.row.end(a)
a<-table.row.start(a)
a<-table.element(a,'t',header=TRUE)
a<-table.element(a,'Observed',header=TRUE)
a<-table.element(a,'Fitted',header=TRUE)
a<-table.element(a,'Residuals',header=TRUE)
a<-table.row.end(a)
for (i in 1:nxmK) {
a<-table.row.start(a)
a<-table.element(a,i+K,header=TRUE)
a<-table.element(a,x[i+K])
a<-table.element(a,fit$fitted[i,'xhat'])
a<-table.element(a,myresid[i])
a<-table.row.end(a)
}
a<-table.end(a)
table.save(a,file='mytable1.tab')
a<-table.start()
a<-table.row.start(a)
a<-table.element(a,'Extrapolation Forecasts of Exponential Smoothing',4,TRUE)
a<-table.row.end(a)
a<-table.row.start(a)
a<-table.element(a,'t',header=TRUE)
a<-table.element(a,'Forecast',header=TRUE)
a<-table.element(a,'95% Lower Bound',header=TRUE)
a<-table.element(a,'95% Upper Bound',header=TRUE)
a<-table.row.end(a)
for (i in 1:np) {
a<-table.row.start(a)
a<-table.element(a,nx+i,header=TRUE)
a<-table.element(a,p[i,'fit'])
a<-table.element(a,p[i,'lwr'])
a<-table.element(a,p[i,'upr'])
a<-table.row.end(a)
}
a<-table.end(a)
table.save(a,file='mytable2.tab')