Free Statistics

of Irreproducible Research!

Author's title

Author*The author of this computation has been verified*
R Software Modulerwasp_structuraltimeseries.wasp
Title produced by softwareStructural Time Series Models
Date of computationMon, 19 Dec 2016 22:04:17 +0100
Cite this page as followsStatistical Computations at FreeStatistics.org, Office for Research Development and Education, URL https://freestatistics.org/blog/index.php?v=date/2016/Dec/19/t1482181492omhhooh4ownz0bi.htm/, Retrieved Tue, 21 May 2024 08:45:04 +0000
Statistical Computations at FreeStatistics.org, Office for Research Development and Education, URL https://freestatistics.org/blog/index.php?pk=301507, Retrieved Tue, 21 May 2024 08:45:04 +0000
QR Codes:

Original text written by user:
IsPrivate?No (this computation is public)
User-defined keywords
Estimated Impact48
Family? (F = Feedback message, R = changed R code, M = changed R Module, P = changed Parameters, D = changed Data)
-       [Structural Time Series Models] [] [2016-12-19 21:04:17] [9412b5b3b31fe4708efb1e5c8c74b28f] [Current]
Feedback Forum

Post a new message
Dataseries X:
588.55
930.75
3228.65
2268.55
2414.5
3305.25
4342.05
3198.75
3091.35
3993.05
5331.5
3814.65
3707.6
4513.6
5634.2
4344.4
4060
4530.35
5348.75
4504.9
4281.35
4423.45
5197.9
4883.9
4155.25
4415.75
5384.05
5153.8
4564.1
5545
7585.4
6252.2
5785.65
6664.95
8639.85
6841.35


Summary of computational transaction
Raw Input view raw input (R code)
Raw Outputview raw output of R engine
Computing time3 seconds
R ServerBig Analytics Cloud Computing Center

\begin{tabular}{lllllllll}
\hline
Summary of computational transaction \tabularnewline
Raw Input view raw input (R code)  \tabularnewline
Raw Outputview raw output of R engine  \tabularnewline
Computing time3 seconds \tabularnewline
R ServerBig Analytics Cloud Computing Center \tabularnewline
\hline
\end{tabular}
%Source: https://freestatistics.org/blog/index.php?pk=301507&T=0

[TABLE]
[ROW]
Summary of computational transaction[/C][/ROW] [ROW]Raw Input[/C] view raw input (R code) [/C][/ROW] [ROW]Raw Output[/C]view raw output of R engine [/C][/ROW] [ROW]Computing time[/C]3 seconds[/C][/ROW] [ROW]R Server[/C]Big Analytics Cloud Computing Center[/C][/ROW] [/TABLE] Source: https://freestatistics.org/blog/index.php?pk=301507&T=0

Globally Unique Identifier (entire table): ba.freestatistics.org/blog/index.php?pk=301507&T=0

As an alternative you can also use a QR Code:  

The GUIDs for individual cells are displayed in the table below:

Summary of computational transaction
Raw Input view raw input (R code)
Raw Outputview raw output of R engine
Computing time3 seconds
R ServerBig Analytics Cloud Computing Center


Structural Time Series Model -- Interpolation
tObservedLevelSlopeSeasonalStand. Residuals
1588.55588.55000
2930.75811.7144237451449.65753361859194105.0237759118630.459111113891521
33228.652200.0249445899988.2534035004062945.6168563233542.99546452210615
42268.552417.1642218976193.2621082169833-158.8627676778910.339086846790987
52414.52438.5132306637491.6699692970794-17.7789886974303-0.198896375023917
63305.252857.9554002314196.3503409402341418.3963924733050.91297276002904
74342.053664.01887021079104.874473931417615.3194105024081.97705130342526
83198.753568.18987012579102.492182060148-351.717687555421-0.558677895898195
93091.353290.1607166243197.8778061760174-165.241088308213-1.05859418874028
103993.053568.57493437478100.08964203858408.5554662306740.502112809109019
115331.54486.73570548889110.080237568553772.6338811472.27511489990488
123814.654307.82193227476106.586853419457-467.689133685546-0.803729725206499
133707.64404.46906993515106.905578170219-695.96927442925-0.0302141264009927
144513.64857.42700277627107.151619642416-373.1354187633180.963793225262337
155634.24911.46116871327105.98280421455726.707762903655-0.13566427184653
164344.44760.2119554573799.5727528514992-396.214041645093-0.675521607963488
1740604560.0487819491493.656045478102-476.029239020088-0.8176069652011
184530.354488.5368094177991.343597778395255.3883565201171-0.457697054499068
195348.754549.4552374215991.0240076626261801.816259560452-0.0846580383745712
204504.94660.0808628346291.2027128099905-156.8086827886720.054578339808678
214281.354694.7336997856990.7041429438377-408.686812678137-0.157439722754683
224423.454579.9050454884388.9758398449937-139.383912439709-0.572024595338737
235197.94461.4342191845687.6295836100672753.707685359703-0.576899019065127
244883.94907.59740036888.2354779969368-53.5899900782170.998706198428464
254155.255041.0135076191287.9990327064342-889.5810760362580.127910348344397
264415.754926.1775605254287.5847168225287-493.654896856147-0.562159868858582
275384.054716.6660593698584.0161559973618690.805992143317-0.794755267777863
285153.85031.6769771396887.8431459337716104.1069827075170.617204226372501
294564.15078.1000913348387.1797892338452-510.707181595324-0.112680220018662
3055455306.9863108347189.0589510804375226.5304011160820.391037514196985
317585.46063.409917314296.11813917259131467.349144207561.85372594625777
326252.26347.8160713895997.7657368833855-111.0988048021720.524172376075536
335785.656304.6275790679196.7078623020821-507.369109226715-0.392534946700923
346664.956555.6987070157997.654990927270596.53235996923770.429607170241366
358639.857344.65386834628100.4604092766931238.20753268571.92261793373863
366841.357292.59636000647100.230389017514-438.649526632318-0.424706479447666

\begin{tabular}{lllllllll}
\hline
Structural Time Series Model -- Interpolation \tabularnewline
t & Observed & Level & Slope & Seasonal & Stand. Residuals \tabularnewline
1 & 588.55 & 588.55 & 0 & 0 & 0 \tabularnewline
2 & 930.75 & 811.714423745144 & 9.65753361859194 & 105.023775911863 & 0.459111113891521 \tabularnewline
3 & 3228.65 & 2200.02494458999 & 88.2534035004062 & 945.616856323354 & 2.99546452210615 \tabularnewline
4 & 2268.55 & 2417.16422189761 & 93.2621082169833 & -158.862767677891 & 0.339086846790987 \tabularnewline
5 & 2414.5 & 2438.51323066374 & 91.6699692970794 & -17.7789886974303 & -0.198896375023917 \tabularnewline
6 & 3305.25 & 2857.95540023141 & 96.3503409402341 & 418.396392473305 & 0.91297276002904 \tabularnewline
7 & 4342.05 & 3664.01887021079 & 104.874473931417 & 615.319410502408 & 1.97705130342526 \tabularnewline
8 & 3198.75 & 3568.18987012579 & 102.492182060148 & -351.717687555421 & -0.558677895898195 \tabularnewline
9 & 3091.35 & 3290.16071662431 & 97.8778061760174 & -165.241088308213 & -1.05859418874028 \tabularnewline
10 & 3993.05 & 3568.57493437478 & 100.08964203858 & 408.555466230674 & 0.502112809109019 \tabularnewline
11 & 5331.5 & 4486.73570548889 & 110.080237568553 & 772.633881147 & 2.27511489990488 \tabularnewline
12 & 3814.65 & 4307.82193227476 & 106.586853419457 & -467.689133685546 & -0.803729725206499 \tabularnewline
13 & 3707.6 & 4404.46906993515 & 106.905578170219 & -695.96927442925 & -0.0302141264009927 \tabularnewline
14 & 4513.6 & 4857.42700277627 & 107.151619642416 & -373.135418763318 & 0.963793225262337 \tabularnewline
15 & 5634.2 & 4911.46116871327 & 105.98280421455 & 726.707762903655 & -0.13566427184653 \tabularnewline
16 & 4344.4 & 4760.21195545737 & 99.5727528514992 & -396.214041645093 & -0.675521607963488 \tabularnewline
17 & 4060 & 4560.04878194914 & 93.656045478102 & -476.029239020088 & -0.8176069652011 \tabularnewline
18 & 4530.35 & 4488.53680941779 & 91.3435977783952 & 55.3883565201171 & -0.457697054499068 \tabularnewline
19 & 5348.75 & 4549.45523742159 & 91.0240076626261 & 801.816259560452 & -0.0846580383745712 \tabularnewline
20 & 4504.9 & 4660.08086283462 & 91.2027128099905 & -156.808682788672 & 0.054578339808678 \tabularnewline
21 & 4281.35 & 4694.73369978569 & 90.7041429438377 & -408.686812678137 & -0.157439722754683 \tabularnewline
22 & 4423.45 & 4579.90504548843 & 88.9758398449937 & -139.383912439709 & -0.572024595338737 \tabularnewline
23 & 5197.9 & 4461.43421918456 & 87.6295836100672 & 753.707685359703 & -0.576899019065127 \tabularnewline
24 & 4883.9 & 4907.597400368 & 88.2354779969368 & -53.589990078217 & 0.998706198428464 \tabularnewline
25 & 4155.25 & 5041.01350761912 & 87.9990327064342 & -889.581076036258 & 0.127910348344397 \tabularnewline
26 & 4415.75 & 4926.17756052542 & 87.5847168225287 & -493.654896856147 & -0.562159868858582 \tabularnewline
27 & 5384.05 & 4716.66605936985 & 84.0161559973618 & 690.805992143317 & -0.794755267777863 \tabularnewline
28 & 5153.8 & 5031.67697713968 & 87.8431459337716 & 104.106982707517 & 0.617204226372501 \tabularnewline
29 & 4564.1 & 5078.10009133483 & 87.1797892338452 & -510.707181595324 & -0.112680220018662 \tabularnewline
30 & 5545 & 5306.98631083471 & 89.0589510804375 & 226.530401116082 & 0.391037514196985 \tabularnewline
31 & 7585.4 & 6063.4099173142 & 96.1181391725913 & 1467.34914420756 & 1.85372594625777 \tabularnewline
32 & 6252.2 & 6347.81607138959 & 97.7657368833855 & -111.098804802172 & 0.524172376075536 \tabularnewline
33 & 5785.65 & 6304.62757906791 & 96.7078623020821 & -507.369109226715 & -0.392534946700923 \tabularnewline
34 & 6664.95 & 6555.69870701579 & 97.6549909272705 & 96.5323599692377 & 0.429607170241366 \tabularnewline
35 & 8639.85 & 7344.65386834628 & 100.460409276693 & 1238.2075326857 & 1.92261793373863 \tabularnewline
36 & 6841.35 & 7292.59636000647 & 100.230389017514 & -438.649526632318 & -0.424706479447666 \tabularnewline
\hline
\end{tabular}
%Source: https://freestatistics.org/blog/index.php?pk=301507&T=1

[TABLE]
[ROW][C]Structural Time Series Model -- Interpolation[/C][/ROW]
[ROW][C]t[/C][C]Observed[/C][C]Level[/C][C]Slope[/C][C]Seasonal[/C][C]Stand. Residuals[/C][/ROW]
[ROW][C]1[/C][C]588.55[/C][C]588.55[/C][C]0[/C][C]0[/C][C]0[/C][/ROW]
[ROW][C]2[/C][C]930.75[/C][C]811.714423745144[/C][C]9.65753361859194[/C][C]105.023775911863[/C][C]0.459111113891521[/C][/ROW]
[ROW][C]3[/C][C]3228.65[/C][C]2200.02494458999[/C][C]88.2534035004062[/C][C]945.616856323354[/C][C]2.99546452210615[/C][/ROW]
[ROW][C]4[/C][C]2268.55[/C][C]2417.16422189761[/C][C]93.2621082169833[/C][C]-158.862767677891[/C][C]0.339086846790987[/C][/ROW]
[ROW][C]5[/C][C]2414.5[/C][C]2438.51323066374[/C][C]91.6699692970794[/C][C]-17.7789886974303[/C][C]-0.198896375023917[/C][/ROW]
[ROW][C]6[/C][C]3305.25[/C][C]2857.95540023141[/C][C]96.3503409402341[/C][C]418.396392473305[/C][C]0.91297276002904[/C][/ROW]
[ROW][C]7[/C][C]4342.05[/C][C]3664.01887021079[/C][C]104.874473931417[/C][C]615.319410502408[/C][C]1.97705130342526[/C][/ROW]
[ROW][C]8[/C][C]3198.75[/C][C]3568.18987012579[/C][C]102.492182060148[/C][C]-351.717687555421[/C][C]-0.558677895898195[/C][/ROW]
[ROW][C]9[/C][C]3091.35[/C][C]3290.16071662431[/C][C]97.8778061760174[/C][C]-165.241088308213[/C][C]-1.05859418874028[/C][/ROW]
[ROW][C]10[/C][C]3993.05[/C][C]3568.57493437478[/C][C]100.08964203858[/C][C]408.555466230674[/C][C]0.502112809109019[/C][/ROW]
[ROW][C]11[/C][C]5331.5[/C][C]4486.73570548889[/C][C]110.080237568553[/C][C]772.633881147[/C][C]2.27511489990488[/C][/ROW]
[ROW][C]12[/C][C]3814.65[/C][C]4307.82193227476[/C][C]106.586853419457[/C][C]-467.689133685546[/C][C]-0.803729725206499[/C][/ROW]
[ROW][C]13[/C][C]3707.6[/C][C]4404.46906993515[/C][C]106.905578170219[/C][C]-695.96927442925[/C][C]-0.0302141264009927[/C][/ROW]
[ROW][C]14[/C][C]4513.6[/C][C]4857.42700277627[/C][C]107.151619642416[/C][C]-373.135418763318[/C][C]0.963793225262337[/C][/ROW]
[ROW][C]15[/C][C]5634.2[/C][C]4911.46116871327[/C][C]105.98280421455[/C][C]726.707762903655[/C][C]-0.13566427184653[/C][/ROW]
[ROW][C]16[/C][C]4344.4[/C][C]4760.21195545737[/C][C]99.5727528514992[/C][C]-396.214041645093[/C][C]-0.675521607963488[/C][/ROW]
[ROW][C]17[/C][C]4060[/C][C]4560.04878194914[/C][C]93.656045478102[/C][C]-476.029239020088[/C][C]-0.8176069652011[/C][/ROW]
[ROW][C]18[/C][C]4530.35[/C][C]4488.53680941779[/C][C]91.3435977783952[/C][C]55.3883565201171[/C][C]-0.457697054499068[/C][/ROW]
[ROW][C]19[/C][C]5348.75[/C][C]4549.45523742159[/C][C]91.0240076626261[/C][C]801.816259560452[/C][C]-0.0846580383745712[/C][/ROW]
[ROW][C]20[/C][C]4504.9[/C][C]4660.08086283462[/C][C]91.2027128099905[/C][C]-156.808682788672[/C][C]0.054578339808678[/C][/ROW]
[ROW][C]21[/C][C]4281.35[/C][C]4694.73369978569[/C][C]90.7041429438377[/C][C]-408.686812678137[/C][C]-0.157439722754683[/C][/ROW]
[ROW][C]22[/C][C]4423.45[/C][C]4579.90504548843[/C][C]88.9758398449937[/C][C]-139.383912439709[/C][C]-0.572024595338737[/C][/ROW]
[ROW][C]23[/C][C]5197.9[/C][C]4461.43421918456[/C][C]87.6295836100672[/C][C]753.707685359703[/C][C]-0.576899019065127[/C][/ROW]
[ROW][C]24[/C][C]4883.9[/C][C]4907.597400368[/C][C]88.2354779969368[/C][C]-53.589990078217[/C][C]0.998706198428464[/C][/ROW]
[ROW][C]25[/C][C]4155.25[/C][C]5041.01350761912[/C][C]87.9990327064342[/C][C]-889.581076036258[/C][C]0.127910348344397[/C][/ROW]
[ROW][C]26[/C][C]4415.75[/C][C]4926.17756052542[/C][C]87.5847168225287[/C][C]-493.654896856147[/C][C]-0.562159868858582[/C][/ROW]
[ROW][C]27[/C][C]5384.05[/C][C]4716.66605936985[/C][C]84.0161559973618[/C][C]690.805992143317[/C][C]-0.794755267777863[/C][/ROW]
[ROW][C]28[/C][C]5153.8[/C][C]5031.67697713968[/C][C]87.8431459337716[/C][C]104.106982707517[/C][C]0.617204226372501[/C][/ROW]
[ROW][C]29[/C][C]4564.1[/C][C]5078.10009133483[/C][C]87.1797892338452[/C][C]-510.707181595324[/C][C]-0.112680220018662[/C][/ROW]
[ROW][C]30[/C][C]5545[/C][C]5306.98631083471[/C][C]89.0589510804375[/C][C]226.530401116082[/C][C]0.391037514196985[/C][/ROW]
[ROW][C]31[/C][C]7585.4[/C][C]6063.4099173142[/C][C]96.1181391725913[/C][C]1467.34914420756[/C][C]1.85372594625777[/C][/ROW]
[ROW][C]32[/C][C]6252.2[/C][C]6347.81607138959[/C][C]97.7657368833855[/C][C]-111.098804802172[/C][C]0.524172376075536[/C][/ROW]
[ROW][C]33[/C][C]5785.65[/C][C]6304.62757906791[/C][C]96.7078623020821[/C][C]-507.369109226715[/C][C]-0.392534946700923[/C][/ROW]
[ROW][C]34[/C][C]6664.95[/C][C]6555.69870701579[/C][C]97.6549909272705[/C][C]96.5323599692377[/C][C]0.429607170241366[/C][/ROW]
[ROW][C]35[/C][C]8639.85[/C][C]7344.65386834628[/C][C]100.460409276693[/C][C]1238.2075326857[/C][C]1.92261793373863[/C][/ROW]
[ROW][C]36[/C][C]6841.35[/C][C]7292.59636000647[/C][C]100.230389017514[/C][C]-438.649526632318[/C][C]-0.424706479447666[/C][/ROW]
[/TABLE]
Source: https://freestatistics.org/blog/index.php?pk=301507&T=1

Globally Unique Identifier (entire table): ba.freestatistics.org/blog/index.php?pk=301507&T=1

As an alternative you can also use a QR Code:  

The GUIDs for individual cells are displayed in the table below:

Structural Time Series Model -- Interpolation
tObservedLevelSlopeSeasonalStand. Residuals
1588.55588.55000
2930.75811.7144237451449.65753361859194105.0237759118630.459111113891521
33228.652200.0249445899988.2534035004062945.6168563233542.99546452210615
42268.552417.1642218976193.2621082169833-158.8627676778910.339086846790987
52414.52438.5132306637491.6699692970794-17.7789886974303-0.198896375023917
63305.252857.9554002314196.3503409402341418.3963924733050.91297276002904
74342.053664.01887021079104.874473931417615.3194105024081.97705130342526
83198.753568.18987012579102.492182060148-351.717687555421-0.558677895898195
93091.353290.1607166243197.8778061760174-165.241088308213-1.05859418874028
103993.053568.57493437478100.08964203858408.5554662306740.502112809109019
115331.54486.73570548889110.080237568553772.6338811472.27511489990488
123814.654307.82193227476106.586853419457-467.689133685546-0.803729725206499
133707.64404.46906993515106.905578170219-695.96927442925-0.0302141264009927
144513.64857.42700277627107.151619642416-373.1354187633180.963793225262337
155634.24911.46116871327105.98280421455726.707762903655-0.13566427184653
164344.44760.2119554573799.5727528514992-396.214041645093-0.675521607963488
1740604560.0487819491493.656045478102-476.029239020088-0.8176069652011
184530.354488.5368094177991.343597778395255.3883565201171-0.457697054499068
195348.754549.4552374215991.0240076626261801.816259560452-0.0846580383745712
204504.94660.0808628346291.2027128099905-156.8086827886720.054578339808678
214281.354694.7336997856990.7041429438377-408.686812678137-0.157439722754683
224423.454579.9050454884388.9758398449937-139.383912439709-0.572024595338737
235197.94461.4342191845687.6295836100672753.707685359703-0.576899019065127
244883.94907.59740036888.2354779969368-53.5899900782170.998706198428464
254155.255041.0135076191287.9990327064342-889.5810760362580.127910348344397
264415.754926.1775605254287.5847168225287-493.654896856147-0.562159868858582
275384.054716.6660593698584.0161559973618690.805992143317-0.794755267777863
285153.85031.6769771396887.8431459337716104.1069827075170.617204226372501
294564.15078.1000913348387.1797892338452-510.707181595324-0.112680220018662
3055455306.9863108347189.0589510804375226.5304011160820.391037514196985
317585.46063.409917314296.11813917259131467.349144207561.85372594625777
326252.26347.8160713895997.7657368833855-111.0988048021720.524172376075536
335785.656304.6275790679196.7078623020821-507.369109226715-0.392534946700923
346664.956555.6987070157997.654990927270596.53235996923770.429607170241366
358639.857344.65386834628100.4604092766931238.20753268571.92261793373863
366841.357292.59636000647100.230389017514-438.649526632318-0.424706479447666


Structural Time Series Model -- Extrapolation
tObservedLevelSeasonal
16673.40451177957361.95525686883-688.550745089333
27085.723573720437520.91510211154-435.191528391115
38162.870364493617679.87494735426482.99541713935
47817.249651787897838.83479259697-21.5851408090838
57208.270090231387997.79463783968-789.524547608306
68006.942628648168156.75448308239-149.811854434234
79759.70164367488315.714328325111443.98731534969
88406.404157384678474.67417356782-68.27001618315
97929.641056346578633.63401881053-703.992962463964
108626.244120839848792.59386405324-166.349743213405
1110395.57942032858951.553709295961444.02571103256
128762.781649209669110.51355453867-347.73190532901

\begin{tabular}{lllllllll}
\hline
Structural Time Series Model -- Extrapolation \tabularnewline
t & Observed & Level & Seasonal \tabularnewline
1 & 6673.4045117795 & 7361.95525686883 & -688.550745089333 \tabularnewline
2 & 7085.72357372043 & 7520.91510211154 & -435.191528391115 \tabularnewline
3 & 8162.87036449361 & 7679.87494735426 & 482.99541713935 \tabularnewline
4 & 7817.24965178789 & 7838.83479259697 & -21.5851408090838 \tabularnewline
5 & 7208.27009023138 & 7997.79463783968 & -789.524547608306 \tabularnewline
6 & 8006.94262864816 & 8156.75448308239 & -149.811854434234 \tabularnewline
7 & 9759.7016436748 & 8315.71432832511 & 1443.98731534969 \tabularnewline
8 & 8406.40415738467 & 8474.67417356782 & -68.27001618315 \tabularnewline
9 & 7929.64105634657 & 8633.63401881053 & -703.992962463964 \tabularnewline
10 & 8626.24412083984 & 8792.59386405324 & -166.349743213405 \tabularnewline
11 & 10395.5794203285 & 8951.55370929596 & 1444.02571103256 \tabularnewline
12 & 8762.78164920966 & 9110.51355453867 & -347.73190532901 \tabularnewline
\hline
\end{tabular}
%Source: https://freestatistics.org/blog/index.php?pk=301507&T=2

[TABLE]
[ROW][C]Structural Time Series Model -- Extrapolation[/C][/ROW]
[ROW][C]t[/C][C]Observed[/C][C]Level[/C][C]Seasonal[/C][/ROW]
[ROW][C]1[/C][C]6673.4045117795[/C][C]7361.95525686883[/C][C]-688.550745089333[/C][/ROW]
[ROW][C]2[/C][C]7085.72357372043[/C][C]7520.91510211154[/C][C]-435.191528391115[/C][/ROW]
[ROW][C]3[/C][C]8162.87036449361[/C][C]7679.87494735426[/C][C]482.99541713935[/C][/ROW]
[ROW][C]4[/C][C]7817.24965178789[/C][C]7838.83479259697[/C][C]-21.5851408090838[/C][/ROW]
[ROW][C]5[/C][C]7208.27009023138[/C][C]7997.79463783968[/C][C]-789.524547608306[/C][/ROW]
[ROW][C]6[/C][C]8006.94262864816[/C][C]8156.75448308239[/C][C]-149.811854434234[/C][/ROW]
[ROW][C]7[/C][C]9759.7016436748[/C][C]8315.71432832511[/C][C]1443.98731534969[/C][/ROW]
[ROW][C]8[/C][C]8406.40415738467[/C][C]8474.67417356782[/C][C]-68.27001618315[/C][/ROW]
[ROW][C]9[/C][C]7929.64105634657[/C][C]8633.63401881053[/C][C]-703.992962463964[/C][/ROW]
[ROW][C]10[/C][C]8626.24412083984[/C][C]8792.59386405324[/C][C]-166.349743213405[/C][/ROW]
[ROW][C]11[/C][C]10395.5794203285[/C][C]8951.55370929596[/C][C]1444.02571103256[/C][/ROW]
[ROW][C]12[/C][C]8762.78164920966[/C][C]9110.51355453867[/C][C]-347.73190532901[/C][/ROW]
[/TABLE]
Source: https://freestatistics.org/blog/index.php?pk=301507&T=2

Globally Unique Identifier (entire table): ba.freestatistics.org/blog/index.php?pk=301507&T=2

As an alternative you can also use a QR Code:  

The GUIDs for individual cells are displayed in the table below:

Structural Time Series Model -- Extrapolation
tObservedLevelSeasonal
16673.40451177957361.95525686883-688.550745089333
27085.723573720437520.91510211154-435.191528391115
38162.870364493617679.87494735426482.99541713935
47817.249651787897838.83479259697-21.5851408090838
57208.270090231387997.79463783968-789.524547608306
68006.942628648168156.75448308239-149.811854434234
79759.70164367488315.714328325111443.98731534969
88406.404157384678474.67417356782-68.27001618315
97929.641056346578633.63401881053-703.992962463964
108626.244120839848792.59386405324-166.349743213405
1110395.57942032858951.553709295961444.02571103256
128762.781649209669110.51355453867-347.73190532901


Parameters (Session):
par1 = 12 ; par2 = 12 ; par3 = BFGS ;
Parameters (R input):
par1 = 12 ; par2 = 12 ; par3 = BFGS ;
R code (references can be found in the software module):
require('stsm')
require('stsm.class')
require('KFKSDS')
par1 <- as.numeric(par1)
par2 <- as.numeric(par2)
nx <- length(x)
x <- ts(x,frequency=par1)
m <- StructTS(x,type='BSM')
print(m$coef)
print(m$fitted)
print(m$resid)
mylevel <- as.numeric(m$fitted[,'level'])
myslope <- as.numeric(m$fitted[,'slope'])
myseas <- as.numeric(m$fitted[,'sea'])
myresid <- as.numeric(m$resid)
myfit <- mylevel+myseas
mm <- stsm.model(model = 'BSM', y = x, transPars = 'StructTS')
fit2 <- stsmFit(mm, stsm.method = 'maxlik.td.optim', method = par3, KF.args = list(P0cov = TRUE))
(fit2.comps <- tsSmooth(fit2, P0cov = FALSE)$states)
m2 <- set.pars(mm, pmax(fit2$par, .Machine$double.eps))
(ss <- char2numeric(m2))
(pred <- predict(ss, x, n.ahead = par2))
mylagmax <- nx/2
bitmap(file='test2.png')
op <- par(mfrow = c(2,2))
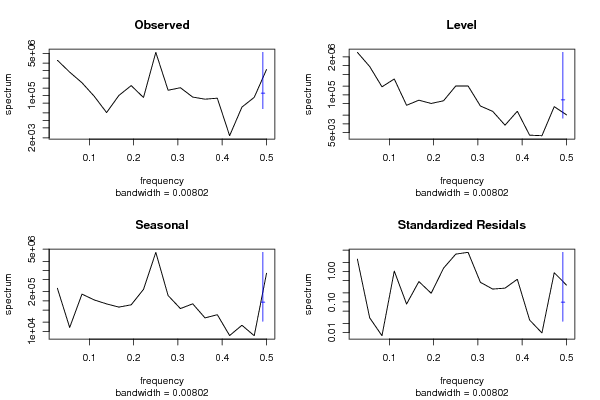
acf(as.numeric(x),lag.max = mylagmax,main='Observed')
acf(mylevel,na.action=na.pass,lag.max = mylagmax,main='Level')
acf(myseas,na.action=na.pass,lag.max = mylagmax,main='Seasonal')
acf(myresid,na.action=na.pass,lag.max = mylagmax,main='Standardized Residals')
par(op)
dev.off()
bitmap(file='test3.png')
op <- par(mfrow = c(2,2))
spectrum(as.numeric(x),main='Observed')
spectrum(mylevel,main='Level')
spectrum(myseas,main='Seasonal')
spectrum(myresid,main='Standardized Residals')
par(op)
dev.off()
bitmap(file='test4.png')
op <- par(mfrow = c(2,2))
cpgram(as.numeric(x),main='Observed')
cpgram(mylevel,main='Level')
cpgram(myseas,main='Seasonal')
cpgram(myresid,main='Standardized Residals')
par(op)
dev.off()
bitmap(file='test1.png')
plot(as.numeric(m$resid),main='Standardized Residuals',ylab='Residuals',xlab='time',type='b')
grid()
dev.off()
bitmap(file='test5.png')
op <- par(mfrow = c(2,2))
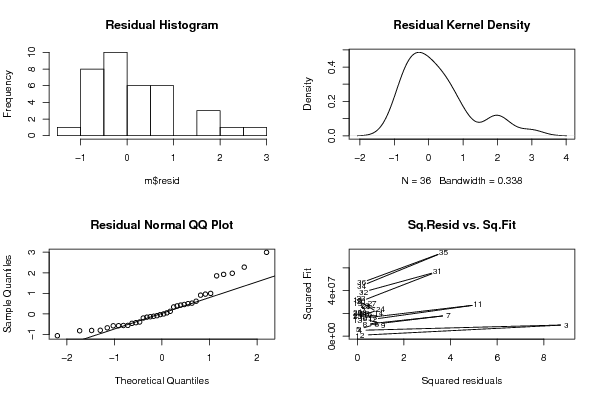
hist(m$resid,main='Residual Histogram')
plot(density(m$resid),main='Residual Kernel Density')
qqnorm(m$resid,main='Residual Normal QQ Plot')
qqline(m$resid)
plot(m$resid^2, myfit^2,main='Sq.Resid vs. Sq.Fit',xlab='Squared residuals',ylab='Squared Fit')
par(op)
dev.off()
bitmap(file='test6.png')
par(mfrow = c(3,1), mar = c(3,3,3,3))
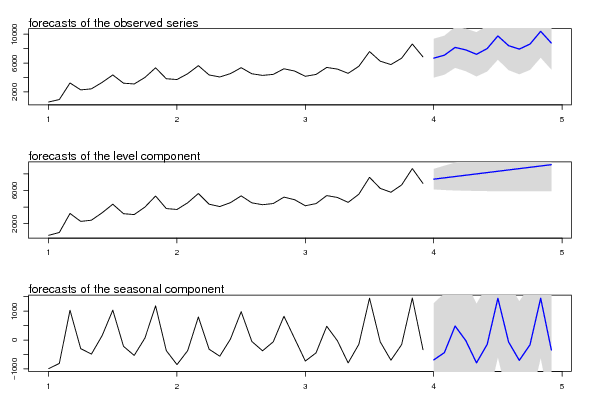
plot(cbind(x, pred$pred), type = 'n', plot.type = 'single', ylab = '')
lines(x)
polygon(c(time(pred$pred), rev(time(pred$pred))), c(pred$pred + 2 * pred$se, rev(pred$pred)), col = 'gray85', border = NA)
polygon(c(time(pred$pred), rev(time(pred$pred))), c(pred$pred - 2 * pred$se, rev(pred$pred)), col = ' gray85', border = NA)
lines(pred$pred, col = 'blue', lwd = 1.5)
mtext(text = 'forecasts of the observed series', side = 3, adj = 0)
plot(cbind(x, pred$a[,1]), type = 'n', plot.type = 'single', ylab = '')
lines(x)
polygon(c(time(pred$a[,1]), rev(time(pred$a[,1]))), c(pred$a[,1] + 2 * sqrt(pred$P[,1]), rev(pred$a[,1])), col = 'gray85', border = NA)
polygon(c(time(pred$a[,1]), rev(time(pred$a[,1]))), c(pred$a[,1] - 2 * sqrt(pred$P[,1]), rev(pred$a[,1])), col = ' gray85', border = NA)
lines(pred$a[,1], col = 'blue', lwd = 1.5)
mtext(text = 'forecasts of the level component', side = 3, adj = 0)
plot(cbind(fit2.comps[,3], pred$a[,3]), type = 'n', plot.type = 'single', ylab = '')
lines(fit2.comps[,3])
polygon(c(time(pred$a[,3]), rev(time(pred$a[,3]))), c(pred$a[,3] + 2 * sqrt(pred$P[,3]), rev(pred$a[,3])), col = 'gray85', border = NA)
polygon(c(time(pred$a[,3]), rev(time(pred$a[,3]))), c(pred$a[,3] - 2 * sqrt(pred$P[,3]), rev(pred$a[,3])), col = ' gray85', border = NA)
lines(pred$a[,3], col = 'blue', lwd = 1.5)
mtext(text = 'forecasts of the seasonal component', side = 3, adj = 0)
dev.off()
load(file='createtable')
a<-table.start()
a<-table.row.start(a)
a<-table.element(a,'Structural Time Series Model -- Interpolation',6,TRUE)
a<-table.row.end(a)
a<-table.row.start(a)
a<-table.element(a,'t',header=TRUE)
a<-table.element(a,'Observed',header=TRUE)
a<-table.element(a,'Level',header=TRUE)
a<-table.element(a,'Slope',header=TRUE)
a<-table.element(a,'Seasonal',header=TRUE)
a<-table.element(a,'Stand. Residuals',header=TRUE)
a<-table.row.end(a)
for (i in 1:nx) {
a<-table.row.start(a)
a<-table.element(a,i,header=TRUE)
a<-table.element(a,x[i])
a<-table.element(a,mylevel[i])
a<-table.element(a,myslope[i])
a<-table.element(a,myseas[i])
a<-table.element(a,myresid[i])
a<-table.row.end(a)
}
a<-table.end(a)
table.save(a,file='mytable.tab')
a<-table.start()
a<-table.row.start(a)
a<-table.element(a,'Structural Time Series Model -- Extrapolation',4,TRUE)
a<-table.row.end(a)
a<-table.row.start(a)
a<-table.element(a,'t',header=TRUE)
a<-table.element(a,'Observed',header=TRUE)
a<-table.element(a,'Level',header=TRUE)
a<-table.element(a,'Seasonal',header=TRUE)
a<-table.row.end(a)
for (i in 1:par2) {
a<-table.row.start(a)
a<-table.element(a,i,header=TRUE)
a<-table.element(a,pred$pred[i])
a<-table.element(a,pred$a[i,1])
a<-table.element(a,pred$a[i,3])
a<-table.row.end(a)
}
a<-table.end(a)
table.save(a,file='mytable1.tab')