Free Statistics

of Irreproducible Research!

Author's title

Author*The author of this computation has been verified*
R Software Modulerwasp_autocorrelation.wasp
Title produced by software(Partial) Autocorrelation Function
Date of computationMon, 19 Dec 2016 21:56:54 +0100
Cite this page as followsStatistical Computations at FreeStatistics.org, Office for Research Development and Education, URL https://freestatistics.org/blog/index.php?v=date/2016/Dec/19/t1482181102mt2iqt0ayf9pozp.htm/, Retrieved Fri, 17 May 2024 17:58:33 +0000
Statistical Computations at FreeStatistics.org, Office for Research Development and Education, URL https://freestatistics.org/blog/index.php?pk=301502, Retrieved Fri, 17 May 2024 17:58:33 +0000
QR Codes:

Original text written by user:
IsPrivate?No (this computation is public)
User-defined keywords
Estimated Impact75
Family? (F = Feedback message, R = changed R code, M = changed R Module, P = changed Parameters, D = changed Data)
-       [(Partial) Autocorrelation Function] [Autocorrelation n...] [2016-12-19 20:56:54] [9b0b4f5f4290a2ed9efd388f9ce31ae7] [Current]
Feedback Forum

Post a new message
Dataseries X:
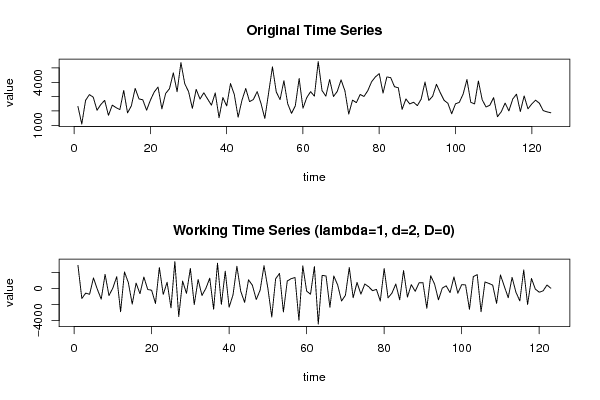
2312
1089
2742
3145
2966
2055
2450
2742
1697
2409
2233
2100
3434
1867
2365
3578
2845
2778
2056
2757
3325
3671
2147
3225
3556
4661
3344
5375
3907
3356
2184
3510
2834
3271
2834
2408
3261
1526
2938
2352
3915
3145
1566
2746
3572
2651
2805
3354
2523
1480
3278
5081
3332
2789
4111
2508
1833
2371
4268
2194
2935
3347
3034
5448
3427
3036
4196
3009
3369
4168
3403
1779
2761
2582
3153
3011
3419
4042
4379
4602
3249
4372
4328
3695
3614
2114
2839
2490
2610
2372
2833
4018
2734
3027
3862
3281
2746
2538
1805
2500
2601
3178
4193
2606
2491
4090
2786
2280
2403
2934
1601
1946
2554
2006
2830
3173
1960
3052
2151
2493
2752
2542
2027
1940
1877


Summary of computational transaction
Raw Input view raw input (R code)
Raw Outputview raw output of R engine
Computing time2 seconds
R ServerBig Analytics Cloud Computing Center

\begin{tabular}{lllllllll}
\hline
Summary of computational transaction \tabularnewline
Raw Input view raw input (R code)  \tabularnewline
Raw Outputview raw output of R engine  \tabularnewline
Computing time2 seconds \tabularnewline
R ServerBig Analytics Cloud Computing Center \tabularnewline
\hline
\end{tabular}
%Source: https://freestatistics.org/blog/index.php?pk=301502&T=0

[TABLE]
[ROW]
Summary of computational transaction[/C][/ROW] [ROW]Raw Input[/C] view raw input (R code) [/C][/ROW] [ROW]Raw Output[/C]view raw output of R engine [/C][/ROW] [ROW]Computing time[/C]2 seconds[/C][/ROW] [ROW]R Server[/C]Big Analytics Cloud Computing Center[/C][/ROW] [/TABLE] Source: https://freestatistics.org/blog/index.php?pk=301502&T=0

Globally Unique Identifier (entire table): ba.freestatistics.org/blog/index.php?pk=301502&T=0

As an alternative you can also use a QR Code:  

The GUIDs for individual cells are displayed in the table below:

Summary of computational transaction
Raw Input view raw input (R code)
Raw Outputview raw output of R engine
Computing time2 seconds
R ServerBig Analytics Cloud Computing Center


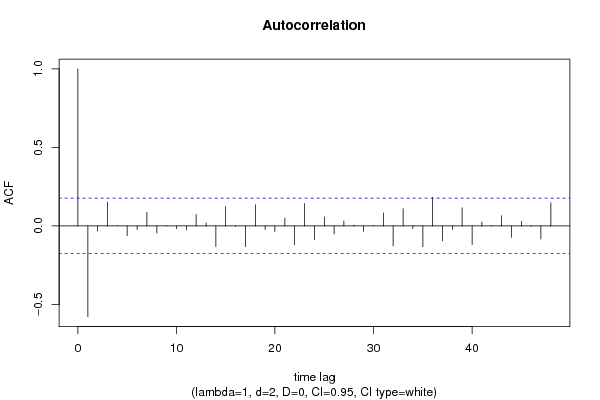
Autocorrelation Function
Time lag kACF(k)T-STATP-value
1-0.577532-6.40510
2-0.031249-0.34660.364755
30.1517911.68340.047413
4-4.9e-05-5e-040.499783
5-0.060567-0.67170.251512
6-0.023003-0.25510.399531
70.0866360.96080.169258
8-0.043923-0.48710.313519
90.0021110.02340.490679
10-0.017012-0.18870.425331
11-0.025517-0.2830.388827
120.0724350.80330.211662
130.0195550.21690.414334
14-0.130809-1.45070.074699
150.123011.36420.087491
16-0.004182-0.04640.481542
17-0.131559-1.45910.073549
180.1355251.5030.067695
19-0.022014-0.24410.403762
20-0.035424-0.39290.347548
210.0499670.55420.290236
22-0.119996-1.33080.092856
230.1434251.59070.057126
24-0.086847-0.96320.168675
250.0568450.63040.264789
26-0.051234-0.56820.285464
270.031170.34570.365081
280.0042860.04750.481083
29-0.035123-0.38950.348779
300.0010010.01110.495578
310.0823030.91280.181572
32-0.127668-1.41590.079664
330.1094031.21330.113664
34-0.016114-0.17870.429226
35-0.131801-1.46170.073182
360.1820422.01890.022834
37-0.094266-1.04550.14893
38-0.021796-0.24170.404698
390.1162331.28910.099893
40-0.118053-1.30930.096442
410.0252620.28020.38991
420.0022910.02540.489884
430.0646720.71720.23729
44-0.071769-0.7960.213794
450.0293390.32540.37272
46-0.002653-0.02940.488288
47-0.083576-0.92690.177897
480.1483451.64520.051238

\begin{tabular}{lllllllll}
\hline
Autocorrelation Function \tabularnewline
Time lag k & ACF(k) & T-STAT & P-value \tabularnewline
1 & -0.577532 & -6.4051 & 0 \tabularnewline
2 & -0.031249 & -0.3466 & 0.364755 \tabularnewline
3 & 0.151791 & 1.6834 & 0.047413 \tabularnewline
4 & -4.9e-05 & -5e-04 & 0.499783 \tabularnewline
5 & -0.060567 & -0.6717 & 0.251512 \tabularnewline
6 & -0.023003 & -0.2551 & 0.399531 \tabularnewline
7 & 0.086636 & 0.9608 & 0.169258 \tabularnewline
8 & -0.043923 & -0.4871 & 0.313519 \tabularnewline
9 & 0.002111 & 0.0234 & 0.490679 \tabularnewline
10 & -0.017012 & -0.1887 & 0.425331 \tabularnewline
11 & -0.025517 & -0.283 & 0.388827 \tabularnewline
12 & 0.072435 & 0.8033 & 0.211662 \tabularnewline
13 & 0.019555 & 0.2169 & 0.414334 \tabularnewline
14 & -0.130809 & -1.4507 & 0.074699 \tabularnewline
15 & 0.12301 & 1.3642 & 0.087491 \tabularnewline
16 & -0.004182 & -0.0464 & 0.481542 \tabularnewline
17 & -0.131559 & -1.4591 & 0.073549 \tabularnewline
18 & 0.135525 & 1.503 & 0.067695 \tabularnewline
19 & -0.022014 & -0.2441 & 0.403762 \tabularnewline
20 & -0.035424 & -0.3929 & 0.347548 \tabularnewline
21 & 0.049967 & 0.5542 & 0.290236 \tabularnewline
22 & -0.119996 & -1.3308 & 0.092856 \tabularnewline
23 & 0.143425 & 1.5907 & 0.057126 \tabularnewline
24 & -0.086847 & -0.9632 & 0.168675 \tabularnewline
25 & 0.056845 & 0.6304 & 0.264789 \tabularnewline
26 & -0.051234 & -0.5682 & 0.285464 \tabularnewline
27 & 0.03117 & 0.3457 & 0.365081 \tabularnewline
28 & 0.004286 & 0.0475 & 0.481083 \tabularnewline
29 & -0.035123 & -0.3895 & 0.348779 \tabularnewline
30 & 0.001001 & 0.0111 & 0.495578 \tabularnewline
31 & 0.082303 & 0.9128 & 0.181572 \tabularnewline
32 & -0.127668 & -1.4159 & 0.079664 \tabularnewline
33 & 0.109403 & 1.2133 & 0.113664 \tabularnewline
34 & -0.016114 & -0.1787 & 0.429226 \tabularnewline
35 & -0.131801 & -1.4617 & 0.073182 \tabularnewline
36 & 0.182042 & 2.0189 & 0.022834 \tabularnewline
37 & -0.094266 & -1.0455 & 0.14893 \tabularnewline
38 & -0.021796 & -0.2417 & 0.404698 \tabularnewline
39 & 0.116233 & 1.2891 & 0.099893 \tabularnewline
40 & -0.118053 & -1.3093 & 0.096442 \tabularnewline
41 & 0.025262 & 0.2802 & 0.38991 \tabularnewline
42 & 0.002291 & 0.0254 & 0.489884 \tabularnewline
43 & 0.064672 & 0.7172 & 0.23729 \tabularnewline
44 & -0.071769 & -0.796 & 0.213794 \tabularnewline
45 & 0.029339 & 0.3254 & 0.37272 \tabularnewline
46 & -0.002653 & -0.0294 & 0.488288 \tabularnewline
47 & -0.083576 & -0.9269 & 0.177897 \tabularnewline
48 & 0.148345 & 1.6452 & 0.051238 \tabularnewline
\hline
\end{tabular}
%Source: https://freestatistics.org/blog/index.php?pk=301502&T=1

[TABLE]
[ROW][C]Autocorrelation Function[/C][/ROW]
[ROW][C]Time lag k[/C][C]ACF(k)[/C][C]T-STAT[/C][C]P-value[/C][/ROW]
[ROW][C]1[/C][C]-0.577532[/C][C]-6.4051[/C][C]0[/C][/ROW]
[ROW][C]2[/C][C]-0.031249[/C][C]-0.3466[/C][C]0.364755[/C][/ROW]
[ROW][C]3[/C][C]0.151791[/C][C]1.6834[/C][C]0.047413[/C][/ROW]
[ROW][C]4[/C][C]-4.9e-05[/C][C]-5e-04[/C][C]0.499783[/C][/ROW]
[ROW][C]5[/C][C]-0.060567[/C][C]-0.6717[/C][C]0.251512[/C][/ROW]
[ROW][C]6[/C][C]-0.023003[/C][C]-0.2551[/C][C]0.399531[/C][/ROW]
[ROW][C]7[/C][C]0.086636[/C][C]0.9608[/C][C]0.169258[/C][/ROW]
[ROW][C]8[/C][C]-0.043923[/C][C]-0.4871[/C][C]0.313519[/C][/ROW]
[ROW][C]9[/C][C]0.002111[/C][C]0.0234[/C][C]0.490679[/C][/ROW]
[ROW][C]10[/C][C]-0.017012[/C][C]-0.1887[/C][C]0.425331[/C][/ROW]
[ROW][C]11[/C][C]-0.025517[/C][C]-0.283[/C][C]0.388827[/C][/ROW]
[ROW][C]12[/C][C]0.072435[/C][C]0.8033[/C][C]0.211662[/C][/ROW]
[ROW][C]13[/C][C]0.019555[/C][C]0.2169[/C][C]0.414334[/C][/ROW]
[ROW][C]14[/C][C]-0.130809[/C][C]-1.4507[/C][C]0.074699[/C][/ROW]
[ROW][C]15[/C][C]0.12301[/C][C]1.3642[/C][C]0.087491[/C][/ROW]
[ROW][C]16[/C][C]-0.004182[/C][C]-0.0464[/C][C]0.481542[/C][/ROW]
[ROW][C]17[/C][C]-0.131559[/C][C]-1.4591[/C][C]0.073549[/C][/ROW]
[ROW][C]18[/C][C]0.135525[/C][C]1.503[/C][C]0.067695[/C][/ROW]
[ROW][C]19[/C][C]-0.022014[/C][C]-0.2441[/C][C]0.403762[/C][/ROW]
[ROW][C]20[/C][C]-0.035424[/C][C]-0.3929[/C][C]0.347548[/C][/ROW]
[ROW][C]21[/C][C]0.049967[/C][C]0.5542[/C][C]0.290236[/C][/ROW]
[ROW][C]22[/C][C]-0.119996[/C][C]-1.3308[/C][C]0.092856[/C][/ROW]
[ROW][C]23[/C][C]0.143425[/C][C]1.5907[/C][C]0.057126[/C][/ROW]
[ROW][C]24[/C][C]-0.086847[/C][C]-0.9632[/C][C]0.168675[/C][/ROW]
[ROW][C]25[/C][C]0.056845[/C][C]0.6304[/C][C]0.264789[/C][/ROW]
[ROW][C]26[/C][C]-0.051234[/C][C]-0.5682[/C][C]0.285464[/C][/ROW]
[ROW][C]27[/C][C]0.03117[/C][C]0.3457[/C][C]0.365081[/C][/ROW]
[ROW][C]28[/C][C]0.004286[/C][C]0.0475[/C][C]0.481083[/C][/ROW]
[ROW][C]29[/C][C]-0.035123[/C][C]-0.3895[/C][C]0.348779[/C][/ROW]
[ROW][C]30[/C][C]0.001001[/C][C]0.0111[/C][C]0.495578[/C][/ROW]
[ROW][C]31[/C][C]0.082303[/C][C]0.9128[/C][C]0.181572[/C][/ROW]
[ROW][C]32[/C][C]-0.127668[/C][C]-1.4159[/C][C]0.079664[/C][/ROW]
[ROW][C]33[/C][C]0.109403[/C][C]1.2133[/C][C]0.113664[/C][/ROW]
[ROW][C]34[/C][C]-0.016114[/C][C]-0.1787[/C][C]0.429226[/C][/ROW]
[ROW][C]35[/C][C]-0.131801[/C][C]-1.4617[/C][C]0.073182[/C][/ROW]
[ROW][C]36[/C][C]0.182042[/C][C]2.0189[/C][C]0.022834[/C][/ROW]
[ROW][C]37[/C][C]-0.094266[/C][C]-1.0455[/C][C]0.14893[/C][/ROW]
[ROW][C]38[/C][C]-0.021796[/C][C]-0.2417[/C][C]0.404698[/C][/ROW]
[ROW][C]39[/C][C]0.116233[/C][C]1.2891[/C][C]0.099893[/C][/ROW]
[ROW][C]40[/C][C]-0.118053[/C][C]-1.3093[/C][C]0.096442[/C][/ROW]
[ROW][C]41[/C][C]0.025262[/C][C]0.2802[/C][C]0.38991[/C][/ROW]
[ROW][C]42[/C][C]0.002291[/C][C]0.0254[/C][C]0.489884[/C][/ROW]
[ROW][C]43[/C][C]0.064672[/C][C]0.7172[/C][C]0.23729[/C][/ROW]
[ROW][C]44[/C][C]-0.071769[/C][C]-0.796[/C][C]0.213794[/C][/ROW]
[ROW][C]45[/C][C]0.029339[/C][C]0.3254[/C][C]0.37272[/C][/ROW]
[ROW][C]46[/C][C]-0.002653[/C][C]-0.0294[/C][C]0.488288[/C][/ROW]
[ROW][C]47[/C][C]-0.083576[/C][C]-0.9269[/C][C]0.177897[/C][/ROW]
[ROW][C]48[/C][C]0.148345[/C][C]1.6452[/C][C]0.051238[/C][/ROW]
[/TABLE]
Source: https://freestatistics.org/blog/index.php?pk=301502&T=1

Globally Unique Identifier (entire table): ba.freestatistics.org/blog/index.php?pk=301502&T=1

As an alternative you can also use a QR Code:  

The GUIDs for individual cells are displayed in the table below:

Autocorrelation Function
Time lag kACF(k)T-STATP-value
1-0.577532-6.40510
2-0.031249-0.34660.364755
30.1517911.68340.047413
4-4.9e-05-5e-040.499783
5-0.060567-0.67170.251512
6-0.023003-0.25510.399531
70.0866360.96080.169258
8-0.043923-0.48710.313519
90.0021110.02340.490679
10-0.017012-0.18870.425331
11-0.025517-0.2830.388827
120.0724350.80330.211662
130.0195550.21690.414334
14-0.130809-1.45070.074699
150.123011.36420.087491
16-0.004182-0.04640.481542
17-0.131559-1.45910.073549
180.1355251.5030.067695
19-0.022014-0.24410.403762
20-0.035424-0.39290.347548
210.0499670.55420.290236
22-0.119996-1.33080.092856
230.1434251.59070.057126
24-0.086847-0.96320.168675
250.0568450.63040.264789
26-0.051234-0.56820.285464
270.031170.34570.365081
280.0042860.04750.481083
29-0.035123-0.38950.348779
300.0010010.01110.495578
310.0823030.91280.181572
32-0.127668-1.41590.079664
330.1094031.21330.113664
34-0.016114-0.17870.429226
35-0.131801-1.46170.073182
360.1820422.01890.022834
37-0.094266-1.04550.14893
38-0.021796-0.24170.404698
390.1162331.28910.099893
40-0.118053-1.30930.096442
410.0252620.28020.38991
420.0022910.02540.489884
430.0646720.71720.23729
44-0.071769-0.7960.213794
450.0293390.32540.37272
46-0.002653-0.02940.488288
47-0.083576-0.92690.177897
480.1483451.64520.051238


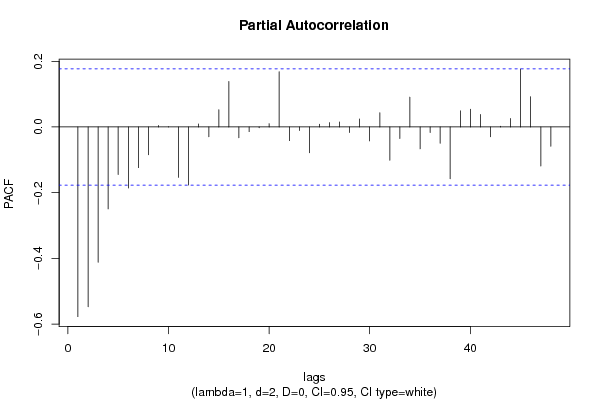
Partial Autocorrelation Function
Time lag kPACF(k)T-STATP-value
1-0.577532-6.40510
2-0.54736-6.07050
3-0.411865-4.56786e-06
4-0.24936-2.76550.00328
5-0.144781-1.60570.055453
6-0.185949-2.06230.020644
7-0.123745-1.37240.086219
8-0.084331-0.93530.17574
90.0045460.05040.479936
100.0006840.00760.49698
11-0.153406-1.70140.045701
12-0.176848-1.96130.02605
130.0091410.10140.459706
14-0.029805-0.33060.370771
150.0524420.58160.280945
160.1386091.53720.0634
17-0.032755-0.36330.358515
18-0.014107-0.15650.437967
19-0.00212-0.02350.490641
200.0101570.11260.455247
210.1684611.86830.032048
22-0.041597-0.46130.322688
23-0.010898-0.12090.451997
24-0.078242-0.86770.193612
250.0086430.09590.461894
260.0132720.14720.441608
270.0149840.16620.434144
28-0.016568-0.18370.427257
290.024410.27070.393529
30-0.042371-0.46990.319622
310.0432870.48010.316015
32-0.101556-1.12630.131113
33-0.034905-0.38710.349671
340.0908421.00750.157839
35-0.066568-0.73830.230878
36-0.016747-0.18570.426479
37-0.04952-0.54920.29193
38-0.157424-1.74590.041661
390.049090.54440.293565
400.054190.6010.274474
410.0379210.42060.337405
42-0.029716-0.32960.371145
430.0024350.0270.489252
440.0257490.28560.387845
450.176341.95570.026383
460.0920481.02090.154662
47-0.118756-1.31710.095132
48-0.058642-0.65040.258331

\begin{tabular}{lllllllll}
\hline
Partial Autocorrelation Function \tabularnewline
Time lag k & PACF(k) & T-STAT & P-value \tabularnewline
1 & -0.577532 & -6.4051 & 0 \tabularnewline
2 & -0.54736 & -6.0705 & 0 \tabularnewline
3 & -0.411865 & -4.5678 & 6e-06 \tabularnewline
4 & -0.24936 & -2.7655 & 0.00328 \tabularnewline
5 & -0.144781 & -1.6057 & 0.055453 \tabularnewline
6 & -0.185949 & -2.0623 & 0.020644 \tabularnewline
7 & -0.123745 & -1.3724 & 0.086219 \tabularnewline
8 & -0.084331 & -0.9353 & 0.17574 \tabularnewline
9 & 0.004546 & 0.0504 & 0.479936 \tabularnewline
10 & 0.000684 & 0.0076 & 0.49698 \tabularnewline
11 & -0.153406 & -1.7014 & 0.045701 \tabularnewline
12 & -0.176848 & -1.9613 & 0.02605 \tabularnewline
13 & 0.009141 & 0.1014 & 0.459706 \tabularnewline
14 & -0.029805 & -0.3306 & 0.370771 \tabularnewline
15 & 0.052442 & 0.5816 & 0.280945 \tabularnewline
16 & 0.138609 & 1.5372 & 0.0634 \tabularnewline
17 & -0.032755 & -0.3633 & 0.358515 \tabularnewline
18 & -0.014107 & -0.1565 & 0.437967 \tabularnewline
19 & -0.00212 & -0.0235 & 0.490641 \tabularnewline
20 & 0.010157 & 0.1126 & 0.455247 \tabularnewline
21 & 0.168461 & 1.8683 & 0.032048 \tabularnewline
22 & -0.041597 & -0.4613 & 0.322688 \tabularnewline
23 & -0.010898 & -0.1209 & 0.451997 \tabularnewline
24 & -0.078242 & -0.8677 & 0.193612 \tabularnewline
25 & 0.008643 & 0.0959 & 0.461894 \tabularnewline
26 & 0.013272 & 0.1472 & 0.441608 \tabularnewline
27 & 0.014984 & 0.1662 & 0.434144 \tabularnewline
28 & -0.016568 & -0.1837 & 0.427257 \tabularnewline
29 & 0.02441 & 0.2707 & 0.393529 \tabularnewline
30 & -0.042371 & -0.4699 & 0.319622 \tabularnewline
31 & 0.043287 & 0.4801 & 0.316015 \tabularnewline
32 & -0.101556 & -1.1263 & 0.131113 \tabularnewline
33 & -0.034905 & -0.3871 & 0.349671 \tabularnewline
34 & 0.090842 & 1.0075 & 0.157839 \tabularnewline
35 & -0.066568 & -0.7383 & 0.230878 \tabularnewline
36 & -0.016747 & -0.1857 & 0.426479 \tabularnewline
37 & -0.04952 & -0.5492 & 0.29193 \tabularnewline
38 & -0.157424 & -1.7459 & 0.041661 \tabularnewline
39 & 0.04909 & 0.5444 & 0.293565 \tabularnewline
40 & 0.05419 & 0.601 & 0.274474 \tabularnewline
41 & 0.037921 & 0.4206 & 0.337405 \tabularnewline
42 & -0.029716 & -0.3296 & 0.371145 \tabularnewline
43 & 0.002435 & 0.027 & 0.489252 \tabularnewline
44 & 0.025749 & 0.2856 & 0.387845 \tabularnewline
45 & 0.17634 & 1.9557 & 0.026383 \tabularnewline
46 & 0.092048 & 1.0209 & 0.154662 \tabularnewline
47 & -0.118756 & -1.3171 & 0.095132 \tabularnewline
48 & -0.058642 & -0.6504 & 0.258331 \tabularnewline
\hline
\end{tabular}
%Source: https://freestatistics.org/blog/index.php?pk=301502&T=2

[TABLE]
[ROW][C]Partial Autocorrelation Function[/C][/ROW]
[ROW][C]Time lag k[/C][C]PACF(k)[/C][C]T-STAT[/C][C]P-value[/C][/ROW]
[ROW][C]1[/C][C]-0.577532[/C][C]-6.4051[/C][C]0[/C][/ROW]
[ROW][C]2[/C][C]-0.54736[/C][C]-6.0705[/C][C]0[/C][/ROW]
[ROW][C]3[/C][C]-0.411865[/C][C]-4.5678[/C][C]6e-06[/C][/ROW]
[ROW][C]4[/C][C]-0.24936[/C][C]-2.7655[/C][C]0.00328[/C][/ROW]
[ROW][C]5[/C][C]-0.144781[/C][C]-1.6057[/C][C]0.055453[/C][/ROW]
[ROW][C]6[/C][C]-0.185949[/C][C]-2.0623[/C][C]0.020644[/C][/ROW]
[ROW][C]7[/C][C]-0.123745[/C][C]-1.3724[/C][C]0.086219[/C][/ROW]
[ROW][C]8[/C][C]-0.084331[/C][C]-0.9353[/C][C]0.17574[/C][/ROW]
[ROW][C]9[/C][C]0.004546[/C][C]0.0504[/C][C]0.479936[/C][/ROW]
[ROW][C]10[/C][C]0.000684[/C][C]0.0076[/C][C]0.49698[/C][/ROW]
[ROW][C]11[/C][C]-0.153406[/C][C]-1.7014[/C][C]0.045701[/C][/ROW]
[ROW][C]12[/C][C]-0.176848[/C][C]-1.9613[/C][C]0.02605[/C][/ROW]
[ROW][C]13[/C][C]0.009141[/C][C]0.1014[/C][C]0.459706[/C][/ROW]
[ROW][C]14[/C][C]-0.029805[/C][C]-0.3306[/C][C]0.370771[/C][/ROW]
[ROW][C]15[/C][C]0.052442[/C][C]0.5816[/C][C]0.280945[/C][/ROW]
[ROW][C]16[/C][C]0.138609[/C][C]1.5372[/C][C]0.0634[/C][/ROW]
[ROW][C]17[/C][C]-0.032755[/C][C]-0.3633[/C][C]0.358515[/C][/ROW]
[ROW][C]18[/C][C]-0.014107[/C][C]-0.1565[/C][C]0.437967[/C][/ROW]
[ROW][C]19[/C][C]-0.00212[/C][C]-0.0235[/C][C]0.490641[/C][/ROW]
[ROW][C]20[/C][C]0.010157[/C][C]0.1126[/C][C]0.455247[/C][/ROW]
[ROW][C]21[/C][C]0.168461[/C][C]1.8683[/C][C]0.032048[/C][/ROW]
[ROW][C]22[/C][C]-0.041597[/C][C]-0.4613[/C][C]0.322688[/C][/ROW]
[ROW][C]23[/C][C]-0.010898[/C][C]-0.1209[/C][C]0.451997[/C][/ROW]
[ROW][C]24[/C][C]-0.078242[/C][C]-0.8677[/C][C]0.193612[/C][/ROW]
[ROW][C]25[/C][C]0.008643[/C][C]0.0959[/C][C]0.461894[/C][/ROW]
[ROW][C]26[/C][C]0.013272[/C][C]0.1472[/C][C]0.441608[/C][/ROW]
[ROW][C]27[/C][C]0.014984[/C][C]0.1662[/C][C]0.434144[/C][/ROW]
[ROW][C]28[/C][C]-0.016568[/C][C]-0.1837[/C][C]0.427257[/C][/ROW]
[ROW][C]29[/C][C]0.02441[/C][C]0.2707[/C][C]0.393529[/C][/ROW]
[ROW][C]30[/C][C]-0.042371[/C][C]-0.4699[/C][C]0.319622[/C][/ROW]
[ROW][C]31[/C][C]0.043287[/C][C]0.4801[/C][C]0.316015[/C][/ROW]
[ROW][C]32[/C][C]-0.101556[/C][C]-1.1263[/C][C]0.131113[/C][/ROW]
[ROW][C]33[/C][C]-0.034905[/C][C]-0.3871[/C][C]0.349671[/C][/ROW]
[ROW][C]34[/C][C]0.090842[/C][C]1.0075[/C][C]0.157839[/C][/ROW]
[ROW][C]35[/C][C]-0.066568[/C][C]-0.7383[/C][C]0.230878[/C][/ROW]
[ROW][C]36[/C][C]-0.016747[/C][C]-0.1857[/C][C]0.426479[/C][/ROW]
[ROW][C]37[/C][C]-0.04952[/C][C]-0.5492[/C][C]0.29193[/C][/ROW]
[ROW][C]38[/C][C]-0.157424[/C][C]-1.7459[/C][C]0.041661[/C][/ROW]
[ROW][C]39[/C][C]0.04909[/C][C]0.5444[/C][C]0.293565[/C][/ROW]
[ROW][C]40[/C][C]0.05419[/C][C]0.601[/C][C]0.274474[/C][/ROW]
[ROW][C]41[/C][C]0.037921[/C][C]0.4206[/C][C]0.337405[/C][/ROW]
[ROW][C]42[/C][C]-0.029716[/C][C]-0.3296[/C][C]0.371145[/C][/ROW]
[ROW][C]43[/C][C]0.002435[/C][C]0.027[/C][C]0.489252[/C][/ROW]
[ROW][C]44[/C][C]0.025749[/C][C]0.2856[/C][C]0.387845[/C][/ROW]
[ROW][C]45[/C][C]0.17634[/C][C]1.9557[/C][C]0.026383[/C][/ROW]
[ROW][C]46[/C][C]0.092048[/C][C]1.0209[/C][C]0.154662[/C][/ROW]
[ROW][C]47[/C][C]-0.118756[/C][C]-1.3171[/C][C]0.095132[/C][/ROW]
[ROW][C]48[/C][C]-0.058642[/C][C]-0.6504[/C][C]0.258331[/C][/ROW]
[/TABLE]
Source: https://freestatistics.org/blog/index.php?pk=301502&T=2

Globally Unique Identifier (entire table): ba.freestatistics.org/blog/index.php?pk=301502&T=2

As an alternative you can also use a QR Code:  

The GUIDs for individual cells are displayed in the table below:

Partial Autocorrelation Function
Time lag kPACF(k)T-STATP-value
1-0.577532-6.40510
2-0.54736-6.07050
3-0.411865-4.56786e-06
4-0.24936-2.76550.00328
5-0.144781-1.60570.055453
6-0.185949-2.06230.020644
7-0.123745-1.37240.086219
8-0.084331-0.93530.17574
90.0045460.05040.479936
100.0006840.00760.49698
11-0.153406-1.70140.045701
12-0.176848-1.96130.02605
130.0091410.10140.459706
14-0.029805-0.33060.370771
150.0524420.58160.280945
160.1386091.53720.0634
17-0.032755-0.36330.358515
18-0.014107-0.15650.437967
19-0.00212-0.02350.490641
200.0101570.11260.455247
210.1684611.86830.032048
22-0.041597-0.46130.322688
23-0.010898-0.12090.451997
24-0.078242-0.86770.193612
250.0086430.09590.461894
260.0132720.14720.441608
270.0149840.16620.434144
28-0.016568-0.18370.427257
290.024410.27070.393529
30-0.042371-0.46990.319622
310.0432870.48010.316015
32-0.101556-1.12630.131113
33-0.034905-0.38710.349671
340.0908421.00750.157839
35-0.066568-0.73830.230878
36-0.016747-0.18570.426479
37-0.04952-0.54920.29193
38-0.157424-1.74590.041661
390.049090.54440.293565
400.054190.6010.274474
410.0379210.42060.337405
42-0.029716-0.32960.371145
430.0024350.0270.489252
440.0257490.28560.387845
450.176341.95570.026383
460.0920481.02090.154662
47-0.118756-1.31710.095132
48-0.058642-0.65040.258331


Parameters (Session):
par1 = 48 ; par2 = 1 ; par3 = 2 ; par4 = 0 ; par5 = 12 ; par6 = White Noise ; par7 = 0.95 ;
Parameters (R input):
par1 = 48 ; par2 = 1 ; par3 = 2 ; par4 = 0 ; par5 = 12 ; par6 = White Noise ; par7 = 0.95 ; par8 = ;
R code (references can be found in the software module):
par8 <- ''
par7 <- '0.95'
par6 <- 'White Noise'
par5 <- '12'
par4 <- '0'
par3 <- '2'
par2 <- '1'
par1 <- '48'
if (par1 == 'Default') {
par1 = 10*log10(length(x))
} else {
par1 <- as.numeric(par1)
}
par2 <- as.numeric(par2)
par3 <- as.numeric(par3)
par4 <- as.numeric(par4)
par5 <- as.numeric(par5)
if (par6 == 'White Noise') par6 <- 'white' else par6 <- 'ma'
par7 <- as.numeric(par7)
if (par8 != '') par8 <- as.numeric(par8)
x <- na.omit(x)
ox <- x
if (par8 == '') {
if (par2 == 0) {
x <- log(x)
} else {
x <- (x ^ par2 - 1) / par2
}
} else {
x <- log(x,base=par8)
}
if (par3 > 0) x <- diff(x,lag=1,difference=par3)
if (par4 > 0) x <- diff(x,lag=par5,difference=par4)
bitmap(file='picts.png')
op <- par(mfrow=c(2,1))
plot(ox,type='l',main='Original Time Series',xlab='time',ylab='value')
if (par8=='') {
mytitle <- paste('Working Time Series (lambda=',par2,', d=',par3,', D=',par4,')',sep='')
mysub <- paste('(lambda=',par2,', d=',par3,', D=',par4,', CI=', par7, ', CI type=',par6,')',sep='')
} else {
mytitle <- paste('Working Time Series (base=',par8,', d=',par3,', D=',par4,')',sep='')
mysub <- paste('(base=',par8,', d=',par3,', D=',par4,', CI=', par7, ', CI type=',par6,')',sep='')
}
plot(x,type='l', main=mytitle,xlab='time',ylab='value')
par(op)
dev.off()
bitmap(file='pic1.png')
racf <- acf(x, par1, main='Autocorrelation', xlab='time lag', ylab='ACF', ci.type=par6, ci=par7, sub=mysub)
dev.off()
bitmap(file='pic2.png')
rpacf <- pacf(x,par1,main='Partial Autocorrelation',xlab='lags',ylab='PACF',sub=mysub)
dev.off()
(myacf <- c(racf$acf))
(mypacf <- c(rpacf$acf))
lengthx <- length(x)
sqrtn <- sqrt(lengthx)
load(file='createtable')
a<-table.start()
a<-table.row.start(a)
a<-table.element(a,'Autocorrelation Function',4,TRUE)
a<-table.row.end(a)
a<-table.row.start(a)
a<-table.element(a,'Time lag k',header=TRUE)
a<-table.element(a,'ACF(k)',header=TRUE)
a<-table.element(a,'T-STAT',header=TRUE)
a<-table.element(a,'P-value',header=TRUE)
a<-table.row.end(a)
for (i in 2:(par1+1)) {
a<-table.row.start(a)
a<-table.element(a,i-1,header=TRUE)
a<-table.element(a,round(myacf[i],6))
mytstat <- myacf[i]*sqrtn
a<-table.element(a,round(mytstat,4))
a<-table.element(a,round(1-pt(abs(mytstat),lengthx),6))
a<-table.row.end(a)
}
a<-table.end(a)
table.save(a,file='mytable.tab')
a<-table.start()
a<-table.row.start(a)
a<-table.element(a,'Partial Autocorrelation Function',4,TRUE)
a<-table.row.end(a)
a<-table.row.start(a)
a<-table.element(a,'Time lag k',header=TRUE)
a<-table.element(a,'PACF(k)',header=TRUE)
a<-table.element(a,'T-STAT',header=TRUE)
a<-table.element(a,'P-value',header=TRUE)
a<-table.row.end(a)
for (i in 1:par1) {
a<-table.row.start(a)
a<-table.element(a,i,header=TRUE)
a<-table.element(a,round(mypacf[i],6))
mytstat <- mypacf[i]*sqrtn
a<-table.element(a,round(mytstat,4))
a<-table.element(a,round(1-pt(abs(mytstat),lengthx),6))
a<-table.row.end(a)
}
a<-table.end(a)
table.save(a,file='mytable1.tab')