Free Statistics

of Irreproducible Research!

Author's title

Author*The author of this computation has been verified*
R Software Modulerwasp_arimabackwardselection.wasp
Title produced by softwareARIMA Backward Selection
Date of computationMon, 19 Dec 2016 21:45:14 +0100
Cite this page as followsStatistical Computations at FreeStatistics.org, Office for Research Development and Education, URL https://freestatistics.org/blog/index.php?v=date/2016/Dec/19/t1482180352o02ewrjw3shj8kw.htm/, Retrieved Fri, 17 May 2024 15:59:31 +0000
Statistical Computations at FreeStatistics.org, Office for Research Development and Education, URL https://freestatistics.org/blog/index.php?pk=301491, Retrieved Fri, 17 May 2024 15:59:31 +0000
QR Codes:

Original text written by user:
IsPrivate?No (this computation is public)
User-defined keywords
Estimated Impact57
Family? (F = Feedback message, R = changed R code, M = changed R Module, P = changed Parameters, D = changed Data)
-       [ARIMA Backward Selection] [N2044 ARIMA I] [2016-12-19 20:45:14] [2e11ca31a00cf8de75c33c1af2d59434] [Current]
Feedback Forum

Post a new message
Dataseries X:
3880
3740
3990
3970
4100
3920
3850
4190
3990
4140
4080
3900
4070
3930
4210
4020
4120
4020
3910
4110
4130
4340
4200
4200
4160
3920
4280
3940
4190
4150
4070
4130
3960
4320
4110
4100
4280
3990
4360
4240
4450
4190
3950
4300
4150
4540
4240
4210
4390
4140
4460
4290
4430
4390
4340
4570
4470
4550
4420
4490
4480
4400
4770
4450
4610
4540
4520
4710
4580
4760
4450
4500
4660
4370
5030
4510
4740
4690
4580
4850
4730
4890
4740
4600
4740
4520
5000
4670
4940
4790
4820
5010
4870
5070
4770
4840
4850
4590
5050
4770
4720
4740
4400
4840
4650
4860
4580
4640
4800
4660
5020
4700
4800
4700
4560


Summary of computational transaction
Raw Input view raw input (R code)
Raw Outputview raw output of R engine
Computing time4 seconds
R ServerBig Analytics Cloud Computing Center

\begin{tabular}{lllllllll}
\hline
Summary of computational transaction \tabularnewline
Raw Input view raw input (R code)  \tabularnewline
Raw Outputview raw output of R engine  \tabularnewline
Computing time4 seconds \tabularnewline
R ServerBig Analytics Cloud Computing Center \tabularnewline
\hline
\end{tabular}
%Source: https://freestatistics.org/blog/index.php?pk=301491&T=0

[TABLE]
[ROW]
Summary of computational transaction[/C][/ROW] [ROW]Raw Input[/C] view raw input (R code) [/C][/ROW] [ROW]Raw Output[/C]view raw output of R engine [/C][/ROW] [ROW]Computing time[/C]4 seconds[/C][/ROW] [ROW]R Server[/C]Big Analytics Cloud Computing Center[/C][/ROW] [/TABLE] Source: https://freestatistics.org/blog/index.php?pk=301491&T=0

Globally Unique Identifier (entire table): ba.freestatistics.org/blog/index.php?pk=301491&T=0

As an alternative you can also use a QR Code:  

The GUIDs for individual cells are displayed in the table below:

Summary of computational transaction
Raw Input view raw input (R code)
Raw Outputview raw output of R engine
Computing time4 seconds
R ServerBig Analytics Cloud Computing Center


ARIMA Parameter Estimation and Backward Selection
Iterationar1ar2ar3ma1sar1sma1
Estimates ( 1 )0.16670.12620.0175-0.7679-0.0149-0.7713
(p-val)(0.4025 )(0.3908 )(0.8876 )(0 )(0.9198 )(0 )
Estimates ( 2 )0.1690.12690.0197-0.77080-0.7817
(p-val)(0.3914 )(0.3865 )(0.8719 )(0 )(NA )(0 )
Estimates ( 3 )0.15470.1190-0.7550-0.783
(p-val)(0.3974 )(0.3994 )(NA )(0 )(NA )(0 )
Estimates ( 4 )0.046400-0.64220-0.7881
(p-val)(0.7974 )(NA )(NA )(0 )(NA )(0 )
Estimates ( 5 )000-0.60880-0.7872
(p-val)(NA )(NA )(NA )(0 )(NA )(0 )
Estimates ( 6 )NANANANANANA
(p-val)(NA )(NA )(NA )(NA )(NA )(NA )
Estimates ( 7 )NANANANANANA
(p-val)(NA )(NA )(NA )(NA )(NA )(NA )
Estimates ( 8 )NANANANANANA
(p-val)(NA )(NA )(NA )(NA )(NA )(NA )
Estimates ( 9 )NANANANANANA
(p-val)(NA )(NA )(NA )(NA )(NA )(NA )
Estimates ( 10 )NANANANANANA
(p-val)(NA )(NA )(NA )(NA )(NA )(NA )
Estimates ( 11 )NANANANANANA
(p-val)(NA )(NA )(NA )(NA )(NA )(NA )

\begin{tabular}{lllllllll}
\hline
ARIMA Parameter Estimation and Backward Selection \tabularnewline
Iteration & ar1 & ar2 & ar3 & ma1 & sar1 & sma1 \tabularnewline
Estimates ( 1 ) & 0.1667 & 0.1262 & 0.0175 & -0.7679 & -0.0149 & -0.7713 \tabularnewline
(p-val) & (0.4025 ) & (0.3908 ) & (0.8876 ) & (0 ) & (0.9198 ) & (0 ) \tabularnewline
Estimates ( 2 ) & 0.169 & 0.1269 & 0.0197 & -0.7708 & 0 & -0.7817 \tabularnewline
(p-val) & (0.3914 ) & (0.3865 ) & (0.8719 ) & (0 ) & (NA ) & (0 ) \tabularnewline
Estimates ( 3 ) & 0.1547 & 0.119 & 0 & -0.755 & 0 & -0.783 \tabularnewline
(p-val) & (0.3974 ) & (0.3994 ) & (NA ) & (0 ) & (NA ) & (0 ) \tabularnewline
Estimates ( 4 ) & 0.0464 & 0 & 0 & -0.6422 & 0 & -0.7881 \tabularnewline
(p-val) & (0.7974 ) & (NA ) & (NA ) & (0 ) & (NA ) & (0 ) \tabularnewline
Estimates ( 5 ) & 0 & 0 & 0 & -0.6088 & 0 & -0.7872 \tabularnewline
(p-val) & (NA ) & (NA ) & (NA ) & (0 ) & (NA ) & (0 ) \tabularnewline
Estimates ( 6 ) & NA & NA & NA & NA & NA & NA \tabularnewline
(p-val) & (NA ) & (NA ) & (NA ) & (NA ) & (NA ) & (NA ) \tabularnewline
Estimates ( 7 ) & NA & NA & NA & NA & NA & NA \tabularnewline
(p-val) & (NA ) & (NA ) & (NA ) & (NA ) & (NA ) & (NA ) \tabularnewline
Estimates ( 8 ) & NA & NA & NA & NA & NA & NA \tabularnewline
(p-val) & (NA ) & (NA ) & (NA ) & (NA ) & (NA ) & (NA ) \tabularnewline
Estimates ( 9 ) & NA & NA & NA & NA & NA & NA \tabularnewline
(p-val) & (NA ) & (NA ) & (NA ) & (NA ) & (NA ) & (NA ) \tabularnewline
Estimates ( 10 ) & NA & NA & NA & NA & NA & NA \tabularnewline
(p-val) & (NA ) & (NA ) & (NA ) & (NA ) & (NA ) & (NA ) \tabularnewline
Estimates ( 11 ) & NA & NA & NA & NA & NA & NA \tabularnewline
(p-val) & (NA ) & (NA ) & (NA ) & (NA ) & (NA ) & (NA ) \tabularnewline
\hline
\end{tabular}
%Source: https://freestatistics.org/blog/index.php?pk=301491&T=1

[TABLE]
[ROW][C]ARIMA Parameter Estimation and Backward Selection[/C][/ROW]
[ROW][C]Iteration[/C][C]ar1[/C][C]ar2[/C][C]ar3[/C][C]ma1[/C][C]sar1[/C][C]sma1[/C][/ROW]
[ROW][C]Estimates ( 1 )[/C][C]0.1667[/C][C]0.1262[/C][C]0.0175[/C][C]-0.7679[/C][C]-0.0149[/C][C]-0.7713[/C][/ROW]
[ROW][C](p-val)[/C][C](0.4025 )[/C][C](0.3908 )[/C][C](0.8876 )[/C][C](0 )[/C][C](0.9198 )[/C][C](0 )[/C][/ROW]
[ROW][C]Estimates ( 2 )[/C][C]0.169[/C][C]0.1269[/C][C]0.0197[/C][C]-0.7708[/C][C]0[/C][C]-0.7817[/C][/ROW]
[ROW][C](p-val)[/C][C](0.3914 )[/C][C](0.3865 )[/C][C](0.8719 )[/C][C](0 )[/C][C](NA )[/C][C](0 )[/C][/ROW]
[ROW][C]Estimates ( 3 )[/C][C]0.1547[/C][C]0.119[/C][C]0[/C][C]-0.755[/C][C]0[/C][C]-0.783[/C][/ROW]
[ROW][C](p-val)[/C][C](0.3974 )[/C][C](0.3994 )[/C][C](NA )[/C][C](0 )[/C][C](NA )[/C][C](0 )[/C][/ROW]
[ROW][C]Estimates ( 4 )[/C][C]0.0464[/C][C]0[/C][C]0[/C][C]-0.6422[/C][C]0[/C][C]-0.7881[/C][/ROW]
[ROW][C](p-val)[/C][C](0.7974 )[/C][C](NA )[/C][C](NA )[/C][C](0 )[/C][C](NA )[/C][C](0 )[/C][/ROW]
[ROW][C]Estimates ( 5 )[/C][C]0[/C][C]0[/C][C]0[/C][C]-0.6088[/C][C]0[/C][C]-0.7872[/C][/ROW]
[ROW][C](p-val)[/C][C](NA )[/C][C](NA )[/C][C](NA )[/C][C](0 )[/C][C](NA )[/C][C](0 )[/C][/ROW]
[ROW][C]Estimates ( 6 )[/C][C]NA[/C][C]NA[/C][C]NA[/C][C]NA[/C][C]NA[/C][C]NA[/C][/ROW]
[ROW][C](p-val)[/C][C](NA )[/C][C](NA )[/C][C](NA )[/C][C](NA )[/C][C](NA )[/C][C](NA )[/C][/ROW]
[ROW][C]Estimates ( 7 )[/C][C]NA[/C][C]NA[/C][C]NA[/C][C]NA[/C][C]NA[/C][C]NA[/C][/ROW]
[ROW][C](p-val)[/C][C](NA )[/C][C](NA )[/C][C](NA )[/C][C](NA )[/C][C](NA )[/C][C](NA )[/C][/ROW]
[ROW][C]Estimates ( 8 )[/C][C]NA[/C][C]NA[/C][C]NA[/C][C]NA[/C][C]NA[/C][C]NA[/C][/ROW]
[ROW][C](p-val)[/C][C](NA )[/C][C](NA )[/C][C](NA )[/C][C](NA )[/C][C](NA )[/C][C](NA )[/C][/ROW]
[ROW][C]Estimates ( 9 )[/C][C]NA[/C][C]NA[/C][C]NA[/C][C]NA[/C][C]NA[/C][C]NA[/C][/ROW]
[ROW][C](p-val)[/C][C](NA )[/C][C](NA )[/C][C](NA )[/C][C](NA )[/C][C](NA )[/C][C](NA )[/C][/ROW]
[ROW][C]Estimates ( 10 )[/C][C]NA[/C][C]NA[/C][C]NA[/C][C]NA[/C][C]NA[/C][C]NA[/C][/ROW]
[ROW][C](p-val)[/C][C](NA )[/C][C](NA )[/C][C](NA )[/C][C](NA )[/C][C](NA )[/C][C](NA )[/C][/ROW]
[ROW][C]Estimates ( 11 )[/C][C]NA[/C][C]NA[/C][C]NA[/C][C]NA[/C][C]NA[/C][C]NA[/C][/ROW]
[ROW][C](p-val)[/C][C](NA )[/C][C](NA )[/C][C](NA )[/C][C](NA )[/C][C](NA )[/C][C](NA )[/C][/ROW]
[/TABLE]
Source: https://freestatistics.org/blog/index.php?pk=301491&T=1

Globally Unique Identifier (entire table): ba.freestatistics.org/blog/index.php?pk=301491&T=1

As an alternative you can also use a QR Code:  

The GUIDs for individual cells are displayed in the table below:

ARIMA Parameter Estimation and Backward Selection
Iterationar1ar2ar3ma1sar1sma1
Estimates ( 1 )0.16670.12620.0175-0.7679-0.0149-0.7713
(p-val)(0.4025 )(0.3908 )(0.8876 )(0 )(0.9198 )(0 )
Estimates ( 2 )0.1690.12690.0197-0.77080-0.7817
(p-val)(0.3914 )(0.3865 )(0.8719 )(0 )(NA )(0 )
Estimates ( 3 )0.15470.1190-0.7550-0.783
(p-val)(0.3974 )(0.3994 )(NA )(0 )(NA )(0 )
Estimates ( 4 )0.046400-0.64220-0.7881
(p-val)(0.7974 )(NA )(NA )(0 )(NA )(0 )
Estimates ( 5 )000-0.60880-0.7872
(p-val)(NA )(NA )(NA )(0 )(NA )(0 )
Estimates ( 6 )NANANANANANA
(p-val)(NA )(NA )(NA )(NA )(NA )(NA )
Estimates ( 7 )NANANANANANA
(p-val)(NA )(NA )(NA )(NA )(NA )(NA )
Estimates ( 8 )NANANANANANA
(p-val)(NA )(NA )(NA )(NA )(NA )(NA )
Estimates ( 9 )NANANANANANA
(p-val)(NA )(NA )(NA )(NA )(NA )(NA )
Estimates ( 10 )NANANANANANA
(p-val)(NA )(NA )(NA )(NA )(NA )(NA )
Estimates ( 11 )NANANANANANA
(p-val)(NA )(NA )(NA )(NA )(NA )(NA )


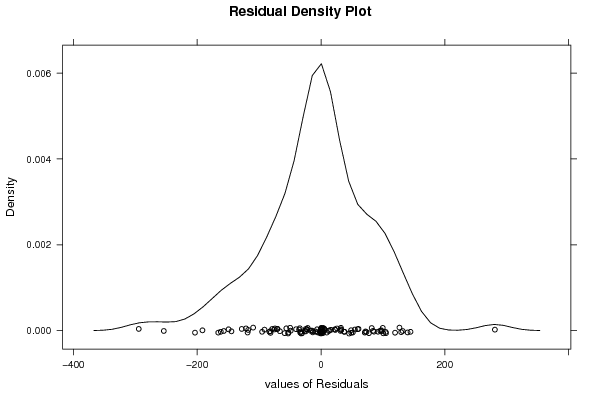
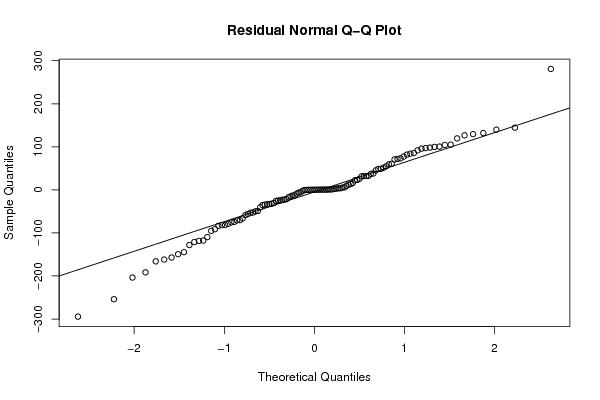
Estimated ARIMA Residuals
Value
-13.1272759524767
-0.0352270667779559
22.3631581765909
-118.607830274072
-91.3147471080159
5.72862419926246
-30.628951673201
-128.072573650105
95.6710441217714
100.511144671285
-0.460712372447728
144.508038275618
-70.3594125531447
-121.203593718486
13.3775874379165
-203.614092518376
1.25488248271911
83.9662315192858
59.2165284394421
-149.404214866778
-161.876969912829
60.5475013717101
-66.4371046777214
32.1867685202751
139.813194235306
-25.7390218155904
54.7592794465074
99.6932860778519
104.340589295047
-83.4813763270316
-191.55095843656
32.6393681765558
-17.0235716679637
126.671647697209
-75.5417250586242
-13.2514107872577
73.2546045026859
3.74351674310771
3.63495958712636
2.94935763743078
-34.4080108167383
85.5626332366229
129.497547250407
70.6664513769347
71.7967916095436
-157.091387701948
-35.4762344543508
91.8754510066518
-70.760639440327
98.1452134372731
104.967449487568
-81.6323010627425
-53.1199729493513
16.1762809785063
97.0341889838266
12.3422096795845
0.0969397516956199
-52.6253549998356
-165.996830517774
-32.2156092473666
48.8213900457214
-74.3022264485204
280.828242592956
-144.709474928104
-15.0724822065431
45.3229730756595
5.45583324751759
48.5245215229444
31.3882820011682
-40.3586290327979
32.1090771503064
-117.70325217628
-33.6867827264628
-32.8047340425899
51.2591636096411
-21.5576860138068
77.3334249302211
-8.93350500640201
119.605439440607
25.7400381139552
0.533994356160612
-5.83705297968497
-109.654421504253
38.0081659286747
-82.1335586439145
-95.2093563433055
-22.7988948703492
-6.37012814862396
-253.969319153132
-24.6718593545998
-294.443277120842
37.1667718918781
-49.9464035503336
-24.6205394763334
-78.8919641572395
22.9623964280863
81.8592983105448
131.839367753679
9.3120998730756
-22.8119947832091
-58.7747926475925
-56.0402367722546
-49.0135775532274

\begin{tabular}{lllllllll}
\hline
Estimated ARIMA Residuals \tabularnewline
Value \tabularnewline
-13.1272759524767 \tabularnewline
-0.0352270667779559 \tabularnewline
22.3631581765909 \tabularnewline
-118.607830274072 \tabularnewline
-91.3147471080159 \tabularnewline
5.72862419926246 \tabularnewline
-30.628951673201 \tabularnewline
-128.072573650105 \tabularnewline
95.6710441217714 \tabularnewline
100.511144671285 \tabularnewline
-0.460712372447728 \tabularnewline
144.508038275618 \tabularnewline
-70.3594125531447 \tabularnewline
-121.203593718486 \tabularnewline
13.3775874379165 \tabularnewline
-203.614092518376 \tabularnewline
1.25488248271911 \tabularnewline
83.9662315192858 \tabularnewline
59.2165284394421 \tabularnewline
-149.404214866778 \tabularnewline
-161.876969912829 \tabularnewline
60.5475013717101 \tabularnewline
-66.4371046777214 \tabularnewline
32.1867685202751 \tabularnewline
139.813194235306 \tabularnewline
-25.7390218155904 \tabularnewline
54.7592794465074 \tabularnewline
99.6932860778519 \tabularnewline
104.340589295047 \tabularnewline
-83.4813763270316 \tabularnewline
-191.55095843656 \tabularnewline
32.6393681765558 \tabularnewline
-17.0235716679637 \tabularnewline
126.671647697209 \tabularnewline
-75.5417250586242 \tabularnewline
-13.2514107872577 \tabularnewline
73.2546045026859 \tabularnewline
3.74351674310771 \tabularnewline
3.63495958712636 \tabularnewline
2.94935763743078 \tabularnewline
-34.4080108167383 \tabularnewline
85.5626332366229 \tabularnewline
129.497547250407 \tabularnewline
70.6664513769347 \tabularnewline
71.7967916095436 \tabularnewline
-157.091387701948 \tabularnewline
-35.4762344543508 \tabularnewline
91.8754510066518 \tabularnewline
-70.760639440327 \tabularnewline
98.1452134372731 \tabularnewline
104.967449487568 \tabularnewline
-81.6323010627425 \tabularnewline
-53.1199729493513 \tabularnewline
16.1762809785063 \tabularnewline
97.0341889838266 \tabularnewline
12.3422096795845 \tabularnewline
0.0969397516956199 \tabularnewline
-52.6253549998356 \tabularnewline
-165.996830517774 \tabularnewline
-32.2156092473666 \tabularnewline
48.8213900457214 \tabularnewline
-74.3022264485204 \tabularnewline
280.828242592956 \tabularnewline
-144.709474928104 \tabularnewline
-15.0724822065431 \tabularnewline
45.3229730756595 \tabularnewline
5.45583324751759 \tabularnewline
48.5245215229444 \tabularnewline
31.3882820011682 \tabularnewline
-40.3586290327979 \tabularnewline
32.1090771503064 \tabularnewline
-117.70325217628 \tabularnewline
-33.6867827264628 \tabularnewline
-32.8047340425899 \tabularnewline
51.2591636096411 \tabularnewline
-21.5576860138068 \tabularnewline
77.3334249302211 \tabularnewline
-8.93350500640201 \tabularnewline
119.605439440607 \tabularnewline
25.7400381139552 \tabularnewline
0.533994356160612 \tabularnewline
-5.83705297968497 \tabularnewline
-109.654421504253 \tabularnewline
38.0081659286747 \tabularnewline
-82.1335586439145 \tabularnewline
-95.2093563433055 \tabularnewline
-22.7988948703492 \tabularnewline
-6.37012814862396 \tabularnewline
-253.969319153132 \tabularnewline
-24.6718593545998 \tabularnewline
-294.443277120842 \tabularnewline
37.1667718918781 \tabularnewline
-49.9464035503336 \tabularnewline
-24.6205394763334 \tabularnewline
-78.8919641572395 \tabularnewline
22.9623964280863 \tabularnewline
81.8592983105448 \tabularnewline
131.839367753679 \tabularnewline
9.3120998730756 \tabularnewline
-22.8119947832091 \tabularnewline
-58.7747926475925 \tabularnewline
-56.0402367722546 \tabularnewline
-49.0135775532274 \tabularnewline
\hline
\end{tabular}
%Source: https://freestatistics.org/blog/index.php?pk=301491&T=2

[TABLE]
[ROW][C]Estimated ARIMA Residuals[/C][/ROW]
[ROW][C]Value[/C][/ROW]
[ROW][C]-13.1272759524767[/C][/ROW]
[ROW][C]-0.0352270667779559[/C][/ROW]
[ROW][C]22.3631581765909[/C][/ROW]
[ROW][C]-118.607830274072[/C][/ROW]
[ROW][C]-91.3147471080159[/C][/ROW]
[ROW][C]5.72862419926246[/C][/ROW]
[ROW][C]-30.628951673201[/C][/ROW]
[ROW][C]-128.072573650105[/C][/ROW]
[ROW][C]95.6710441217714[/C][/ROW]
[ROW][C]100.511144671285[/C][/ROW]
[ROW][C]-0.460712372447728[/C][/ROW]
[ROW][C]144.508038275618[/C][/ROW]
[ROW][C]-70.3594125531447[/C][/ROW]
[ROW][C]-121.203593718486[/C][/ROW]
[ROW][C]13.3775874379165[/C][/ROW]
[ROW][C]-203.614092518376[/C][/ROW]
[ROW][C]1.25488248271911[/C][/ROW]
[ROW][C]83.9662315192858[/C][/ROW]
[ROW][C]59.2165284394421[/C][/ROW]
[ROW][C]-149.404214866778[/C][/ROW]
[ROW][C]-161.876969912829[/C][/ROW]
[ROW][C]60.5475013717101[/C][/ROW]
[ROW][C]-66.4371046777214[/C][/ROW]
[ROW][C]32.1867685202751[/C][/ROW]
[ROW][C]139.813194235306[/C][/ROW]
[ROW][C]-25.7390218155904[/C][/ROW]
[ROW][C]54.7592794465074[/C][/ROW]
[ROW][C]99.6932860778519[/C][/ROW]
[ROW][C]104.340589295047[/C][/ROW]
[ROW][C]-83.4813763270316[/C][/ROW]
[ROW][C]-191.55095843656[/C][/ROW]
[ROW][C]32.6393681765558[/C][/ROW]
[ROW][C]-17.0235716679637[/C][/ROW]
[ROW][C]126.671647697209[/C][/ROW]
[ROW][C]-75.5417250586242[/C][/ROW]
[ROW][C]-13.2514107872577[/C][/ROW]
[ROW][C]73.2546045026859[/C][/ROW]
[ROW][C]3.74351674310771[/C][/ROW]
[ROW][C]3.63495958712636[/C][/ROW]
[ROW][C]2.94935763743078[/C][/ROW]
[ROW][C]-34.4080108167383[/C][/ROW]
[ROW][C]85.5626332366229[/C][/ROW]
[ROW][C]129.497547250407[/C][/ROW]
[ROW][C]70.6664513769347[/C][/ROW]
[ROW][C]71.7967916095436[/C][/ROW]
[ROW][C]-157.091387701948[/C][/ROW]
[ROW][C]-35.4762344543508[/C][/ROW]
[ROW][C]91.8754510066518[/C][/ROW]
[ROW][C]-70.760639440327[/C][/ROW]
[ROW][C]98.1452134372731[/C][/ROW]
[ROW][C]104.967449487568[/C][/ROW]
[ROW][C]-81.6323010627425[/C][/ROW]
[ROW][C]-53.1199729493513[/C][/ROW]
[ROW][C]16.1762809785063[/C][/ROW]
[ROW][C]97.0341889838266[/C][/ROW]
[ROW][C]12.3422096795845[/C][/ROW]
[ROW][C]0.0969397516956199[/C][/ROW]
[ROW][C]-52.6253549998356[/C][/ROW]
[ROW][C]-165.996830517774[/C][/ROW]
[ROW][C]-32.2156092473666[/C][/ROW]
[ROW][C]48.8213900457214[/C][/ROW]
[ROW][C]-74.3022264485204[/C][/ROW]
[ROW][C]280.828242592956[/C][/ROW]
[ROW][C]-144.709474928104[/C][/ROW]
[ROW][C]-15.0724822065431[/C][/ROW]
[ROW][C]45.3229730756595[/C][/ROW]
[ROW][C]5.45583324751759[/C][/ROW]
[ROW][C]48.5245215229444[/C][/ROW]
[ROW][C]31.3882820011682[/C][/ROW]
[ROW][C]-40.3586290327979[/C][/ROW]
[ROW][C]32.1090771503064[/C][/ROW]
[ROW][C]-117.70325217628[/C][/ROW]
[ROW][C]-33.6867827264628[/C][/ROW]
[ROW][C]-32.8047340425899[/C][/ROW]
[ROW][C]51.2591636096411[/C][/ROW]
[ROW][C]-21.5576860138068[/C][/ROW]
[ROW][C]77.3334249302211[/C][/ROW]
[ROW][C]-8.93350500640201[/C][/ROW]
[ROW][C]119.605439440607[/C][/ROW]
[ROW][C]25.7400381139552[/C][/ROW]
[ROW][C]0.533994356160612[/C][/ROW]
[ROW][C]-5.83705297968497[/C][/ROW]
[ROW][C]-109.654421504253[/C][/ROW]
[ROW][C]38.0081659286747[/C][/ROW]
[ROW][C]-82.1335586439145[/C][/ROW]
[ROW][C]-95.2093563433055[/C][/ROW]
[ROW][C]-22.7988948703492[/C][/ROW]
[ROW][C]-6.37012814862396[/C][/ROW]
[ROW][C]-253.969319153132[/C][/ROW]
[ROW][C]-24.6718593545998[/C][/ROW]
[ROW][C]-294.443277120842[/C][/ROW]
[ROW][C]37.1667718918781[/C][/ROW]
[ROW][C]-49.9464035503336[/C][/ROW]
[ROW][C]-24.6205394763334[/C][/ROW]
[ROW][C]-78.8919641572395[/C][/ROW]
[ROW][C]22.9623964280863[/C][/ROW]
[ROW][C]81.8592983105448[/C][/ROW]
[ROW][C]131.839367753679[/C][/ROW]
[ROW][C]9.3120998730756[/C][/ROW]
[ROW][C]-22.8119947832091[/C][/ROW]
[ROW][C]-58.7747926475925[/C][/ROW]
[ROW][C]-56.0402367722546[/C][/ROW]
[ROW][C]-49.0135775532274[/C][/ROW]
[/TABLE]
Source: https://freestatistics.org/blog/index.php?pk=301491&T=2

Globally Unique Identifier (entire table): ba.freestatistics.org/blog/index.php?pk=301491&T=2

As an alternative you can also use a QR Code:  

The GUIDs for individual cells are displayed in the table below:

Estimated ARIMA Residuals
Value
-13.1272759524767
-0.0352270667779559
22.3631581765909
-118.607830274072
-91.3147471080159
5.72862419926246
-30.628951673201
-128.072573650105
95.6710441217714
100.511144671285
-0.460712372447728
144.508038275618
-70.3594125531447
-121.203593718486
13.3775874379165
-203.614092518376
1.25488248271911
83.9662315192858
59.2165284394421
-149.404214866778
-161.876969912829
60.5475013717101
-66.4371046777214
32.1867685202751
139.813194235306
-25.7390218155904
54.7592794465074
99.6932860778519
104.340589295047
-83.4813763270316
-191.55095843656
32.6393681765558
-17.0235716679637
126.671647697209
-75.5417250586242
-13.2514107872577
73.2546045026859
3.74351674310771
3.63495958712636
2.94935763743078
-34.4080108167383
85.5626332366229
129.497547250407
70.6664513769347
71.7967916095436
-157.091387701948
-35.4762344543508
91.8754510066518
-70.760639440327
98.1452134372731
104.967449487568
-81.6323010627425
-53.1199729493513
16.1762809785063
97.0341889838266
12.3422096795845
0.0969397516956199
-52.6253549998356
-165.996830517774
-32.2156092473666
48.8213900457214
-74.3022264485204
280.828242592956
-144.709474928104
-15.0724822065431
45.3229730756595
5.45583324751759
48.5245215229444
31.3882820011682
-40.3586290327979
32.1090771503064
-117.70325217628
-33.6867827264628
-32.8047340425899
51.2591636096411
-21.5576860138068
77.3334249302211
-8.93350500640201
119.605439440607
25.7400381139552
0.533994356160612
-5.83705297968497
-109.654421504253
38.0081659286747
-82.1335586439145
-95.2093563433055
-22.7988948703492
-6.37012814862396
-253.969319153132
-24.6718593545998
-294.443277120842
37.1667718918781
-49.9464035503336
-24.6205394763334
-78.8919641572395
22.9623964280863
81.8592983105448
131.839367753679
9.3120998730756
-22.8119947832091
-58.7747926475925
-56.0402367722546
-49.0135775532274


Parameters (Session):
par1 = 12 ;
Parameters (R input):
par1 = FALSE ; par2 = 1 ; par3 = 1 ; par4 = 1 ; par5 = 12 ; par6 = 3 ; par7 = 1 ; par8 = 1 ; par9 = 1 ;
R code (references can be found in the software module):
par9 <- '1'
par8 <- '0'
par7 <- '1'
par6 <- '3'
par5 <- '12'
par4 <- '1'
par3 <- '1'
par2 <- '1'
par1 <- 'FALSE'
library(lattice)
if (par1 == 'TRUE') par1 <- TRUE
if (par1 == 'FALSE') par1 <- FALSE
par2 <- as.numeric(par2) #Box-Cox lambda transformation parameter
par3 <- as.numeric(par3) #degree of non-seasonal differencing
par4 <- as.numeric(par4) #degree of seasonal differencing
par5 <- as.numeric(par5) #seasonal period
par6 <- as.numeric(par6) #degree (p) of the non-seasonal AR(p) polynomial
par7 <- as.numeric(par7) #degree (q) of the non-seasonal MA(q) polynomial
par8 <- as.numeric(par8) #degree (P) of the seasonal AR(P) polynomial
par9 <- as.numeric(par9) #degree (Q) of the seasonal MA(Q) polynomial
armaGR <- function(arima.out, names, n){
try1 <- arima.out$coef
try2 <- sqrt(diag(arima.out$var.coef))
try.data.frame <- data.frame(matrix(NA,ncol=4,nrow=length(names)))
dimnames(try.data.frame) <- list(names,c('coef','std','tstat','pv'))
try.data.frame[,1] <- try1
for(i in 1:length(try2)) try.data.frame[which(rownames(try.data.frame)==names(try2)[i]),2] <- try2[i]
try.data.frame[,3] <- try.data.frame[,1] / try.data.frame[,2]
try.data.frame[,4] <- round((1-pt(abs(try.data.frame[,3]),df=n-(length(try2)+1)))*2,5)
vector <- rep(NA,length(names))
vector[is.na(try.data.frame[,4])] <- 0
maxi <- which.max(try.data.frame[,4])
continue <- max(try.data.frame[,4],na.rm=TRUE) > .05
vector[maxi] <- 0
list(summary=try.data.frame,next.vector=vector,continue=continue)
}
arimaSelect <- function(series, order=c(13,0,0), seasonal=list(order=c(2,0,0),period=12), include.mean=F){
nrc <- order[1]+order[3]+seasonal$order[1]+seasonal$order[3]
coeff <- matrix(NA, nrow=nrc*2, ncol=nrc)
pval <- matrix(NA, nrow=nrc*2, ncol=nrc)
mylist <- rep(list(NULL), nrc)
names <- NULL
if(order[1] > 0) names <- paste('ar',1:order[1],sep='')
if(order[3] > 0) names <- c( names , paste('ma',1:order[3],sep='') )
if(seasonal$order[1] > 0) names <- c(names, paste('sar',1:seasonal$order[1],sep=''))
if(seasonal$order[3] > 0) names <- c(names, paste('sma',1:seasonal$order[3],sep=''))
arima.out <- arima(series, order=order, seasonal=seasonal, include.mean=include.mean, method='ML')
mylist[[1]] <- arima.out
last.arma <- armaGR(arima.out, names, length(series))
mystop <- FALSE
i <- 1
coeff[i,] <- last.arma[[1]][,1]
pval [i,] <- last.arma[[1]][,4]
i <- 2
aic <- arima.out$aic
while(!mystop){
mylist[[i]] <- arima.out
arima.out <- arima(series, order=order, seasonal=seasonal, include.mean=include.mean, method='ML', fixed=last.arma$next.vector)
aic <- c(aic, arima.out$aic)
last.arma <- armaGR(arima.out, names, length(series))
mystop <- !last.arma$continue
coeff[i,] <- last.arma[[1]][,1]
pval [i,] <- last.arma[[1]][,4]
i <- i+1
}
list(coeff, pval, mylist, aic=aic)
}
arimaSelectplot <- function(arimaSelect.out,noms,choix){
noms <- names(arimaSelect.out[[3]][[1]]$coef)
coeff <- arimaSelect.out[[1]]
k <- min(which(is.na(coeff[,1])))-1
coeff <- coeff[1:k,]
pval <- arimaSelect.out[[2]][1:k,]
aic <- arimaSelect.out$aic[1:k]
coeff[coeff==0] <- NA
n <- ncol(coeff)
if(missing(choix)) choix <- k
layout(matrix(c(1,1,1,2,
3,3,3,2,
3,3,3,4,
5,6,7,7),nr=4),
widths=c(10,35,45,15),
heights=c(30,30,15,15))
couleurs <- rainbow(75)[1:50]#(50)
ticks <- pretty(coeff)
par(mar=c(1,1,3,1))
plot(aic,k:1-.5,type='o',pch=21,bg='blue',cex=2,axes=F,lty=2,xpd=NA)
points(aic[choix],k-choix+.5,pch=21,cex=4,bg=2,xpd=NA)
title('aic',line=2)
par(mar=c(3,0,0,0))
plot(0,axes=F,xlab='',ylab='',xlim=range(ticks),ylim=c(.1,1))
rect(xleft = min(ticks) + (0:49)/50*(max(ticks)-min(ticks)),
xright = min(ticks) + (1:50)/50*(max(ticks)-min(ticks)),
ytop = rep(1,50),
ybottom= rep(0,50),col=couleurs,border=NA)
axis(1,ticks)
rect(xleft=min(ticks),xright=max(ticks),ytop=1,ybottom=0)
text(mean(coeff,na.rm=T),.5,'coefficients',cex=2,font=2)
par(mar=c(1,1,3,1))
image(1:n,1:k,t(coeff[k:1,]),axes=F,col=couleurs,zlim=range(ticks))
for(i in 1:n) for(j in 1:k) if(!is.na(coeff[j,i])) {
if(pval[j,i]<.01) symb = 'green'
else if( (pval[j,i]<.05) & (pval[j,i]>=.01)) symb = 'orange'
else if( (pval[j,i]<.1) & (pval[j,i]>=.05)) symb = 'red'
else symb = 'black'
polygon(c(i+.5 ,i+.2 ,i+.5 ,i+.5),
c(k-j+0.5,k-j+0.5,k-j+0.8,k-j+0.5),
col=symb)
if(j==choix) {
rect(xleft=i-.5,
xright=i+.5,
ybottom=k-j+1.5,
ytop=k-j+.5,
lwd=4)
text(i,
k-j+1,
round(coeff[j,i],2),
cex=1.2,
font=2)
}
else{
rect(xleft=i-.5,xright=i+.5,ybottom=k-j+1.5,ytop=k-j+.5)
text(i,k-j+1,round(coeff[j,i],2),cex=1.2,font=1)
}
}
axis(3,1:n,noms)
par(mar=c(0.5,0,0,0.5))
plot(0,axes=F,xlab='',ylab='',type='n',xlim=c(0,8),ylim=c(-.2,.8))
cols <- c('green','orange','red','black')
niv <- c('0','0.01','0.05','0.1')
for(i in 0:3){
polygon(c(1+2*i ,1+2*i ,1+2*i-.5 ,1+2*i),
c(.4 ,.7 , .4 , .4),
col=cols[i+1])
text(2*i,0.5,niv[i+1],cex=1.5)
}
text(8,.5,1,cex=1.5)
text(4,0,'p-value',cex=2)
box()
residus <- arimaSelect.out[[3]][[choix]]$res
par(mar=c(1,2,4,1))
acf(residus,main='')
title('acf',line=.5)
par(mar=c(1,2,4,1))
pacf(residus,main='')
title('pacf',line=.5)
par(mar=c(2,2,4,1))
qqnorm(residus,main='')
title('qq-norm',line=.5)
qqline(residus)
residus
}
if (par2 == 0) x <- log(x)
if (par2 != 0) x <- x^par2
(selection <- arimaSelect(x, order=c(par6,par3,par7), seasonal=list(order=c(par8,par4,par9), period=par5)))
bitmap(file='test1.png')
resid <- arimaSelectplot(selection)
dev.off()
resid
bitmap(file='test2.png')
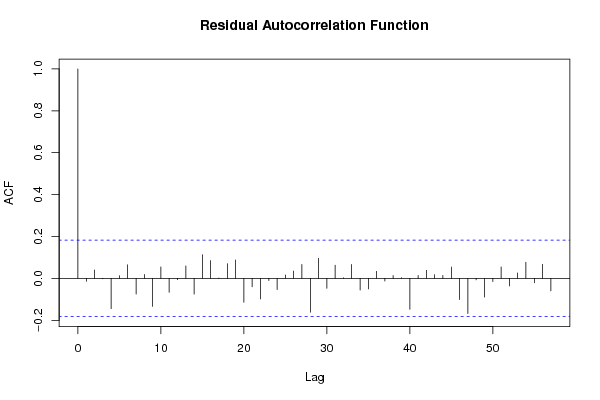
acf(resid,length(resid)/2, main='Residual Autocorrelation Function')
dev.off()
bitmap(file='test3.png')
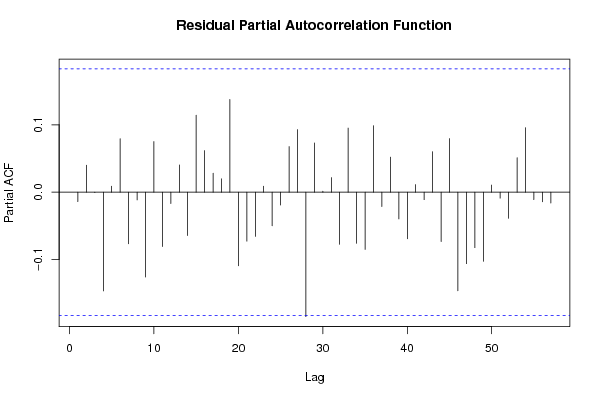
pacf(resid,length(resid)/2, main='Residual Partial Autocorrelation Function')
dev.off()
bitmap(file='test4.png')
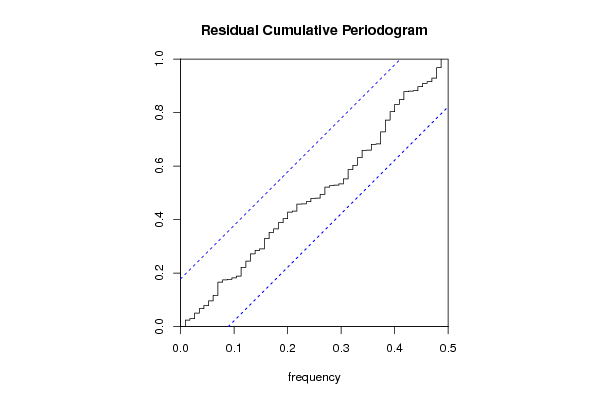
cpgram(resid, main='Residual Cumulative Periodogram')
dev.off()
bitmap(file='test5.png')
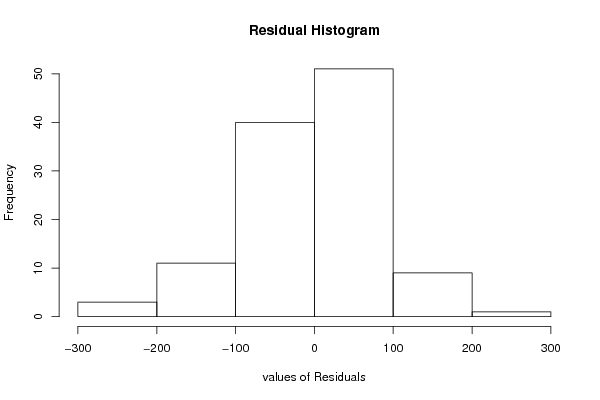
hist(resid, main='Residual Histogram', xlab='values of Residuals')
dev.off()
bitmap(file='test6.png')
densityplot(~resid,col='black',main='Residual Density Plot', xlab='values of Residuals')
dev.off()
bitmap(file='test7.png')
qqnorm(resid, main='Residual Normal Q-Q Plot')
qqline(resid)
dev.off()
ncols <- length(selection[[1]][1,])
nrows <- length(selection[[2]][,1])-1
load(file='createtable')
a<-table.start()
a<-table.row.start(a)
a<-table.element(a,'ARIMA Parameter Estimation and Backward Selection', ncols+1,TRUE)
a<-table.row.end(a)
a<-table.row.start(a)
a<-table.element(a,'Iteration', header=TRUE)
for (i in 1:ncols) {
a<-table.element(a,names(selection[[3]][[1]]$coef)[i],header=TRUE)
}
a<-table.row.end(a)
for (j in 1:nrows) {
a<-table.row.start(a)
mydum <- 'Estimates ('
mydum <- paste(mydum,j)
mydum <- paste(mydum,')')
a<-table.element(a,mydum, header=TRUE)
for (i in 1:ncols) {
a<-table.element(a,round(selection[[1]][j,i],4))
}
a<-table.row.end(a)
a<-table.row.start(a)
a<-table.element(a,'(p-val)', header=TRUE)
for (i in 1:ncols) {
mydum <- '('
mydum <- paste(mydum,round(selection[[2]][j,i],4),sep='')
mydum <- paste(mydum,')')
a<-table.element(a,mydum)
}
a<-table.row.end(a)
}
a<-table.end(a)
table.save(a,file='mytable.tab')
a<-table.start()
a<-table.row.start(a)
a<-table.element(a,'Estimated ARIMA Residuals', 1,TRUE)
a<-table.row.end(a)
a<-table.row.start(a)
a<-table.element(a,'Value', 1,TRUE)
a<-table.row.end(a)
for (i in (par4*par5+par3):length(resid)) {
a<-table.row.start(a)
a<-table.element(a,resid[i])
a<-table.row.end(a)
}
a<-table.end(a)
table.save(a,file='mytable1.tab')