Free Statistics

of Irreproducible Research!

Author's title

Author*The author of this computation has been verified*
R Software Modulerwasp_autocorrelation.wasp
Title produced by software(Partial) Autocorrelation Function
Date of computationMon, 19 Dec 2016 21:06:09 +0100
Cite this page as followsStatistical Computations at FreeStatistics.org, Office for Research Development and Education, URL https://freestatistics.org/blog/index.php?v=date/2016/Dec/19/t1482177998y3os3hmxlbhvy31.htm/, Retrieved Fri, 17 May 2024 14:55:18 +0000
Statistical Computations at FreeStatistics.org, Office for Research Development and Education, URL https://freestatistics.org/blog/index.php?pk=301477, Retrieved Fri, 17 May 2024 14:55:18 +0000
QR Codes:

Original text written by user:
IsPrivate?No (this computation is public)
User-defined keywords
Estimated Impact79
Family? (F = Feedback message, R = changed R code, M = changed R Module, P = changed Parameters, D = changed Data)
-       [(Partial) Autocorrelation Function] [autocorr 3] [2016-12-19 20:06:09] [afe7f6443461a2cd6ee0b843643e84a9] [Current]
Feedback Forum

Post a new message
Dataseries X:
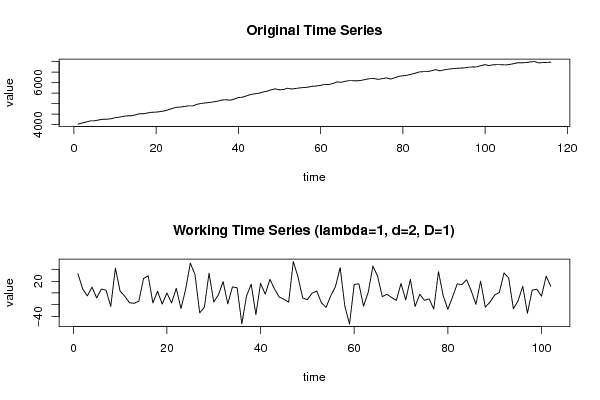
4028.8
4076.6
4125.8
4177.2
4183
4222.6
4255.8
4260.8
4279.2
4328.8
4356.6
4393
4419.4
4426.2
4467.2
4517.4
4517
4560.4
4589
4596
4621.2
4654.6
4708.6
4774.4
4824.8
4839
4869.8
4895.8
4895.8
4968.8
5010
5032.4
5054
5083.8
5117.4
5170.8
5182.2
5163.6
5212.6
5288
5303.4
5367.6
5433.8
5465.8
5493.8
5549.4
5590.2
5661.2
5699
5654.2
5671.8
5730.8
5693
5720.4
5747.8
5764.2
5783
5822.4
5836.2
5864.6
5913.4
5906.8
5954
6031.2
6011.2
6059.8
6091.6
6088
6082.2
6108
6151.4
6187
6190
6152.2
6183.8
6222.8
6165.8
6223.4
6292.8
6320.6
6344
6391.2
6443.4
6504
6520.2
6518.8
6563.8
6614
6555.6
6601.8
6632.4
6657.8
6674.4
6687
6697.6
6732
6736.4
6745.8
6805.2
6850.4
6807.2
6844.6
6850.8
6848.2
6837.8
6857.6
6900.8
6940.8
6937.4
6950.4
6978.8
6997.8
6934.8
6946.8
6956.2
6968.2


Summary of computational transaction
Raw Input view raw input (R code)
Raw Outputview raw output of R engine
Computing time1 seconds
R ServerBig Analytics Cloud Computing Center

\begin{tabular}{lllllllll}
\hline
Summary of computational transaction \tabularnewline
Raw Input view raw input (R code)  \tabularnewline
Raw Outputview raw output of R engine  \tabularnewline
Computing time1 seconds \tabularnewline
R ServerBig Analytics Cloud Computing Center \tabularnewline
\hline
\end{tabular}
%Source: https://freestatistics.org/blog/index.php?pk=301477&T=0

[TABLE]
[ROW]
Summary of computational transaction[/C][/ROW] [ROW]Raw Input[/C] view raw input (R code) [/C][/ROW] [ROW]Raw Output[/C]view raw output of R engine [/C][/ROW] [ROW]Computing time[/C]1 seconds[/C][/ROW] [ROW]R Server[/C]Big Analytics Cloud Computing Center[/C][/ROW] [/TABLE] Source: https://freestatistics.org/blog/index.php?pk=301477&T=0

Globally Unique Identifier (entire table): ba.freestatistics.org/blog/index.php?pk=301477&T=0

As an alternative you can also use a QR Code:  

The GUIDs for individual cells are displayed in the table below:

Summary of computational transaction
Raw Input view raw input (R code)
Raw Outputview raw output of R engine
Computing time1 seconds
R ServerBig Analytics Cloud Computing Center


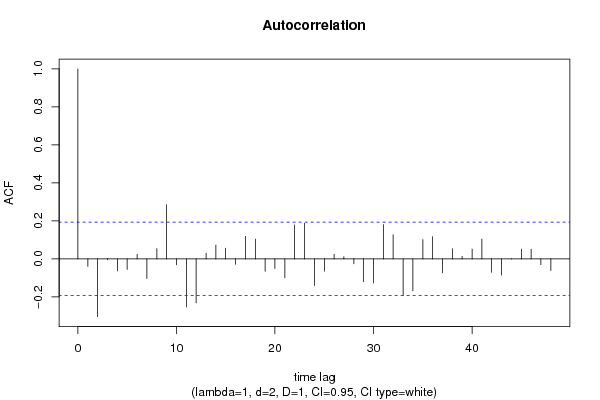
Autocorrelation Function
Time lag kACF(k)T-STATP-value
1-0.039707-0.4010.34462
2-0.304335-3.07360.001356
3-0.005057-0.05110.479683
4-0.063344-0.63970.261886
5-0.055572-0.56130.287928
60.0245230.24770.402444
7-0.103716-1.04750.148677
80.0534730.54010.295169
90.2852292.88070.002419
10-0.03129-0.3160.376321
11-0.253336-2.55860.00599
12-0.231514-2.33820.010665
130.0297450.30040.382239
140.0725030.73220.232849
150.0557660.56320.287265
16-0.028374-0.28660.387513
170.1186381.19820.116811
180.1038241.04860.148427
19-0.065356-0.66010.255351
20-0.050351-0.50850.306094
21-0.099099-1.00080.159635
220.178221.79990.037414
230.1868761.88740.030978
24-0.140197-1.41590.079923
25-0.064776-0.65420.257226
260.0238590.2410.405034
270.0110810.11190.455556
28-0.025452-0.25710.398828
29-0.120931-1.22130.112385
30-0.12691-1.28170.101422
310.1804731.82270.03564
320.1270731.28340.101135
33-0.19189-1.9380.027694
34-0.168336-1.70010.046079
350.101361.02370.154204
360.1160591.17210.121937
37-0.073194-0.73920.230735
380.0531220.53650.296389
390.0131880.13320.447151
400.0514630.51980.302181
410.1039051.04940.14824
42-0.07038-0.71080.239413
43-0.085702-0.86560.194384
440.0010230.01030.495888
450.0511130.51620.30341
460.0510440.51550.303653
47-0.030306-0.30610.380086
48-0.06178-0.62390.267029

\begin{tabular}{lllllllll}
\hline
Autocorrelation Function \tabularnewline
Time lag k & ACF(k) & T-STAT & P-value \tabularnewline
1 & -0.039707 & -0.401 & 0.34462 \tabularnewline
2 & -0.304335 & -3.0736 & 0.001356 \tabularnewline
3 & -0.005057 & -0.0511 & 0.479683 \tabularnewline
4 & -0.063344 & -0.6397 & 0.261886 \tabularnewline
5 & -0.055572 & -0.5613 & 0.287928 \tabularnewline
6 & 0.024523 & 0.2477 & 0.402444 \tabularnewline
7 & -0.103716 & -1.0475 & 0.148677 \tabularnewline
8 & 0.053473 & 0.5401 & 0.295169 \tabularnewline
9 & 0.285229 & 2.8807 & 0.002419 \tabularnewline
10 & -0.03129 & -0.316 & 0.376321 \tabularnewline
11 & -0.253336 & -2.5586 & 0.00599 \tabularnewline
12 & -0.231514 & -2.3382 & 0.010665 \tabularnewline
13 & 0.029745 & 0.3004 & 0.382239 \tabularnewline
14 & 0.072503 & 0.7322 & 0.232849 \tabularnewline
15 & 0.055766 & 0.5632 & 0.287265 \tabularnewline
16 & -0.028374 & -0.2866 & 0.387513 \tabularnewline
17 & 0.118638 & 1.1982 & 0.116811 \tabularnewline
18 & 0.103824 & 1.0486 & 0.148427 \tabularnewline
19 & -0.065356 & -0.6601 & 0.255351 \tabularnewline
20 & -0.050351 & -0.5085 & 0.306094 \tabularnewline
21 & -0.099099 & -1.0008 & 0.159635 \tabularnewline
22 & 0.17822 & 1.7999 & 0.037414 \tabularnewline
23 & 0.186876 & 1.8874 & 0.030978 \tabularnewline
24 & -0.140197 & -1.4159 & 0.079923 \tabularnewline
25 & -0.064776 & -0.6542 & 0.257226 \tabularnewline
26 & 0.023859 & 0.241 & 0.405034 \tabularnewline
27 & 0.011081 & 0.1119 & 0.455556 \tabularnewline
28 & -0.025452 & -0.2571 & 0.398828 \tabularnewline
29 & -0.120931 & -1.2213 & 0.112385 \tabularnewline
30 & -0.12691 & -1.2817 & 0.101422 \tabularnewline
31 & 0.180473 & 1.8227 & 0.03564 \tabularnewline
32 & 0.127073 & 1.2834 & 0.101135 \tabularnewline
33 & -0.19189 & -1.938 & 0.027694 \tabularnewline
34 & -0.168336 & -1.7001 & 0.046079 \tabularnewline
35 & 0.10136 & 1.0237 & 0.154204 \tabularnewline
36 & 0.116059 & 1.1721 & 0.121937 \tabularnewline
37 & -0.073194 & -0.7392 & 0.230735 \tabularnewline
38 & 0.053122 & 0.5365 & 0.296389 \tabularnewline
39 & 0.013188 & 0.1332 & 0.447151 \tabularnewline
40 & 0.051463 & 0.5198 & 0.302181 \tabularnewline
41 & 0.103905 & 1.0494 & 0.14824 \tabularnewline
42 & -0.07038 & -0.7108 & 0.239413 \tabularnewline
43 & -0.085702 & -0.8656 & 0.194384 \tabularnewline
44 & 0.001023 & 0.0103 & 0.495888 \tabularnewline
45 & 0.051113 & 0.5162 & 0.30341 \tabularnewline
46 & 0.051044 & 0.5155 & 0.303653 \tabularnewline
47 & -0.030306 & -0.3061 & 0.380086 \tabularnewline
48 & -0.06178 & -0.6239 & 0.267029 \tabularnewline
\hline
\end{tabular}
%Source: https://freestatistics.org/blog/index.php?pk=301477&T=1

[TABLE]
[ROW][C]Autocorrelation Function[/C][/ROW]
[ROW][C]Time lag k[/C][C]ACF(k)[/C][C]T-STAT[/C][C]P-value[/C][/ROW]
[ROW][C]1[/C][C]-0.039707[/C][C]-0.401[/C][C]0.34462[/C][/ROW]
[ROW][C]2[/C][C]-0.304335[/C][C]-3.0736[/C][C]0.001356[/C][/ROW]
[ROW][C]3[/C][C]-0.005057[/C][C]-0.0511[/C][C]0.479683[/C][/ROW]
[ROW][C]4[/C][C]-0.063344[/C][C]-0.6397[/C][C]0.261886[/C][/ROW]
[ROW][C]5[/C][C]-0.055572[/C][C]-0.5613[/C][C]0.287928[/C][/ROW]
[ROW][C]6[/C][C]0.024523[/C][C]0.2477[/C][C]0.402444[/C][/ROW]
[ROW][C]7[/C][C]-0.103716[/C][C]-1.0475[/C][C]0.148677[/C][/ROW]
[ROW][C]8[/C][C]0.053473[/C][C]0.5401[/C][C]0.295169[/C][/ROW]
[ROW][C]9[/C][C]0.285229[/C][C]2.8807[/C][C]0.002419[/C][/ROW]
[ROW][C]10[/C][C]-0.03129[/C][C]-0.316[/C][C]0.376321[/C][/ROW]
[ROW][C]11[/C][C]-0.253336[/C][C]-2.5586[/C][C]0.00599[/C][/ROW]
[ROW][C]12[/C][C]-0.231514[/C][C]-2.3382[/C][C]0.010665[/C][/ROW]
[ROW][C]13[/C][C]0.029745[/C][C]0.3004[/C][C]0.382239[/C][/ROW]
[ROW][C]14[/C][C]0.072503[/C][C]0.7322[/C][C]0.232849[/C][/ROW]
[ROW][C]15[/C][C]0.055766[/C][C]0.5632[/C][C]0.287265[/C][/ROW]
[ROW][C]16[/C][C]-0.028374[/C][C]-0.2866[/C][C]0.387513[/C][/ROW]
[ROW][C]17[/C][C]0.118638[/C][C]1.1982[/C][C]0.116811[/C][/ROW]
[ROW][C]18[/C][C]0.103824[/C][C]1.0486[/C][C]0.148427[/C][/ROW]
[ROW][C]19[/C][C]-0.065356[/C][C]-0.6601[/C][C]0.255351[/C][/ROW]
[ROW][C]20[/C][C]-0.050351[/C][C]-0.5085[/C][C]0.306094[/C][/ROW]
[ROW][C]21[/C][C]-0.099099[/C][C]-1.0008[/C][C]0.159635[/C][/ROW]
[ROW][C]22[/C][C]0.17822[/C][C]1.7999[/C][C]0.037414[/C][/ROW]
[ROW][C]23[/C][C]0.186876[/C][C]1.8874[/C][C]0.030978[/C][/ROW]
[ROW][C]24[/C][C]-0.140197[/C][C]-1.4159[/C][C]0.079923[/C][/ROW]
[ROW][C]25[/C][C]-0.064776[/C][C]-0.6542[/C][C]0.257226[/C][/ROW]
[ROW][C]26[/C][C]0.023859[/C][C]0.241[/C][C]0.405034[/C][/ROW]
[ROW][C]27[/C][C]0.011081[/C][C]0.1119[/C][C]0.455556[/C][/ROW]
[ROW][C]28[/C][C]-0.025452[/C][C]-0.2571[/C][C]0.398828[/C][/ROW]
[ROW][C]29[/C][C]-0.120931[/C][C]-1.2213[/C][C]0.112385[/C][/ROW]
[ROW][C]30[/C][C]-0.12691[/C][C]-1.2817[/C][C]0.101422[/C][/ROW]
[ROW][C]31[/C][C]0.180473[/C][C]1.8227[/C][C]0.03564[/C][/ROW]
[ROW][C]32[/C][C]0.127073[/C][C]1.2834[/C][C]0.101135[/C][/ROW]
[ROW][C]33[/C][C]-0.19189[/C][C]-1.938[/C][C]0.027694[/C][/ROW]
[ROW][C]34[/C][C]-0.168336[/C][C]-1.7001[/C][C]0.046079[/C][/ROW]
[ROW][C]35[/C][C]0.10136[/C][C]1.0237[/C][C]0.154204[/C][/ROW]
[ROW][C]36[/C][C]0.116059[/C][C]1.1721[/C][C]0.121937[/C][/ROW]
[ROW][C]37[/C][C]-0.073194[/C][C]-0.7392[/C][C]0.230735[/C][/ROW]
[ROW][C]38[/C][C]0.053122[/C][C]0.5365[/C][C]0.296389[/C][/ROW]
[ROW][C]39[/C][C]0.013188[/C][C]0.1332[/C][C]0.447151[/C][/ROW]
[ROW][C]40[/C][C]0.051463[/C][C]0.5198[/C][C]0.302181[/C][/ROW]
[ROW][C]41[/C][C]0.103905[/C][C]1.0494[/C][C]0.14824[/C][/ROW]
[ROW][C]42[/C][C]-0.07038[/C][C]-0.7108[/C][C]0.239413[/C][/ROW]
[ROW][C]43[/C][C]-0.085702[/C][C]-0.8656[/C][C]0.194384[/C][/ROW]
[ROW][C]44[/C][C]0.001023[/C][C]0.0103[/C][C]0.495888[/C][/ROW]
[ROW][C]45[/C][C]0.051113[/C][C]0.5162[/C][C]0.30341[/C][/ROW]
[ROW][C]46[/C][C]0.051044[/C][C]0.5155[/C][C]0.303653[/C][/ROW]
[ROW][C]47[/C][C]-0.030306[/C][C]-0.3061[/C][C]0.380086[/C][/ROW]
[ROW][C]48[/C][C]-0.06178[/C][C]-0.6239[/C][C]0.267029[/C][/ROW]
[/TABLE]
Source: https://freestatistics.org/blog/index.php?pk=301477&T=1

Globally Unique Identifier (entire table): ba.freestatistics.org/blog/index.php?pk=301477&T=1

As an alternative you can also use a QR Code:  

The GUIDs for individual cells are displayed in the table below:

Autocorrelation Function
Time lag kACF(k)T-STATP-value
1-0.039707-0.4010.34462
2-0.304335-3.07360.001356
3-0.005057-0.05110.479683
4-0.063344-0.63970.261886
5-0.055572-0.56130.287928
60.0245230.24770.402444
7-0.103716-1.04750.148677
80.0534730.54010.295169
90.2852292.88070.002419
10-0.03129-0.3160.376321
11-0.253336-2.55860.00599
12-0.231514-2.33820.010665
130.0297450.30040.382239
140.0725030.73220.232849
150.0557660.56320.287265
16-0.028374-0.28660.387513
170.1186381.19820.116811
180.1038241.04860.148427
19-0.065356-0.66010.255351
20-0.050351-0.50850.306094
21-0.099099-1.00080.159635
220.178221.79990.037414
230.1868761.88740.030978
24-0.140197-1.41590.079923
25-0.064776-0.65420.257226
260.0238590.2410.405034
270.0110810.11190.455556
28-0.025452-0.25710.398828
29-0.120931-1.22130.112385
30-0.12691-1.28170.101422
310.1804731.82270.03564
320.1270731.28340.101135
33-0.19189-1.9380.027694
34-0.168336-1.70010.046079
350.101361.02370.154204
360.1160591.17210.121937
37-0.073194-0.73920.230735
380.0531220.53650.296389
390.0131880.13320.447151
400.0514630.51980.302181
410.1039051.04940.14824
42-0.07038-0.71080.239413
43-0.085702-0.86560.194384
440.0010230.01030.495888
450.0511130.51620.30341
460.0510440.51550.303653
47-0.030306-0.30610.380086
48-0.06178-0.62390.267029


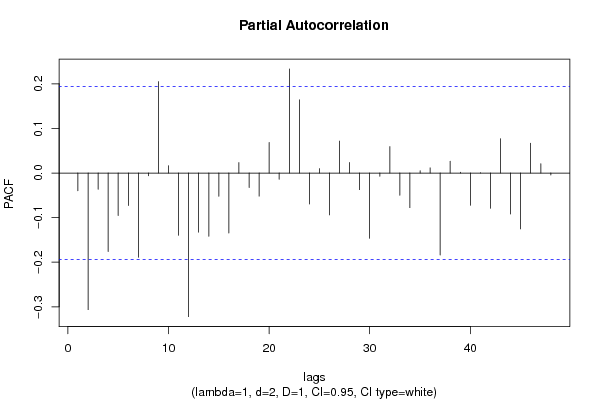
Partial Autocorrelation Function
Time lag kPACF(k)T-STATP-value
1-0.039707-0.4010.34462
2-0.306395-3.09440.001273
3-0.036488-0.36850.356628
4-0.175913-1.77660.039305
5-0.09511-0.96060.169522
6-0.072909-0.73630.231605
7-0.188827-1.90710.029663
8-0.006166-0.06230.475233
90.2050412.07080.020451
100.0162970.16460.434797
11-0.139445-1.40830.081038
12-0.322072-3.25280.000775
13-0.132497-1.33820.09191
14-0.141805-1.43220.077578
15-0.052151-0.52670.299772
16-0.134461-1.3580.088731
170.0233170.23550.40715
18-0.032373-0.3270.372187
19-0.051756-0.52270.301153
200.0683160.690.245893
21-0.013819-0.13960.444641
220.2334142.35740.010157
230.1640281.65660.050337
24-0.069457-0.70150.242301
250.0098830.09980.460344
26-0.093794-0.94730.172869
270.0716520.72360.235469
280.0237390.23980.405501
29-0.037275-0.37650.353677
30-0.146226-1.47680.071404
31-0.007101-0.07170.471484
320.0591760.59770.275699
33-0.049815-0.50310.307988
34-0.077669-0.78440.217308
350.0051310.05180.479386
360.0116680.11780.453213
37-0.184012-1.85840.032996
380.0264490.26710.394958
390.0016580.01670.493336
40-0.072419-0.73140.233107
410.0005540.00560.497772
42-0.078894-0.79680.213712
430.0768890.77650.219613
44-0.092067-0.92980.177327
45-0.125275-1.26520.104339
460.0666280.67290.251263
470.0207490.20960.417216
48-0.004412-0.04460.482271

\begin{tabular}{lllllllll}
\hline
Partial Autocorrelation Function \tabularnewline
Time lag k & PACF(k) & T-STAT & P-value \tabularnewline
1 & -0.039707 & -0.401 & 0.34462 \tabularnewline
2 & -0.306395 & -3.0944 & 0.001273 \tabularnewline
3 & -0.036488 & -0.3685 & 0.356628 \tabularnewline
4 & -0.175913 & -1.7766 & 0.039305 \tabularnewline
5 & -0.09511 & -0.9606 & 0.169522 \tabularnewline
6 & -0.072909 & -0.7363 & 0.231605 \tabularnewline
7 & -0.188827 & -1.9071 & 0.029663 \tabularnewline
8 & -0.006166 & -0.0623 & 0.475233 \tabularnewline
9 & 0.205041 & 2.0708 & 0.020451 \tabularnewline
10 & 0.016297 & 0.1646 & 0.434797 \tabularnewline
11 & -0.139445 & -1.4083 & 0.081038 \tabularnewline
12 & -0.322072 & -3.2528 & 0.000775 \tabularnewline
13 & -0.132497 & -1.3382 & 0.09191 \tabularnewline
14 & -0.141805 & -1.4322 & 0.077578 \tabularnewline
15 & -0.052151 & -0.5267 & 0.299772 \tabularnewline
16 & -0.134461 & -1.358 & 0.088731 \tabularnewline
17 & 0.023317 & 0.2355 & 0.40715 \tabularnewline
18 & -0.032373 & -0.327 & 0.372187 \tabularnewline
19 & -0.051756 & -0.5227 & 0.301153 \tabularnewline
20 & 0.068316 & 0.69 & 0.245893 \tabularnewline
21 & -0.013819 & -0.1396 & 0.444641 \tabularnewline
22 & 0.233414 & 2.3574 & 0.010157 \tabularnewline
23 & 0.164028 & 1.6566 & 0.050337 \tabularnewline
24 & -0.069457 & -0.7015 & 0.242301 \tabularnewline
25 & 0.009883 & 0.0998 & 0.460344 \tabularnewline
26 & -0.093794 & -0.9473 & 0.172869 \tabularnewline
27 & 0.071652 & 0.7236 & 0.235469 \tabularnewline
28 & 0.023739 & 0.2398 & 0.405501 \tabularnewline
29 & -0.037275 & -0.3765 & 0.353677 \tabularnewline
30 & -0.146226 & -1.4768 & 0.071404 \tabularnewline
31 & -0.007101 & -0.0717 & 0.471484 \tabularnewline
32 & 0.059176 & 0.5977 & 0.275699 \tabularnewline
33 & -0.049815 & -0.5031 & 0.307988 \tabularnewline
34 & -0.077669 & -0.7844 & 0.217308 \tabularnewline
35 & 0.005131 & 0.0518 & 0.479386 \tabularnewline
36 & 0.011668 & 0.1178 & 0.453213 \tabularnewline
37 & -0.184012 & -1.8584 & 0.032996 \tabularnewline
38 & 0.026449 & 0.2671 & 0.394958 \tabularnewline
39 & 0.001658 & 0.0167 & 0.493336 \tabularnewline
40 & -0.072419 & -0.7314 & 0.233107 \tabularnewline
41 & 0.000554 & 0.0056 & 0.497772 \tabularnewline
42 & -0.078894 & -0.7968 & 0.213712 \tabularnewline
43 & 0.076889 & 0.7765 & 0.219613 \tabularnewline
44 & -0.092067 & -0.9298 & 0.177327 \tabularnewline
45 & -0.125275 & -1.2652 & 0.104339 \tabularnewline
46 & 0.066628 & 0.6729 & 0.251263 \tabularnewline
47 & 0.020749 & 0.2096 & 0.417216 \tabularnewline
48 & -0.004412 & -0.0446 & 0.482271 \tabularnewline
\hline
\end{tabular}
%Source: https://freestatistics.org/blog/index.php?pk=301477&T=2

[TABLE]
[ROW][C]Partial Autocorrelation Function[/C][/ROW]
[ROW][C]Time lag k[/C][C]PACF(k)[/C][C]T-STAT[/C][C]P-value[/C][/ROW]
[ROW][C]1[/C][C]-0.039707[/C][C]-0.401[/C][C]0.34462[/C][/ROW]
[ROW][C]2[/C][C]-0.306395[/C][C]-3.0944[/C][C]0.001273[/C][/ROW]
[ROW][C]3[/C][C]-0.036488[/C][C]-0.3685[/C][C]0.356628[/C][/ROW]
[ROW][C]4[/C][C]-0.175913[/C][C]-1.7766[/C][C]0.039305[/C][/ROW]
[ROW][C]5[/C][C]-0.09511[/C][C]-0.9606[/C][C]0.169522[/C][/ROW]
[ROW][C]6[/C][C]-0.072909[/C][C]-0.7363[/C][C]0.231605[/C][/ROW]
[ROW][C]7[/C][C]-0.188827[/C][C]-1.9071[/C][C]0.029663[/C][/ROW]
[ROW][C]8[/C][C]-0.006166[/C][C]-0.0623[/C][C]0.475233[/C][/ROW]
[ROW][C]9[/C][C]0.205041[/C][C]2.0708[/C][C]0.020451[/C][/ROW]
[ROW][C]10[/C][C]0.016297[/C][C]0.1646[/C][C]0.434797[/C][/ROW]
[ROW][C]11[/C][C]-0.139445[/C][C]-1.4083[/C][C]0.081038[/C][/ROW]
[ROW][C]12[/C][C]-0.322072[/C][C]-3.2528[/C][C]0.000775[/C][/ROW]
[ROW][C]13[/C][C]-0.132497[/C][C]-1.3382[/C][C]0.09191[/C][/ROW]
[ROW][C]14[/C][C]-0.141805[/C][C]-1.4322[/C][C]0.077578[/C][/ROW]
[ROW][C]15[/C][C]-0.052151[/C][C]-0.5267[/C][C]0.299772[/C][/ROW]
[ROW][C]16[/C][C]-0.134461[/C][C]-1.358[/C][C]0.088731[/C][/ROW]
[ROW][C]17[/C][C]0.023317[/C][C]0.2355[/C][C]0.40715[/C][/ROW]
[ROW][C]18[/C][C]-0.032373[/C][C]-0.327[/C][C]0.372187[/C][/ROW]
[ROW][C]19[/C][C]-0.051756[/C][C]-0.5227[/C][C]0.301153[/C][/ROW]
[ROW][C]20[/C][C]0.068316[/C][C]0.69[/C][C]0.245893[/C][/ROW]
[ROW][C]21[/C][C]-0.013819[/C][C]-0.1396[/C][C]0.444641[/C][/ROW]
[ROW][C]22[/C][C]0.233414[/C][C]2.3574[/C][C]0.010157[/C][/ROW]
[ROW][C]23[/C][C]0.164028[/C][C]1.6566[/C][C]0.050337[/C][/ROW]
[ROW][C]24[/C][C]-0.069457[/C][C]-0.7015[/C][C]0.242301[/C][/ROW]
[ROW][C]25[/C][C]0.009883[/C][C]0.0998[/C][C]0.460344[/C][/ROW]
[ROW][C]26[/C][C]-0.093794[/C][C]-0.9473[/C][C]0.172869[/C][/ROW]
[ROW][C]27[/C][C]0.071652[/C][C]0.7236[/C][C]0.235469[/C][/ROW]
[ROW][C]28[/C][C]0.023739[/C][C]0.2398[/C][C]0.405501[/C][/ROW]
[ROW][C]29[/C][C]-0.037275[/C][C]-0.3765[/C][C]0.353677[/C][/ROW]
[ROW][C]30[/C][C]-0.146226[/C][C]-1.4768[/C][C]0.071404[/C][/ROW]
[ROW][C]31[/C][C]-0.007101[/C][C]-0.0717[/C][C]0.471484[/C][/ROW]
[ROW][C]32[/C][C]0.059176[/C][C]0.5977[/C][C]0.275699[/C][/ROW]
[ROW][C]33[/C][C]-0.049815[/C][C]-0.5031[/C][C]0.307988[/C][/ROW]
[ROW][C]34[/C][C]-0.077669[/C][C]-0.7844[/C][C]0.217308[/C][/ROW]
[ROW][C]35[/C][C]0.005131[/C][C]0.0518[/C][C]0.479386[/C][/ROW]
[ROW][C]36[/C][C]0.011668[/C][C]0.1178[/C][C]0.453213[/C][/ROW]
[ROW][C]37[/C][C]-0.184012[/C][C]-1.8584[/C][C]0.032996[/C][/ROW]
[ROW][C]38[/C][C]0.026449[/C][C]0.2671[/C][C]0.394958[/C][/ROW]
[ROW][C]39[/C][C]0.001658[/C][C]0.0167[/C][C]0.493336[/C][/ROW]
[ROW][C]40[/C][C]-0.072419[/C][C]-0.7314[/C][C]0.233107[/C][/ROW]
[ROW][C]41[/C][C]0.000554[/C][C]0.0056[/C][C]0.497772[/C][/ROW]
[ROW][C]42[/C][C]-0.078894[/C][C]-0.7968[/C][C]0.213712[/C][/ROW]
[ROW][C]43[/C][C]0.076889[/C][C]0.7765[/C][C]0.219613[/C][/ROW]
[ROW][C]44[/C][C]-0.092067[/C][C]-0.9298[/C][C]0.177327[/C][/ROW]
[ROW][C]45[/C][C]-0.125275[/C][C]-1.2652[/C][C]0.104339[/C][/ROW]
[ROW][C]46[/C][C]0.066628[/C][C]0.6729[/C][C]0.251263[/C][/ROW]
[ROW][C]47[/C][C]0.020749[/C][C]0.2096[/C][C]0.417216[/C][/ROW]
[ROW][C]48[/C][C]-0.004412[/C][C]-0.0446[/C][C]0.482271[/C][/ROW]
[/TABLE]
Source: https://freestatistics.org/blog/index.php?pk=301477&T=2

Globally Unique Identifier (entire table): ba.freestatistics.org/blog/index.php?pk=301477&T=2

As an alternative you can also use a QR Code:  

The GUIDs for individual cells are displayed in the table below:

Partial Autocorrelation Function
Time lag kPACF(k)T-STATP-value
1-0.039707-0.4010.34462
2-0.306395-3.09440.001273
3-0.036488-0.36850.356628
4-0.175913-1.77660.039305
5-0.09511-0.96060.169522
6-0.072909-0.73630.231605
7-0.188827-1.90710.029663
8-0.006166-0.06230.475233
90.2050412.07080.020451
100.0162970.16460.434797
11-0.139445-1.40830.081038
12-0.322072-3.25280.000775
13-0.132497-1.33820.09191
14-0.141805-1.43220.077578
15-0.052151-0.52670.299772
16-0.134461-1.3580.088731
170.0233170.23550.40715
18-0.032373-0.3270.372187
19-0.051756-0.52270.301153
200.0683160.690.245893
21-0.013819-0.13960.444641
220.2334142.35740.010157
230.1640281.65660.050337
24-0.069457-0.70150.242301
250.0098830.09980.460344
26-0.093794-0.94730.172869
270.0716520.72360.235469
280.0237390.23980.405501
29-0.037275-0.37650.353677
30-0.146226-1.47680.071404
31-0.007101-0.07170.471484
320.0591760.59770.275699
33-0.049815-0.50310.307988
34-0.077669-0.78440.217308
350.0051310.05180.479386
360.0116680.11780.453213
37-0.184012-1.85840.032996
380.0264490.26710.394958
390.0016580.01670.493336
40-0.072419-0.73140.233107
410.0005540.00560.497772
42-0.078894-0.79680.213712
430.0768890.77650.219613
44-0.092067-0.92980.177327
45-0.125275-1.26520.104339
460.0666280.67290.251263
470.0207490.20960.417216
48-0.004412-0.04460.482271


Parameters (Session):
par1 = 48 ; par2 = 1 ; par3 = 2 ; par4 = 1 ; par5 = 12 ; par6 = White Noise ; par7 = 0.95 ;
Parameters (R input):
par1 = 48 ; par2 = 1 ; par3 = 2 ; par4 = 1 ; par5 = 12 ; par6 = White Noise ; par7 = 0.95 ; par8 = ;
R code (references can be found in the software module):
par8 <- ''
par7 <- '0.95'
par6 <- 'White Noise'
par5 <- '12'
par4 <- '1'
par3 <- '2'
par2 <- '2.0'
par1 <- '48'
if (par1 == 'Default') {
par1 = 10*log10(length(x))
} else {
par1 <- as.numeric(par1)
}
par2 <- as.numeric(par2)
par3 <- as.numeric(par3)
par4 <- as.numeric(par4)
par5 <- as.numeric(par5)
if (par6 == 'White Noise') par6 <- 'white' else par6 <- 'ma'
par7 <- as.numeric(par7)
if (par8 != '') par8 <- as.numeric(par8)
x <- na.omit(x)
ox <- x
if (par8 == '') {
if (par2 == 0) {
x <- log(x)
} else {
x <- (x ^ par2 - 1) / par2
}
} else {
x <- log(x,base=par8)
}
if (par3 > 0) x <- diff(x,lag=1,difference=par3)
if (par4 > 0) x <- diff(x,lag=par5,difference=par4)
bitmap(file='picts.png')
op <- par(mfrow=c(2,1))
plot(ox,type='l',main='Original Time Series',xlab='time',ylab='value')
if (par8=='') {
mytitle <- paste('Working Time Series (lambda=',par2,', d=',par3,', D=',par4,')',sep='')
mysub <- paste('(lambda=',par2,', d=',par3,', D=',par4,', CI=', par7, ', CI type=',par6,')',sep='')
} else {
mytitle <- paste('Working Time Series (base=',par8,', d=',par3,', D=',par4,')',sep='')
mysub <- paste('(base=',par8,', d=',par3,', D=',par4,', CI=', par7, ', CI type=',par6,')',sep='')
}
plot(x,type='l', main=mytitle,xlab='time',ylab='value')
par(op)
dev.off()
bitmap(file='pic1.png')
racf <- acf(x, par1, main='Autocorrelation', xlab='time lag', ylab='ACF', ci.type=par6, ci=par7, sub=mysub)
dev.off()
bitmap(file='pic2.png')
rpacf <- pacf(x,par1,main='Partial Autocorrelation',xlab='lags',ylab='PACF',sub=mysub)
dev.off()
(myacf <- c(racf$acf))
(mypacf <- c(rpacf$acf))
lengthx <- length(x)
sqrtn <- sqrt(lengthx)
load(file='createtable')
a<-table.start()
a<-table.row.start(a)
a<-table.element(a,'Autocorrelation Function',4,TRUE)
a<-table.row.end(a)
a<-table.row.start(a)
a<-table.element(a,'Time lag k',header=TRUE)
a<-table.element(a,'ACF(k)',header=TRUE)
a<-table.element(a,'T-STAT',header=TRUE)
a<-table.element(a,'P-value',header=TRUE)
a<-table.row.end(a)
for (i in 2:(par1+1)) {
a<-table.row.start(a)
a<-table.element(a,i-1,header=TRUE)
a<-table.element(a,round(myacf[i],6))
mytstat <- myacf[i]*sqrtn
a<-table.element(a,round(mytstat,4))
a<-table.element(a,round(1-pt(abs(mytstat),lengthx),6))
a<-table.row.end(a)
}
a<-table.end(a)
table.save(a,file='mytable.tab')
a<-table.start()
a<-table.row.start(a)
a<-table.element(a,'Partial Autocorrelation Function',4,TRUE)
a<-table.row.end(a)
a<-table.row.start(a)
a<-table.element(a,'Time lag k',header=TRUE)
a<-table.element(a,'PACF(k)',header=TRUE)
a<-table.element(a,'T-STAT',header=TRUE)
a<-table.element(a,'P-value',header=TRUE)
a<-table.row.end(a)
for (i in 1:par1) {
a<-table.row.start(a)
a<-table.element(a,i,header=TRUE)
a<-table.element(a,round(mypacf[i],6))
mytstat <- mypacf[i]*sqrtn
a<-table.element(a,round(mytstat,4))
a<-table.element(a,round(1-pt(abs(mytstat),lengthx),6))
a<-table.row.end(a)
}
a<-table.end(a)
table.save(a,file='mytable1.tab')