Free Statistics

of Irreproducible Research!

Author's title

Author*The author of this computation has been verified*
R Software Modulerwasp_smp.wasp
Title produced by softwareStandard Deviation-Mean Plot
Date of computationMon, 19 Dec 2016 19:47:07 +0100
Cite this page as followsStatistical Computations at FreeStatistics.org, Office for Research Development and Education, URL https://freestatistics.org/blog/index.php?v=date/2016/Dec/19/t1482173287g0hx9vnf7kk6gdj.htm/, Retrieved Fri, 17 May 2024 13:00:49 +0000
Statistical Computations at FreeStatistics.org, Office for Research Development and Education, URL https://freestatistics.org/blog/index.php?pk=301452, Retrieved Fri, 17 May 2024 13:00:49 +0000
QR Codes:

Original text written by user:
IsPrivate?No (this computation is public)
User-defined keywords
Estimated Impact74
Family? (F = Feedback message, R = changed R code, M = changed R Module, P = changed Parameters, D = changed Data)
-       [Standard Deviation-Mean Plot] [N2141 - Standard ...] [2016-12-19 18:47:07] [f8e2c3c70b883e93ecb746821352be11] [Current]
Feedback Forum

Post a new message
Dataseries X:
4976
4994
5478
4712
4388
4210
3844
3850
3770
3584
3490
3060
3324
3406
4346
4076
4310
4148
3958
4296
4370
4476
4406
4076
4430
4534
5200
4960
5188
4958
4554
4310
3890
4214
3720
3606
4360
4262
4788
4780
4836
4492
4514
4770
4664
4906
4684
4320
4588
4372
4674
4794
4558
4260
3994
3394
3334
3412
3198
3196
3536
3272
3562
3900
3744
3886
3708
3700
3878
4152
3830
3864
3880
4230
4394
4076
4224
4026
3950
4086
4166
4270
4162
4030
4128
3958
4216
4096
4168
3948
3394
3660
3808
3684
3610
3598
3918
3764
3872
3710
4056
4010
3656
3884
3886
3880
3642
3272
3602
3198
3802
3402
3344
3508
3426
3394
3448
3554
3522
3472
3692
3690
3802
3814
3408
3650


Summary of computational transaction
Raw Input view raw input (R code)
Raw Outputview raw output of R engine
Computing time1 seconds
R ServerBig Analytics Cloud Computing Center

\begin{tabular}{lllllllll}
\hline
Summary of computational transaction \tabularnewline
Raw Input view raw input (R code)  \tabularnewline
Raw Outputview raw output of R engine  \tabularnewline
Computing time1 seconds \tabularnewline
R ServerBig Analytics Cloud Computing Center \tabularnewline
\hline
\end{tabular}
%Source: https://freestatistics.org/blog/index.php?pk=301452&T=0

[TABLE]
[ROW]
Summary of computational transaction[/C][/ROW] [ROW]Raw Input[/C] view raw input (R code) [/C][/ROW] [ROW]Raw Output[/C]view raw output of R engine [/C][/ROW] [ROW]Computing time[/C]1 seconds[/C][/ROW] [ROW]R Server[/C]Big Analytics Cloud Computing Center[/C][/ROW] [/TABLE] Source: https://freestatistics.org/blog/index.php?pk=301452&T=0

Globally Unique Identifier (entire table): ba.freestatistics.org/blog/index.php?pk=301452&T=0

As an alternative you can also use a QR Code:  

The GUIDs for individual cells are displayed in the table below:

Summary of computational transaction
Raw Input view raw input (R code)
Raw Outputview raw output of R engine
Computing time1 seconds
R ServerBig Analytics Cloud Computing Center


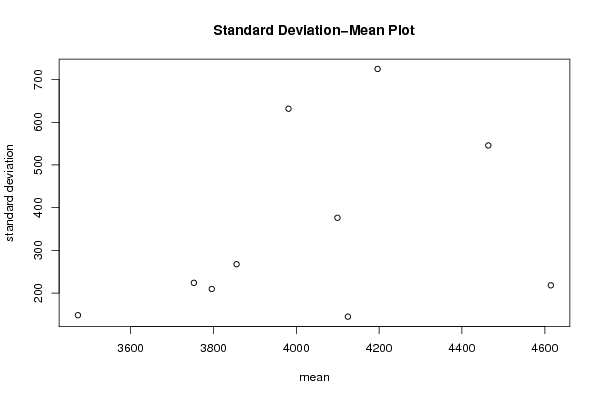
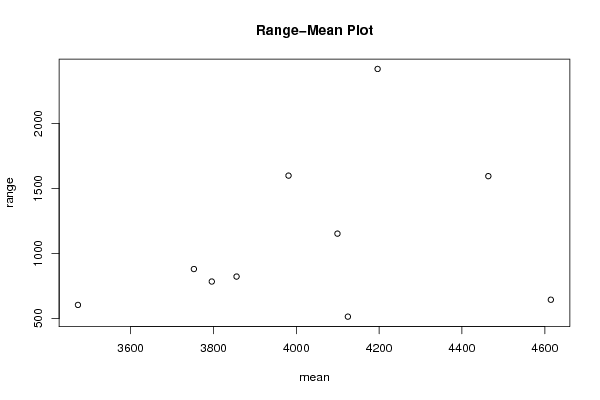
Standard Deviation-Mean Plot
SectionMeanStandard DeviationRange
14196.33333333333724.9209779296112418
24099.33333333333376.3908349124091152
34463.66666666667545.6831137263281594
44614.66666666667218.226460079404644
53981.16666666667631.7176920304221598
63752.66666666667224.057351965288880
74124.5144.806140000409514
83855.66666666667267.687515698073822
93795.83333333333209.603015823781784
103472.66666666667148.155528435697604

\begin{tabular}{lllllllll}
\hline
Standard Deviation-Mean Plot \tabularnewline
Section & Mean & Standard Deviation & Range \tabularnewline
1 & 4196.33333333333 & 724.920977929611 & 2418 \tabularnewline
2 & 4099.33333333333 & 376.390834912409 & 1152 \tabularnewline
3 & 4463.66666666667 & 545.683113726328 & 1594 \tabularnewline
4 & 4614.66666666667 & 218.226460079404 & 644 \tabularnewline
5 & 3981.16666666667 & 631.717692030422 & 1598 \tabularnewline
6 & 3752.66666666667 & 224.057351965288 & 880 \tabularnewline
7 & 4124.5 & 144.806140000409 & 514 \tabularnewline
8 & 3855.66666666667 & 267.687515698073 & 822 \tabularnewline
9 & 3795.83333333333 & 209.603015823781 & 784 \tabularnewline
10 & 3472.66666666667 & 148.155528435697 & 604 \tabularnewline
\hline
\end{tabular}
%Source: https://freestatistics.org/blog/index.php?pk=301452&T=1

[TABLE]
[ROW][C]Standard Deviation-Mean Plot[/C][/ROW]
[ROW][C]Section[/C][C]Mean[/C][C]Standard Deviation[/C][C]Range[/C][/ROW]
[ROW][C]1[/C][C]4196.33333333333[/C][C]724.920977929611[/C][C]2418[/C][/ROW]
[ROW][C]2[/C][C]4099.33333333333[/C][C]376.390834912409[/C][C]1152[/C][/ROW]
[ROW][C]3[/C][C]4463.66666666667[/C][C]545.683113726328[/C][C]1594[/C][/ROW]
[ROW][C]4[/C][C]4614.66666666667[/C][C]218.226460079404[/C][C]644[/C][/ROW]
[ROW][C]5[/C][C]3981.16666666667[/C][C]631.717692030422[/C][C]1598[/C][/ROW]
[ROW][C]6[/C][C]3752.66666666667[/C][C]224.057351965288[/C][C]880[/C][/ROW]
[ROW][C]7[/C][C]4124.5[/C][C]144.806140000409[/C][C]514[/C][/ROW]
[ROW][C]8[/C][C]3855.66666666667[/C][C]267.687515698073[/C][C]822[/C][/ROW]
[ROW][C]9[/C][C]3795.83333333333[/C][C]209.603015823781[/C][C]784[/C][/ROW]
[ROW][C]10[/C][C]3472.66666666667[/C][C]148.155528435697[/C][C]604[/C][/ROW]
[/TABLE]
Source: https://freestatistics.org/blog/index.php?pk=301452&T=1

Globally Unique Identifier (entire table): ba.freestatistics.org/blog/index.php?pk=301452&T=1

As an alternative you can also use a QR Code:  

The GUIDs for individual cells are displayed in the table below:

Standard Deviation-Mean Plot
SectionMeanStandard DeviationRange
14196.33333333333724.9209779296112418
24099.33333333333376.3908349124091152
34463.66666666667545.6831137263281594
44614.66666666667218.226460079404644
53981.16666666667631.7176920304221598
63752.66666666667224.057351965288880
74124.5144.806140000409514
83855.66666666667267.687515698073822
93795.83333333333209.603015823781784
103472.66666666667148.155528435697604


Regression: S.E.(k) = alpha + beta * Mean(k)
alpha-551.874860428258
beta0.223260125007966
S.D.0.20430387151539
T-STAT1.09278460242565
p-value0.306299983904185

\begin{tabular}{lllllllll}
\hline
Regression: S.E.(k) = alpha + beta * Mean(k) \tabularnewline
alpha & -551.874860428258 \tabularnewline
beta & 0.223260125007966 \tabularnewline
S.D. & 0.20430387151539 \tabularnewline
T-STAT & 1.09278460242565 \tabularnewline
p-value & 0.306299983904185 \tabularnewline
\hline
\end{tabular}
%Source: https://freestatistics.org/blog/index.php?pk=301452&T=2

[TABLE]
[ROW][C]Regression: S.E.(k) = alpha + beta * Mean(k)[/C][/ROW]
[ROW][C]alpha[/C][C]-551.874860428258[/C][/ROW]
[ROW][C]beta[/C][C]0.223260125007966[/C][/ROW]
[ROW][C]S.D.[/C][C]0.20430387151539[/C][/ROW]
[ROW][C]T-STAT[/C][C]1.09278460242565[/C][/ROW]
[ROW][C]p-value[/C][C]0.306299983904185[/C][/ROW]
[/TABLE]
Source: https://freestatistics.org/blog/index.php?pk=301452&T=2

Globally Unique Identifier (entire table): ba.freestatistics.org/blog/index.php?pk=301452&T=2

As an alternative you can also use a QR Code:  

The GUIDs for individual cells are displayed in the table below:

Regression: S.E.(k) = alpha + beta * Mean(k)
alpha-551.874860428258
beta0.223260125007966
S.D.0.20430387151539
T-STAT1.09278460242565
p-value0.306299983904185


Regression: ln S.E.(k) = alpha + beta * ln Mean(k)
alpha-18.0847296830406
beta2.8654066090742
S.D.2.23834906911686
T-STAT1.28014287342802
p-value0.236364574727564
Lambda-1.8654066090742

\begin{tabular}{lllllllll}
\hline
Regression: ln S.E.(k) = alpha + beta * ln Mean(k) \tabularnewline
alpha & -18.0847296830406 \tabularnewline
beta & 2.8654066090742 \tabularnewline
S.D. & 2.23834906911686 \tabularnewline
T-STAT & 1.28014287342802 \tabularnewline
p-value & 0.236364574727564 \tabularnewline
Lambda & -1.8654066090742 \tabularnewline
\hline
\end{tabular}
%Source: https://freestatistics.org/blog/index.php?pk=301452&T=3

[TABLE]
[ROW][C]Regression: ln S.E.(k) = alpha + beta * ln Mean(k)[/C][/ROW]
[ROW][C]alpha[/C][C]-18.0847296830406[/C][/ROW]
[ROW][C]beta[/C][C]2.8654066090742[/C][/ROW]
[ROW][C]S.D.[/C][C]2.23834906911686[/C][/ROW]
[ROW][C]T-STAT[/C][C]1.28014287342802[/C][/ROW]
[ROW][C]p-value[/C][C]0.236364574727564[/C][/ROW]
[ROW][C]Lambda[/C][C]-1.8654066090742[/C][/ROW]
[/TABLE]
Source: https://freestatistics.org/blog/index.php?pk=301452&T=3

Globally Unique Identifier (entire table): ba.freestatistics.org/blog/index.php?pk=301452&T=3

As an alternative you can also use a QR Code:  

The GUIDs for individual cells are displayed in the table below:

Regression: ln S.E.(k) = alpha + beta * ln Mean(k)
alpha-18.0847296830406
beta2.8654066090742
S.D.2.23834906911686
T-STAT1.28014287342802
p-value0.236364574727564
Lambda-1.8654066090742


Parameters (Session):
par1 = Default ; par2 = 1 ; par3 = 1 ; par4 = 0 ; par5 = 12 ; par6 = White Noise ; par7 = 0.95 ;
Parameters (R input):
par1 = 12 ;
R code (references can be found in the software module):
par1 <- as.numeric(par1)
(n <- length(x))
(np <- floor(n / par1))
arr <- array(NA,dim=c(par1,np))
j <- 0
k <- 1
for (i in 1:(np*par1))
{
j = j + 1
arr[j,k] <- x[i]
if (j == par1) {
j = 0
k=k+1
}
}
arr
arr.mean <- array(NA,dim=np)
arr.sd <- array(NA,dim=np)
arr.range <- array(NA,dim=np)
for (j in 1:np)
{
arr.mean[j] <- mean(arr[,j],na.rm=TRUE)
arr.sd[j] <- sd(arr[,j],na.rm=TRUE)
arr.range[j] <- max(arr[,j],na.rm=TRUE) - min(arr[,j],na.rm=TRUE)
}
arr.mean
arr.sd
arr.range
(lm1 <- lm(arr.sd~arr.mean))
(lnlm1 <- lm(log(arr.sd)~log(arr.mean)))
(lm2 <- lm(arr.range~arr.mean))
bitmap(file='test1.png')
plot(arr.mean,arr.sd,main='Standard Deviation-Mean Plot',xlab='mean',ylab='standard deviation')
dev.off()
bitmap(file='test2.png')
plot(arr.mean,arr.range,main='Range-Mean Plot',xlab='mean',ylab='range')
dev.off()
load(file='createtable')
a<-table.start()
a<-table.row.start(a)
a<-table.element(a,'Standard Deviation-Mean Plot',4,TRUE)
a<-table.row.end(a)
a<-table.row.start(a)
a<-table.element(a,'Section',header=TRUE)
a<-table.element(a,'Mean',header=TRUE)
a<-table.element(a,'Standard Deviation',header=TRUE)
a<-table.element(a,'Range',header=TRUE)
a<-table.row.end(a)
for (j in 1:np) {
a<-table.row.start(a)
a<-table.element(a,j,header=TRUE)
a<-table.element(a,arr.mean[j])
a<-table.element(a,arr.sd[j] )
a<-table.element(a,arr.range[j] )
a<-table.row.end(a)
}
a<-table.end(a)
table.save(a,file='mytable.tab')
a<-table.start()
a<-table.row.start(a)
a<-table.element(a,'Regression: S.E.(k) = alpha + beta * Mean(k)',2,TRUE)
a<-table.row.end(a)
a<-table.row.start(a)
a<-table.element(a,'alpha',header=TRUE)
a<-table.element(a,lm1$coefficients[[1]])
a<-table.row.end(a)
a<-table.row.start(a)
a<-table.element(a,'beta',header=TRUE)
a<-table.element(a,lm1$coefficients[[2]])
a<-table.row.end(a)
a<-table.row.start(a)
a<-table.element(a,'S.D.',header=TRUE)
a<-table.element(a,summary(lm1)$coefficients[2,2])
a<-table.row.end(a)
a<-table.row.start(a)
a<-table.element(a,'T-STAT',header=TRUE)
a<-table.element(a,summary(lm1)$coefficients[2,3])
a<-table.row.end(a)
a<-table.row.start(a)
a<-table.element(a,'p-value',header=TRUE)
a<-table.element(a,summary(lm1)$coefficients[2,4])
a<-table.row.end(a)
a<-table.end(a)
table.save(a,file='mytable1.tab')
a<-table.start()
a<-table.row.start(a)
a<-table.element(a,'Regression: ln S.E.(k) = alpha + beta * ln Mean(k)',2,TRUE)
a<-table.row.end(a)
a<-table.row.start(a)
a<-table.element(a,'alpha',header=TRUE)
a<-table.element(a,lnlm1$coefficients[[1]])
a<-table.row.end(a)
a<-table.row.start(a)
a<-table.element(a,'beta',header=TRUE)
a<-table.element(a,lnlm1$coefficients[[2]])
a<-table.row.end(a)
a<-table.row.start(a)
a<-table.element(a,'S.D.',header=TRUE)
a<-table.element(a,summary(lnlm1)$coefficients[2,2])
a<-table.row.end(a)
a<-table.row.start(a)
a<-table.element(a,'T-STAT',header=TRUE)
a<-table.element(a,summary(lnlm1)$coefficients[2,3])
a<-table.row.end(a)
a<-table.row.start(a)
a<-table.element(a,'p-value',header=TRUE)
a<-table.element(a,summary(lnlm1)$coefficients[2,4])
a<-table.row.end(a)
a<-table.row.start(a)
a<-table.element(a,'Lambda',header=TRUE)
a<-table.element(a,1-lnlm1$coefficients[[2]])
a<-table.row.end(a)
a<-table.end(a)
table.save(a,file='mytable2.tab')