Free Statistics

of Irreproducible Research!

Author's title

Author*The author of this computation has been verified*
R Software Modulerwasp_autocorrelation.wasp
Title produced by software(Partial) Autocorrelation Function
Date of computationMon, 19 Dec 2016 17:56:20 +0100
Cite this page as followsStatistical Computations at FreeStatistics.org, Office for Research Development and Education, URL https://freestatistics.org/blog/index.php?v=date/2016/Dec/19/t14821667048z8czs1zb1qugh9.htm/, Retrieved Fri, 17 May 2024 15:21:16 +0000
Statistical Computations at FreeStatistics.org, Office for Research Development and Education, URL https://freestatistics.org/blog/index.php?pk=301426, Retrieved Fri, 17 May 2024 15:21:16 +0000
QR Codes:

Original text written by user:
IsPrivate?No (this computation is public)
User-defined keywords
Estimated Impact71
Family? (F = Feedback message, R = changed R code, M = changed R Module, P = changed Parameters, D = changed Data)
-       [(Partial) Autocorrelation Function] [autocorr] [2016-12-19 16:56:20] [e8b5e2ae4a4517822f644e6c122e1af0] [Current]
Feedback Forum

Post a new message
Dataseries X:
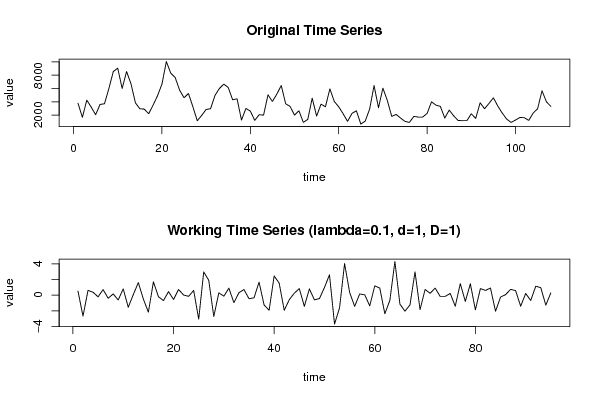
3800
1650
4250
3200
2050
3600
3700
6000
8550
9050
6000
8550
6700
3850
2950
2900
2200
3500
4900
6650
10050
8300
7650
5750
4600
5250
3250
1150
1950
2850
2950
4950
6000
6650
6150
4300
4450
1250
3000
2600
1200
2050
2000
5050
4050
5150
6450
3700
3300
2000
2650
900
1350
4550
1850
3650
3250
5950
4050
3250
2200
1050
2250
2650
650
1100
2900
6450
3100
6050
4200
1800
2100
1550
1050
900
1800
1700
1700
2250
4000
3500
3300
1550
2750
1900
1200
1150
1150
2200
1500
3850
2950
3750
4600
3350
2300
1400
900
1250
1650
1600
1200
2300
2950
5650
4000
3300


Summary of computational transaction
Raw Input view raw input (R code)
Raw Outputview raw output of R engine
Computing time1 seconds
R ServerBig Analytics Cloud Computing Center

\begin{tabular}{lllllllll}
\hline
Summary of computational transaction \tabularnewline
Raw Input view raw input (R code)  \tabularnewline
Raw Outputview raw output of R engine  \tabularnewline
Computing time1 seconds \tabularnewline
R ServerBig Analytics Cloud Computing Center \tabularnewline
\hline
\end{tabular}
%Source: https://freestatistics.org/blog/index.php?pk=301426&T=0

[TABLE]
[ROW]
Summary of computational transaction[/C][/ROW] [ROW]Raw Input[/C] view raw input (R code) [/C][/ROW] [ROW]Raw Output[/C]view raw output of R engine [/C][/ROW] [ROW]Computing time[/C]1 seconds[/C][/ROW] [ROW]R Server[/C]Big Analytics Cloud Computing Center[/C][/ROW] [/TABLE] Source: https://freestatistics.org/blog/index.php?pk=301426&T=0

Globally Unique Identifier (entire table): ba.freestatistics.org/blog/index.php?pk=301426&T=0

As an alternative you can also use a QR Code:  

The GUIDs for individual cells are displayed in the table below:

Summary of computational transaction
Raw Input view raw input (R code)
Raw Outputview raw output of R engine
Computing time1 seconds
R ServerBig Analytics Cloud Computing Center


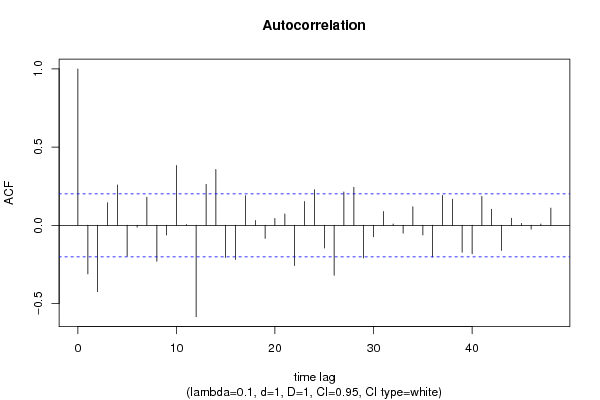
Autocorrelation Function
Time lag kACF(k)T-STATP-value
1-0.310576-3.02710.001589
2-0.425141-4.14383.7e-05
30.1442621.40610.08148
40.258232.51690.006757
5-0.197296-1.9230.028738
6-0.011855-0.11560.454126
70.1795561.75010.041665
8-0.230382-2.24550.013528
9-0.062001-0.60430.27354
100.3821233.72450.000166
110.0047020.04580.481772
12-0.584189-5.6940
130.2620472.55410.006118
140.3566613.47630.000384
15-0.20617-2.00950.023661
16-0.218615-2.13080.017844
170.189821.85010.033701
180.0303060.29540.384173
19-0.083577-0.81460.208666
200.0439140.4280.334804
210.0726350.7080.240352
22-0.25676-2.50260.007019
230.1520151.48170.070871
240.2274542.2170.014506
25-0.145173-1.4150.080173
26-0.319811-3.11710.001208
270.2129052.07510.020338
280.2437412.37570.009762
29-0.208259-2.02990.022584
30-0.073621-0.71760.237392
310.0886320.86390.194915
320.0082070.080.468206
33-0.050143-0.48870.313078
340.1186711.15670.125156
35-0.062554-0.60970.271759
36-0.203009-1.97870.025373
370.1912831.86440.032677
380.1672251.62990.053216
39-0.172791-1.68420.047717
40-0.181462-1.76870.040079
410.1847351.80060.037472
420.1030681.00460.158824
43-0.161339-1.57250.059575
440.0456720.44520.328611
450.0122110.1190.452755
46-0.024364-0.23750.406401
470.0081490.07940.468429
480.1099381.07150.143321

\begin{tabular}{lllllllll}
\hline
Autocorrelation Function \tabularnewline
Time lag k & ACF(k) & T-STAT & P-value \tabularnewline
1 & -0.310576 & -3.0271 & 0.001589 \tabularnewline
2 & -0.425141 & -4.1438 & 3.7e-05 \tabularnewline
3 & 0.144262 & 1.4061 & 0.08148 \tabularnewline
4 & 0.25823 & 2.5169 & 0.006757 \tabularnewline
5 & -0.197296 & -1.923 & 0.028738 \tabularnewline
6 & -0.011855 & -0.1156 & 0.454126 \tabularnewline
7 & 0.179556 & 1.7501 & 0.041665 \tabularnewline
8 & -0.230382 & -2.2455 & 0.013528 \tabularnewline
9 & -0.062001 & -0.6043 & 0.27354 \tabularnewline
10 & 0.382123 & 3.7245 & 0.000166 \tabularnewline
11 & 0.004702 & 0.0458 & 0.481772 \tabularnewline
12 & -0.584189 & -5.694 & 0 \tabularnewline
13 & 0.262047 & 2.5541 & 0.006118 \tabularnewline
14 & 0.356661 & 3.4763 & 0.000384 \tabularnewline
15 & -0.20617 & -2.0095 & 0.023661 \tabularnewline
16 & -0.218615 & -2.1308 & 0.017844 \tabularnewline
17 & 0.18982 & 1.8501 & 0.033701 \tabularnewline
18 & 0.030306 & 0.2954 & 0.384173 \tabularnewline
19 & -0.083577 & -0.8146 & 0.208666 \tabularnewline
20 & 0.043914 & 0.428 & 0.334804 \tabularnewline
21 & 0.072635 & 0.708 & 0.240352 \tabularnewline
22 & -0.25676 & -2.5026 & 0.007019 \tabularnewline
23 & 0.152015 & 1.4817 & 0.070871 \tabularnewline
24 & 0.227454 & 2.217 & 0.014506 \tabularnewline
25 & -0.145173 & -1.415 & 0.080173 \tabularnewline
26 & -0.319811 & -3.1171 & 0.001208 \tabularnewline
27 & 0.212905 & 2.0751 & 0.020338 \tabularnewline
28 & 0.243741 & 2.3757 & 0.009762 \tabularnewline
29 & -0.208259 & -2.0299 & 0.022584 \tabularnewline
30 & -0.073621 & -0.7176 & 0.237392 \tabularnewline
31 & 0.088632 & 0.8639 & 0.194915 \tabularnewline
32 & 0.008207 & 0.08 & 0.468206 \tabularnewline
33 & -0.050143 & -0.4887 & 0.313078 \tabularnewline
34 & 0.118671 & 1.1567 & 0.125156 \tabularnewline
35 & -0.062554 & -0.6097 & 0.271759 \tabularnewline
36 & -0.203009 & -1.9787 & 0.025373 \tabularnewline
37 & 0.191283 & 1.8644 & 0.032677 \tabularnewline
38 & 0.167225 & 1.6299 & 0.053216 \tabularnewline
39 & -0.172791 & -1.6842 & 0.047717 \tabularnewline
40 & -0.181462 & -1.7687 & 0.040079 \tabularnewline
41 & 0.184735 & 1.8006 & 0.037472 \tabularnewline
42 & 0.103068 & 1.0046 & 0.158824 \tabularnewline
43 & -0.161339 & -1.5725 & 0.059575 \tabularnewline
44 & 0.045672 & 0.4452 & 0.328611 \tabularnewline
45 & 0.012211 & 0.119 & 0.452755 \tabularnewline
46 & -0.024364 & -0.2375 & 0.406401 \tabularnewline
47 & 0.008149 & 0.0794 & 0.468429 \tabularnewline
48 & 0.109938 & 1.0715 & 0.143321 \tabularnewline
\hline
\end{tabular}
%Source: https://freestatistics.org/blog/index.php?pk=301426&T=1

[TABLE]
[ROW][C]Autocorrelation Function[/C][/ROW]
[ROW][C]Time lag k[/C][C]ACF(k)[/C][C]T-STAT[/C][C]P-value[/C][/ROW]
[ROW][C]1[/C][C]-0.310576[/C][C]-3.0271[/C][C]0.001589[/C][/ROW]
[ROW][C]2[/C][C]-0.425141[/C][C]-4.1438[/C][C]3.7e-05[/C][/ROW]
[ROW][C]3[/C][C]0.144262[/C][C]1.4061[/C][C]0.08148[/C][/ROW]
[ROW][C]4[/C][C]0.25823[/C][C]2.5169[/C][C]0.006757[/C][/ROW]
[ROW][C]5[/C][C]-0.197296[/C][C]-1.923[/C][C]0.028738[/C][/ROW]
[ROW][C]6[/C][C]-0.011855[/C][C]-0.1156[/C][C]0.454126[/C][/ROW]
[ROW][C]7[/C][C]0.179556[/C][C]1.7501[/C][C]0.041665[/C][/ROW]
[ROW][C]8[/C][C]-0.230382[/C][C]-2.2455[/C][C]0.013528[/C][/ROW]
[ROW][C]9[/C][C]-0.062001[/C][C]-0.6043[/C][C]0.27354[/C][/ROW]
[ROW][C]10[/C][C]0.382123[/C][C]3.7245[/C][C]0.000166[/C][/ROW]
[ROW][C]11[/C][C]0.004702[/C][C]0.0458[/C][C]0.481772[/C][/ROW]
[ROW][C]12[/C][C]-0.584189[/C][C]-5.694[/C][C]0[/C][/ROW]
[ROW][C]13[/C][C]0.262047[/C][C]2.5541[/C][C]0.006118[/C][/ROW]
[ROW][C]14[/C][C]0.356661[/C][C]3.4763[/C][C]0.000384[/C][/ROW]
[ROW][C]15[/C][C]-0.20617[/C][C]-2.0095[/C][C]0.023661[/C][/ROW]
[ROW][C]16[/C][C]-0.218615[/C][C]-2.1308[/C][C]0.017844[/C][/ROW]
[ROW][C]17[/C][C]0.18982[/C][C]1.8501[/C][C]0.033701[/C][/ROW]
[ROW][C]18[/C][C]0.030306[/C][C]0.2954[/C][C]0.384173[/C][/ROW]
[ROW][C]19[/C][C]-0.083577[/C][C]-0.8146[/C][C]0.208666[/C][/ROW]
[ROW][C]20[/C][C]0.043914[/C][C]0.428[/C][C]0.334804[/C][/ROW]
[ROW][C]21[/C][C]0.072635[/C][C]0.708[/C][C]0.240352[/C][/ROW]
[ROW][C]22[/C][C]-0.25676[/C][C]-2.5026[/C][C]0.007019[/C][/ROW]
[ROW][C]23[/C][C]0.152015[/C][C]1.4817[/C][C]0.070871[/C][/ROW]
[ROW][C]24[/C][C]0.227454[/C][C]2.217[/C][C]0.014506[/C][/ROW]
[ROW][C]25[/C][C]-0.145173[/C][C]-1.415[/C][C]0.080173[/C][/ROW]
[ROW][C]26[/C][C]-0.319811[/C][C]-3.1171[/C][C]0.001208[/C][/ROW]
[ROW][C]27[/C][C]0.212905[/C][C]2.0751[/C][C]0.020338[/C][/ROW]
[ROW][C]28[/C][C]0.243741[/C][C]2.3757[/C][C]0.009762[/C][/ROW]
[ROW][C]29[/C][C]-0.208259[/C][C]-2.0299[/C][C]0.022584[/C][/ROW]
[ROW][C]30[/C][C]-0.073621[/C][C]-0.7176[/C][C]0.237392[/C][/ROW]
[ROW][C]31[/C][C]0.088632[/C][C]0.8639[/C][C]0.194915[/C][/ROW]
[ROW][C]32[/C][C]0.008207[/C][C]0.08[/C][C]0.468206[/C][/ROW]
[ROW][C]33[/C][C]-0.050143[/C][C]-0.4887[/C][C]0.313078[/C][/ROW]
[ROW][C]34[/C][C]0.118671[/C][C]1.1567[/C][C]0.125156[/C][/ROW]
[ROW][C]35[/C][C]-0.062554[/C][C]-0.6097[/C][C]0.271759[/C][/ROW]
[ROW][C]36[/C][C]-0.203009[/C][C]-1.9787[/C][C]0.025373[/C][/ROW]
[ROW][C]37[/C][C]0.191283[/C][C]1.8644[/C][C]0.032677[/C][/ROW]
[ROW][C]38[/C][C]0.167225[/C][C]1.6299[/C][C]0.053216[/C][/ROW]
[ROW][C]39[/C][C]-0.172791[/C][C]-1.6842[/C][C]0.047717[/C][/ROW]
[ROW][C]40[/C][C]-0.181462[/C][C]-1.7687[/C][C]0.040079[/C][/ROW]
[ROW][C]41[/C][C]0.184735[/C][C]1.8006[/C][C]0.037472[/C][/ROW]
[ROW][C]42[/C][C]0.103068[/C][C]1.0046[/C][C]0.158824[/C][/ROW]
[ROW][C]43[/C][C]-0.161339[/C][C]-1.5725[/C][C]0.059575[/C][/ROW]
[ROW][C]44[/C][C]0.045672[/C][C]0.4452[/C][C]0.328611[/C][/ROW]
[ROW][C]45[/C][C]0.012211[/C][C]0.119[/C][C]0.452755[/C][/ROW]
[ROW][C]46[/C][C]-0.024364[/C][C]-0.2375[/C][C]0.406401[/C][/ROW]
[ROW][C]47[/C][C]0.008149[/C][C]0.0794[/C][C]0.468429[/C][/ROW]
[ROW][C]48[/C][C]0.109938[/C][C]1.0715[/C][C]0.143321[/C][/ROW]
[/TABLE]
Source: https://freestatistics.org/blog/index.php?pk=301426&T=1

Globally Unique Identifier (entire table): ba.freestatistics.org/blog/index.php?pk=301426&T=1

As an alternative you can also use a QR Code:  

The GUIDs for individual cells are displayed in the table below:

Autocorrelation Function
Time lag kACF(k)T-STATP-value
1-0.310576-3.02710.001589
2-0.425141-4.14383.7e-05
30.1442621.40610.08148
40.258232.51690.006757
5-0.197296-1.9230.028738
6-0.011855-0.11560.454126
70.1795561.75010.041665
8-0.230382-2.24550.013528
9-0.062001-0.60430.27354
100.3821233.72450.000166
110.0047020.04580.481772
12-0.584189-5.6940
130.2620472.55410.006118
140.3566613.47630.000384
15-0.20617-2.00950.023661
16-0.218615-2.13080.017844
170.189821.85010.033701
180.0303060.29540.384173
19-0.083577-0.81460.208666
200.0439140.4280.334804
210.0726350.7080.240352
22-0.25676-2.50260.007019
230.1520151.48170.070871
240.2274542.2170.014506
25-0.145173-1.4150.080173
26-0.319811-3.11710.001208
270.2129052.07510.020338
280.2437412.37570.009762
29-0.208259-2.02990.022584
30-0.073621-0.71760.237392
310.0886320.86390.194915
320.0082070.080.468206
33-0.050143-0.48870.313078
340.1186711.15670.125156
35-0.062554-0.60970.271759
36-0.203009-1.97870.025373
370.1912831.86440.032677
380.1672251.62990.053216
39-0.172791-1.68420.047717
40-0.181462-1.76870.040079
410.1847351.80060.037472
420.1030681.00460.158824
43-0.161339-1.57250.059575
440.0456720.44520.328611
450.0122110.1190.452755
46-0.024364-0.23750.406401
470.0081490.07940.468429
480.1099381.07150.143321


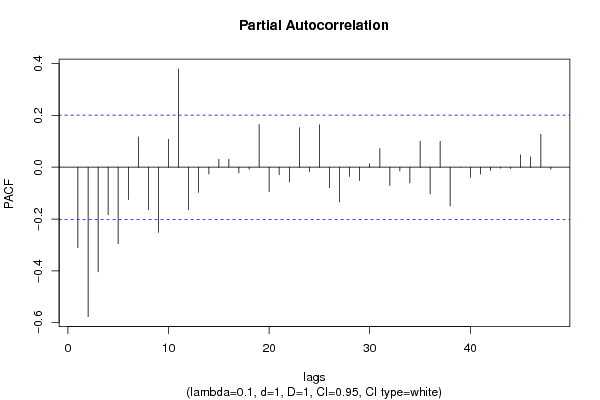
Partial Autocorrelation Function
Time lag kPACF(k)T-STATP-value
1-0.310576-3.02710.001589
2-0.577281-5.62660
3-0.403844-3.93627.9e-05
4-0.183314-1.78670.038586
5-0.295814-2.88320.002434
6-0.124843-1.21680.113344
70.1169111.13950.128679
8-0.164453-1.60290.05614
9-0.251197-2.44840.008093
100.1084811.05730.146518
110.3797383.70120.00018
12-0.16466-1.60490.055917
13-0.096805-0.94350.1739
14-0.025694-0.25040.401397
150.0308380.30060.3822
160.0310140.30230.381548
17-0.021409-0.20870.417575
18-0.007338-0.07150.471566
190.164741.60570.05583
20-0.094284-0.9190.180219
21-0.029121-0.28380.388575
22-0.057153-0.55710.289398
230.1524831.48620.070266
24-0.016599-0.16180.43591
250.163931.59780.056705
26-0.078892-0.76890.221918
27-0.132895-1.29530.099178
28-0.035814-0.34910.363903
29-0.051603-0.5030.308076
300.0134760.13130.447889
310.0720230.7020.242199
32-0.070222-0.68440.247684
33-0.014513-0.14150.443907
34-0.060924-0.59380.277024
350.100670.98120.164491
36-0.103704-1.01080.157345
370.1000710.97540.165927
38-0.149643-1.45850.073995
39-0.000139-0.00140.49946
40-0.039106-0.38120.351968
41-0.026306-0.25640.399097
42-0.01154-0.11250.455341
43-0.003495-0.03410.486447
44-0.004829-0.04710.48128
450.0478180.46610.321114
460.0400640.39050.348521
470.1273621.24140.108762
48-0.007847-0.07650.469596

\begin{tabular}{lllllllll}
\hline
Partial Autocorrelation Function \tabularnewline
Time lag k & PACF(k) & T-STAT & P-value \tabularnewline
1 & -0.310576 & -3.0271 & 0.001589 \tabularnewline
2 & -0.577281 & -5.6266 & 0 \tabularnewline
3 & -0.403844 & -3.9362 & 7.9e-05 \tabularnewline
4 & -0.183314 & -1.7867 & 0.038586 \tabularnewline
5 & -0.295814 & -2.8832 & 0.002434 \tabularnewline
6 & -0.124843 & -1.2168 & 0.113344 \tabularnewline
7 & 0.116911 & 1.1395 & 0.128679 \tabularnewline
8 & -0.164453 & -1.6029 & 0.05614 \tabularnewline
9 & -0.251197 & -2.4484 & 0.008093 \tabularnewline
10 & 0.108481 & 1.0573 & 0.146518 \tabularnewline
11 & 0.379738 & 3.7012 & 0.00018 \tabularnewline
12 & -0.16466 & -1.6049 & 0.055917 \tabularnewline
13 & -0.096805 & -0.9435 & 0.1739 \tabularnewline
14 & -0.025694 & -0.2504 & 0.401397 \tabularnewline
15 & 0.030838 & 0.3006 & 0.3822 \tabularnewline
16 & 0.031014 & 0.3023 & 0.381548 \tabularnewline
17 & -0.021409 & -0.2087 & 0.417575 \tabularnewline
18 & -0.007338 & -0.0715 & 0.471566 \tabularnewline
19 & 0.16474 & 1.6057 & 0.05583 \tabularnewline
20 & -0.094284 & -0.919 & 0.180219 \tabularnewline
21 & -0.029121 & -0.2838 & 0.388575 \tabularnewline
22 & -0.057153 & -0.5571 & 0.289398 \tabularnewline
23 & 0.152483 & 1.4862 & 0.070266 \tabularnewline
24 & -0.016599 & -0.1618 & 0.43591 \tabularnewline
25 & 0.16393 & 1.5978 & 0.056705 \tabularnewline
26 & -0.078892 & -0.7689 & 0.221918 \tabularnewline
27 & -0.132895 & -1.2953 & 0.099178 \tabularnewline
28 & -0.035814 & -0.3491 & 0.363903 \tabularnewline
29 & -0.051603 & -0.503 & 0.308076 \tabularnewline
30 & 0.013476 & 0.1313 & 0.447889 \tabularnewline
31 & 0.072023 & 0.702 & 0.242199 \tabularnewline
32 & -0.070222 & -0.6844 & 0.247684 \tabularnewline
33 & -0.014513 & -0.1415 & 0.443907 \tabularnewline
34 & -0.060924 & -0.5938 & 0.277024 \tabularnewline
35 & 0.10067 & 0.9812 & 0.164491 \tabularnewline
36 & -0.103704 & -1.0108 & 0.157345 \tabularnewline
37 & 0.100071 & 0.9754 & 0.165927 \tabularnewline
38 & -0.149643 & -1.4585 & 0.073995 \tabularnewline
39 & -0.000139 & -0.0014 & 0.49946 \tabularnewline
40 & -0.039106 & -0.3812 & 0.351968 \tabularnewline
41 & -0.026306 & -0.2564 & 0.399097 \tabularnewline
42 & -0.01154 & -0.1125 & 0.455341 \tabularnewline
43 & -0.003495 & -0.0341 & 0.486447 \tabularnewline
44 & -0.004829 & -0.0471 & 0.48128 \tabularnewline
45 & 0.047818 & 0.4661 & 0.321114 \tabularnewline
46 & 0.040064 & 0.3905 & 0.348521 \tabularnewline
47 & 0.127362 & 1.2414 & 0.108762 \tabularnewline
48 & -0.007847 & -0.0765 & 0.469596 \tabularnewline
\hline
\end{tabular}
%Source: https://freestatistics.org/blog/index.php?pk=301426&T=2

[TABLE]
[ROW][C]Partial Autocorrelation Function[/C][/ROW]
[ROW][C]Time lag k[/C][C]PACF(k)[/C][C]T-STAT[/C][C]P-value[/C][/ROW]
[ROW][C]1[/C][C]-0.310576[/C][C]-3.0271[/C][C]0.001589[/C][/ROW]
[ROW][C]2[/C][C]-0.577281[/C][C]-5.6266[/C][C]0[/C][/ROW]
[ROW][C]3[/C][C]-0.403844[/C][C]-3.9362[/C][C]7.9e-05[/C][/ROW]
[ROW][C]4[/C][C]-0.183314[/C][C]-1.7867[/C][C]0.038586[/C][/ROW]
[ROW][C]5[/C][C]-0.295814[/C][C]-2.8832[/C][C]0.002434[/C][/ROW]
[ROW][C]6[/C][C]-0.124843[/C][C]-1.2168[/C][C]0.113344[/C][/ROW]
[ROW][C]7[/C][C]0.116911[/C][C]1.1395[/C][C]0.128679[/C][/ROW]
[ROW][C]8[/C][C]-0.164453[/C][C]-1.6029[/C][C]0.05614[/C][/ROW]
[ROW][C]9[/C][C]-0.251197[/C][C]-2.4484[/C][C]0.008093[/C][/ROW]
[ROW][C]10[/C][C]0.108481[/C][C]1.0573[/C][C]0.146518[/C][/ROW]
[ROW][C]11[/C][C]0.379738[/C][C]3.7012[/C][C]0.00018[/C][/ROW]
[ROW][C]12[/C][C]-0.16466[/C][C]-1.6049[/C][C]0.055917[/C][/ROW]
[ROW][C]13[/C][C]-0.096805[/C][C]-0.9435[/C][C]0.1739[/C][/ROW]
[ROW][C]14[/C][C]-0.025694[/C][C]-0.2504[/C][C]0.401397[/C][/ROW]
[ROW][C]15[/C][C]0.030838[/C][C]0.3006[/C][C]0.3822[/C][/ROW]
[ROW][C]16[/C][C]0.031014[/C][C]0.3023[/C][C]0.381548[/C][/ROW]
[ROW][C]17[/C][C]-0.021409[/C][C]-0.2087[/C][C]0.417575[/C][/ROW]
[ROW][C]18[/C][C]-0.007338[/C][C]-0.0715[/C][C]0.471566[/C][/ROW]
[ROW][C]19[/C][C]0.16474[/C][C]1.6057[/C][C]0.05583[/C][/ROW]
[ROW][C]20[/C][C]-0.094284[/C][C]-0.919[/C][C]0.180219[/C][/ROW]
[ROW][C]21[/C][C]-0.029121[/C][C]-0.2838[/C][C]0.388575[/C][/ROW]
[ROW][C]22[/C][C]-0.057153[/C][C]-0.5571[/C][C]0.289398[/C][/ROW]
[ROW][C]23[/C][C]0.152483[/C][C]1.4862[/C][C]0.070266[/C][/ROW]
[ROW][C]24[/C][C]-0.016599[/C][C]-0.1618[/C][C]0.43591[/C][/ROW]
[ROW][C]25[/C][C]0.16393[/C][C]1.5978[/C][C]0.056705[/C][/ROW]
[ROW][C]26[/C][C]-0.078892[/C][C]-0.7689[/C][C]0.221918[/C][/ROW]
[ROW][C]27[/C][C]-0.132895[/C][C]-1.2953[/C][C]0.099178[/C][/ROW]
[ROW][C]28[/C][C]-0.035814[/C][C]-0.3491[/C][C]0.363903[/C][/ROW]
[ROW][C]29[/C][C]-0.051603[/C][C]-0.503[/C][C]0.308076[/C][/ROW]
[ROW][C]30[/C][C]0.013476[/C][C]0.1313[/C][C]0.447889[/C][/ROW]
[ROW][C]31[/C][C]0.072023[/C][C]0.702[/C][C]0.242199[/C][/ROW]
[ROW][C]32[/C][C]-0.070222[/C][C]-0.6844[/C][C]0.247684[/C][/ROW]
[ROW][C]33[/C][C]-0.014513[/C][C]-0.1415[/C][C]0.443907[/C][/ROW]
[ROW][C]34[/C][C]-0.060924[/C][C]-0.5938[/C][C]0.277024[/C][/ROW]
[ROW][C]35[/C][C]0.10067[/C][C]0.9812[/C][C]0.164491[/C][/ROW]
[ROW][C]36[/C][C]-0.103704[/C][C]-1.0108[/C][C]0.157345[/C][/ROW]
[ROW][C]37[/C][C]0.100071[/C][C]0.9754[/C][C]0.165927[/C][/ROW]
[ROW][C]38[/C][C]-0.149643[/C][C]-1.4585[/C][C]0.073995[/C][/ROW]
[ROW][C]39[/C][C]-0.000139[/C][C]-0.0014[/C][C]0.49946[/C][/ROW]
[ROW][C]40[/C][C]-0.039106[/C][C]-0.3812[/C][C]0.351968[/C][/ROW]
[ROW][C]41[/C][C]-0.026306[/C][C]-0.2564[/C][C]0.399097[/C][/ROW]
[ROW][C]42[/C][C]-0.01154[/C][C]-0.1125[/C][C]0.455341[/C][/ROW]
[ROW][C]43[/C][C]-0.003495[/C][C]-0.0341[/C][C]0.486447[/C][/ROW]
[ROW][C]44[/C][C]-0.004829[/C][C]-0.0471[/C][C]0.48128[/C][/ROW]
[ROW][C]45[/C][C]0.047818[/C][C]0.4661[/C][C]0.321114[/C][/ROW]
[ROW][C]46[/C][C]0.040064[/C][C]0.3905[/C][C]0.348521[/C][/ROW]
[ROW][C]47[/C][C]0.127362[/C][C]1.2414[/C][C]0.108762[/C][/ROW]
[ROW][C]48[/C][C]-0.007847[/C][C]-0.0765[/C][C]0.469596[/C][/ROW]
[/TABLE]
Source: https://freestatistics.org/blog/index.php?pk=301426&T=2

Globally Unique Identifier (entire table): ba.freestatistics.org/blog/index.php?pk=301426&T=2

As an alternative you can also use a QR Code:  

The GUIDs for individual cells are displayed in the table below:

Partial Autocorrelation Function
Time lag kPACF(k)T-STATP-value
1-0.310576-3.02710.001589
2-0.577281-5.62660
3-0.403844-3.93627.9e-05
4-0.183314-1.78670.038586
5-0.295814-2.88320.002434
6-0.124843-1.21680.113344
70.1169111.13950.128679
8-0.164453-1.60290.05614
9-0.251197-2.44840.008093
100.1084811.05730.146518
110.3797383.70120.00018
12-0.16466-1.60490.055917
13-0.096805-0.94350.1739
14-0.025694-0.25040.401397
150.0308380.30060.3822
160.0310140.30230.381548
17-0.021409-0.20870.417575
18-0.007338-0.07150.471566
190.164741.60570.05583
20-0.094284-0.9190.180219
21-0.029121-0.28380.388575
22-0.057153-0.55710.289398
230.1524831.48620.070266
24-0.016599-0.16180.43591
250.163931.59780.056705
26-0.078892-0.76890.221918
27-0.132895-1.29530.099178
28-0.035814-0.34910.363903
29-0.051603-0.5030.308076
300.0134760.13130.447889
310.0720230.7020.242199
32-0.070222-0.68440.247684
33-0.014513-0.14150.443907
34-0.060924-0.59380.277024
350.100670.98120.164491
36-0.103704-1.01080.157345
370.1000710.97540.165927
38-0.149643-1.45850.073995
39-0.000139-0.00140.49946
40-0.039106-0.38120.351968
41-0.026306-0.25640.399097
42-0.01154-0.11250.455341
43-0.003495-0.03410.486447
44-0.004829-0.04710.48128
450.0478180.46610.321114
460.0400640.39050.348521
470.1273621.24140.108762
48-0.007847-0.07650.469596


Parameters (Session):
par1 = Default ; par2 = 0.1 ; par3 = 0 ; par4 = 0 ; par5 = 12 ; par6 = White Noise ; par7 = 0.95 ;
Parameters (R input):
par1 = 48 ; par2 = 0.1 ; par3 = 1 ; par4 = 1 ; par5 = 12 ; par6 = White Noise ; par7 = 0.95 ; par8 = ;
R code (references can be found in the software module):
if (par1 == 'Default') {
par1 = 10*log10(length(x))
} else {
par1 <- as.numeric(par1)
}
par2 <- as.numeric(par2)
par3 <- as.numeric(par3)
par4 <- as.numeric(par4)
par5 <- as.numeric(par5)
if (par6 == 'White Noise') par6 <- 'white' else par6 <- 'ma'
par7 <- as.numeric(par7)
if (par8 != '') par8 <- as.numeric(par8)
x <- na.omit(x)
ox <- x
if (par8 == '') {
if (par2 == 0) {
x <- log(x)
} else {
x <- (x ^ par2 - 1) / par2
}
} else {
x <- log(x,base=par8)
}
if (par3 > 0) x <- diff(x,lag=1,difference=par3)
if (par4 > 0) x <- diff(x,lag=par5,difference=par4)
bitmap(file='picts.png')
op <- par(mfrow=c(2,1))
plot(ox,type='l',main='Original Time Series',xlab='time',ylab='value')
if (par8=='') {
mytitle <- paste('Working Time Series (lambda=',par2,', d=',par3,', D=',par4,')',sep='')
mysub <- paste('(lambda=',par2,', d=',par3,', D=',par4,', CI=', par7, ', CI type=',par6,')',sep='')
} else {
mytitle <- paste('Working Time Series (base=',par8,', d=',par3,', D=',par4,')',sep='')
mysub <- paste('(base=',par8,', d=',par3,', D=',par4,', CI=', par7, ', CI type=',par6,')',sep='')
}
plot(x,type='l', main=mytitle,xlab='time',ylab='value')
par(op)
dev.off()
bitmap(file='pic1.png')
racf <- acf(x, par1, main='Autocorrelation', xlab='time lag', ylab='ACF', ci.type=par6, ci=par7, sub=mysub)
dev.off()
bitmap(file='pic2.png')
rpacf <- pacf(x,par1,main='Partial Autocorrelation',xlab='lags',ylab='PACF',sub=mysub)
dev.off()
(myacf <- c(racf$acf))
(mypacf <- c(rpacf$acf))
lengthx <- length(x)
sqrtn <- sqrt(lengthx)
load(file='createtable')
a<-table.start()
a<-table.row.start(a)
a<-table.element(a,'Autocorrelation Function',4,TRUE)
a<-table.row.end(a)
a<-table.row.start(a)
a<-table.element(a,'Time lag k',header=TRUE)
a<-table.element(a,'ACF(k)',header=TRUE)
a<-table.element(a,'T-STAT',header=TRUE)
a<-table.element(a,'P-value',header=TRUE)
a<-table.row.end(a)
for (i in 2:(par1+1)) {
a<-table.row.start(a)
a<-table.element(a,i-1,header=TRUE)
a<-table.element(a,round(myacf[i],6))
mytstat <- myacf[i]*sqrtn
a<-table.element(a,round(mytstat,4))
a<-table.element(a,round(1-pt(abs(mytstat),lengthx),6))
a<-table.row.end(a)
}
a<-table.end(a)
table.save(a,file='mytable.tab')
a<-table.start()
a<-table.row.start(a)
a<-table.element(a,'Partial Autocorrelation Function',4,TRUE)
a<-table.row.end(a)
a<-table.row.start(a)
a<-table.element(a,'Time lag k',header=TRUE)
a<-table.element(a,'PACF(k)',header=TRUE)
a<-table.element(a,'T-STAT',header=TRUE)
a<-table.element(a,'P-value',header=TRUE)
a<-table.row.end(a)
for (i in 1:par1) {
a<-table.row.start(a)
a<-table.element(a,i,header=TRUE)
a<-table.element(a,round(mypacf[i],6))
mytstat <- mypacf[i]*sqrtn
a<-table.element(a,round(mytstat,4))
a<-table.element(a,round(1-pt(abs(mytstat),lengthx),6))
a<-table.row.end(a)
}
a<-table.end(a)
table.save(a,file='mytable1.tab')