Free Statistics

of Irreproducible Research!

Author's title

Author*The author of this computation has been verified*
R Software Modulerwasp_spectrum.wasp
Title produced by softwareSpectral Analysis
Date of computationMon, 19 Dec 2016 17:47:49 +0100
Cite this page as followsStatistical Computations at FreeStatistics.org, Office for Research Development and Education, URL https://freestatistics.org/blog/index.php?v=date/2016/Dec/19/t1482166087pvdxs9yc6haoto8.htm/, Retrieved Fri, 17 May 2024 13:57:41 +0000
Statistical Computations at FreeStatistics.org, Office for Research Development and Education, URL https://freestatistics.org/blog/index.php?pk=301421, Retrieved Fri, 17 May 2024 13:57:41 +0000
QR Codes:

Original text written by user:
IsPrivate?No (this computation is public)
User-defined keywords
Estimated Impact67
Family? (F = Feedback message, R = changed R code, M = changed R Module, P = changed Parameters, D = changed Data)
-       [Spectral Analysis] [] [2016-12-19 16:47:49] [361c8dad91b3f1ef2e651cd04783c23b] [Current]
Feedback Forum

Post a new message
Dataseries X:
2755
2765
3000
2890
2940
3290
2815
3035
3070
3040
2685
2540
3090
2995
3440
3335
3205
3285
2790
3225
3360
3275
3505
3185
3470
3510
3840
3605
3655
3555
3140
3380
3255
3460
3245
3120
3265
3220
3140
3050
3300
2950
2630
2795
2840
2945
2790
2605
4590
4230
4245
4300
4475
3910
4100
3500
4390
3550
3865
3715
3310
3945
5050
4350
4060
4345
4360
4915
4650
4805
4775
4220
3975
3820
5515
4895
5535
4230
3695
5590
5000
4875
4360
4405
4500
4070
4800
4080
4850
4105
3805
5060
4060
4600
4635
3900
4120
3960
4400
3700
3970
4550
5140
5000
3650
4300
3650
3355
4000
3450
3295
3390
3415
3440
3680
3900
3965
4295
4210
4100
4690
3860
4250
4495
3800
3845


Summary of computational transaction
Raw Input view raw input (R code)
Raw Outputview raw output of R engine
Computing time1 seconds
R ServerBig Analytics Cloud Computing Center

\begin{tabular}{lllllllll}
\hline
Summary of computational transaction \tabularnewline
Raw Input view raw input (R code)  \tabularnewline
Raw Outputview raw output of R engine  \tabularnewline
Computing time1 seconds \tabularnewline
R ServerBig Analytics Cloud Computing Center \tabularnewline
\hline
\end{tabular}
%Source: https://freestatistics.org/blog/index.php?pk=301421&T=0

[TABLE]
[ROW]
Summary of computational transaction[/C][/ROW] [ROW]Raw Input[/C] view raw input (R code) [/C][/ROW] [ROW]Raw Output[/C]view raw output of R engine [/C][/ROW] [ROW]Computing time[/C]1 seconds[/C][/ROW] [ROW]R Server[/C]Big Analytics Cloud Computing Center[/C][/ROW] [/TABLE] Source: https://freestatistics.org/blog/index.php?pk=301421&T=0

Globally Unique Identifier (entire table): ba.freestatistics.org/blog/index.php?pk=301421&T=0

As an alternative you can also use a QR Code:  

The GUIDs for individual cells are displayed in the table below:

Summary of computational transaction
Raw Input view raw input (R code)
Raw Outputview raw output of R engine
Computing time1 seconds
R ServerBig Analytics Cloud Computing Center


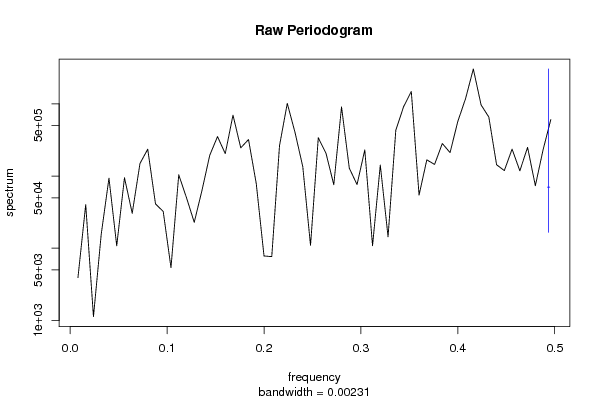
Raw Periodogram
ParameterValue
Box-Cox transformation parameter (lambda)1
Degree of non-seasonal differencing (d)1
Degree of seasonal differencing (D)0
Seasonal Period (s)12
Frequency (Period)Spectrum
0.008 (125)3924.487087
0.016 (62.5)40262.022414
0.024 (41.6667)1127.032607
0.032 (31.25)15560.892402
0.04 (25)93605.704271
0.048 (20.8333)10788.999088
0.056 (17.8571)94829.97792
0.064 (15.625)30498.662457
0.072 (13.8889)149043.727407
0.08 (12.5)235837.457922
0.088 (11.3636)41174.523936
0.096 (10.4167)32243.676287
0.104 (9.6154)5372.019107
0.112 (8.9286)104073.167234
0.12 (8.3333)50123.302401
0.128 (7.8125)22865.075666
0.136 (7.3529)63326.501283
0.144 (6.9444)193893.950389
0.152 (6.5789)352040.639873
0.16 (6.25)204505.947486
0.168 (5.9524)698388.740536
0.176 (5.6818)245801.641622
0.184 (5.4348)320401.365148
0.192 (5.2083)78504.71315
0.2 (5)7811.138457
0.208 (4.8077)7649.831606
0.216 (4.6296)263674.529641
0.224 (4.4643)1015766.415396
0.232 (4.3103)402136.352714
0.24 (4.1667)135140.620491
0.248 (4.0323)10945.388138
0.256 (3.9062)339489.324823
0.264 (3.7879)206226.646393
0.272 (3.6765)75809.930449
0.28 (3.5714)908346.604412
0.288 (3.4722)128438.32099
0.296 (3.3784)76322.888751
0.304 (3.2895)230296.042963
0.312 (3.2051)10844.395997
0.32 (3.125)142143.509707
0.328 (3.0488)14396.317495
0.336 (2.9762)429999.661276
0.344 (2.907)910197.463277
0.352 (2.8409)1484771.612106
0.36 (2.7778)54485.053901
0.368 (2.7174)167679.039881
0.376 (2.6596)144653.316644
0.384 (2.6042)282568.394596
0.392 (2.551)211142.297915
0.4 (2.5)571626.264979
0.408 (2.451)1183109.228438
0.416 (2.4038)3046062.962395
0.424 (2.3585)968057.664781
0.432 (2.3148)656265.20132
0.44 (2.2727)143412.181366
0.448 (2.2321)119051.005021
0.456 (2.193)236107.091552
0.464 (2.1552)118261.352341
0.472 (2.1186)249605.001589
0.48 (2.0833)73431.749747
0.488 (2.0492)231446.678559
0.496 (2.0161)608323.403726

\begin{tabular}{lllllllll}
\hline
Raw Periodogram \tabularnewline
Parameter & Value \tabularnewline
Box-Cox transformation parameter (lambda) & 1 \tabularnewline
Degree of non-seasonal differencing (d) & 1 \tabularnewline
Degree of seasonal differencing (D) & 0 \tabularnewline
Seasonal Period (s) & 12 \tabularnewline
Frequency (Period) & Spectrum \tabularnewline
0.008 (125) & 3924.487087 \tabularnewline
0.016 (62.5) & 40262.022414 \tabularnewline
0.024 (41.6667) & 1127.032607 \tabularnewline
0.032 (31.25) & 15560.892402 \tabularnewline
0.04 (25) & 93605.704271 \tabularnewline
0.048 (20.8333) & 10788.999088 \tabularnewline
0.056 (17.8571) & 94829.97792 \tabularnewline
0.064 (15.625) & 30498.662457 \tabularnewline
0.072 (13.8889) & 149043.727407 \tabularnewline
0.08 (12.5) & 235837.457922 \tabularnewline
0.088 (11.3636) & 41174.523936 \tabularnewline
0.096 (10.4167) & 32243.676287 \tabularnewline
0.104 (9.6154) & 5372.019107 \tabularnewline
0.112 (8.9286) & 104073.167234 \tabularnewline
0.12 (8.3333) & 50123.302401 \tabularnewline
0.128 (7.8125) & 22865.075666 \tabularnewline
0.136 (7.3529) & 63326.501283 \tabularnewline
0.144 (6.9444) & 193893.950389 \tabularnewline
0.152 (6.5789) & 352040.639873 \tabularnewline
0.16 (6.25) & 204505.947486 \tabularnewline
0.168 (5.9524) & 698388.740536 \tabularnewline
0.176 (5.6818) & 245801.641622 \tabularnewline
0.184 (5.4348) & 320401.365148 \tabularnewline
0.192 (5.2083) & 78504.71315 \tabularnewline
0.2 (5) & 7811.138457 \tabularnewline
0.208 (4.8077) & 7649.831606 \tabularnewline
0.216 (4.6296) & 263674.529641 \tabularnewline
0.224 (4.4643) & 1015766.415396 \tabularnewline
0.232 (4.3103) & 402136.352714 \tabularnewline
0.24 (4.1667) & 135140.620491 \tabularnewline
0.248 (4.0323) & 10945.388138 \tabularnewline
0.256 (3.9062) & 339489.324823 \tabularnewline
0.264 (3.7879) & 206226.646393 \tabularnewline
0.272 (3.6765) & 75809.930449 \tabularnewline
0.28 (3.5714) & 908346.604412 \tabularnewline
0.288 (3.4722) & 128438.32099 \tabularnewline
0.296 (3.3784) & 76322.888751 \tabularnewline
0.304 (3.2895) & 230296.042963 \tabularnewline
0.312 (3.2051) & 10844.395997 \tabularnewline
0.32 (3.125) & 142143.509707 \tabularnewline
0.328 (3.0488) & 14396.317495 \tabularnewline
0.336 (2.9762) & 429999.661276 \tabularnewline
0.344 (2.907) & 910197.463277 \tabularnewline
0.352 (2.8409) & 1484771.612106 \tabularnewline
0.36 (2.7778) & 54485.053901 \tabularnewline
0.368 (2.7174) & 167679.039881 \tabularnewline
0.376 (2.6596) & 144653.316644 \tabularnewline
0.384 (2.6042) & 282568.394596 \tabularnewline
0.392 (2.551) & 211142.297915 \tabularnewline
0.4 (2.5) & 571626.264979 \tabularnewline
0.408 (2.451) & 1183109.228438 \tabularnewline
0.416 (2.4038) & 3046062.962395 \tabularnewline
0.424 (2.3585) & 968057.664781 \tabularnewline
0.432 (2.3148) & 656265.20132 \tabularnewline
0.44 (2.2727) & 143412.181366 \tabularnewline
0.448 (2.2321) & 119051.005021 \tabularnewline
0.456 (2.193) & 236107.091552 \tabularnewline
0.464 (2.1552) & 118261.352341 \tabularnewline
0.472 (2.1186) & 249605.001589 \tabularnewline
0.48 (2.0833) & 73431.749747 \tabularnewline
0.488 (2.0492) & 231446.678559 \tabularnewline
0.496 (2.0161) & 608323.403726 \tabularnewline
\hline
\end{tabular}
%Source: https://freestatistics.org/blog/index.php?pk=301421&T=1

[TABLE]
[ROW][C]Raw Periodogram[/C][/ROW]
[ROW][C]Parameter[/C][C]Value[/C][/ROW]
[ROW][C]Box-Cox transformation parameter (lambda)[/C][C]1[/C][/ROW]
[ROW][C]Degree of non-seasonal differencing (d)[/C][C]1[/C][/ROW]
[ROW][C]Degree of seasonal differencing (D)[/C][C]0[/C][/ROW]
[ROW][C]Seasonal Period (s)[/C][C]12[/C][/ROW]
[ROW][C]Frequency (Period)[/C][C]Spectrum[/C][/ROW]
[ROW][C]0.008 (125)[/C][C]3924.487087[/C][/ROW]
[ROW][C]0.016 (62.5)[/C][C]40262.022414[/C][/ROW]
[ROW][C]0.024 (41.6667)[/C][C]1127.032607[/C][/ROW]
[ROW][C]0.032 (31.25)[/C][C]15560.892402[/C][/ROW]
[ROW][C]0.04 (25)[/C][C]93605.704271[/C][/ROW]
[ROW][C]0.048 (20.8333)[/C][C]10788.999088[/C][/ROW]
[ROW][C]0.056 (17.8571)[/C][C]94829.97792[/C][/ROW]
[ROW][C]0.064 (15.625)[/C][C]30498.662457[/C][/ROW]
[ROW][C]0.072 (13.8889)[/C][C]149043.727407[/C][/ROW]
[ROW][C]0.08 (12.5)[/C][C]235837.457922[/C][/ROW]
[ROW][C]0.088 (11.3636)[/C][C]41174.523936[/C][/ROW]
[ROW][C]0.096 (10.4167)[/C][C]32243.676287[/C][/ROW]
[ROW][C]0.104 (9.6154)[/C][C]5372.019107[/C][/ROW]
[ROW][C]0.112 (8.9286)[/C][C]104073.167234[/C][/ROW]
[ROW][C]0.12 (8.3333)[/C][C]50123.302401[/C][/ROW]
[ROW][C]0.128 (7.8125)[/C][C]22865.075666[/C][/ROW]
[ROW][C]0.136 (7.3529)[/C][C]63326.501283[/C][/ROW]
[ROW][C]0.144 (6.9444)[/C][C]193893.950389[/C][/ROW]
[ROW][C]0.152 (6.5789)[/C][C]352040.639873[/C][/ROW]
[ROW][C]0.16 (6.25)[/C][C]204505.947486[/C][/ROW]
[ROW][C]0.168 (5.9524)[/C][C]698388.740536[/C][/ROW]
[ROW][C]0.176 (5.6818)[/C][C]245801.641622[/C][/ROW]
[ROW][C]0.184 (5.4348)[/C][C]320401.365148[/C][/ROW]
[ROW][C]0.192 (5.2083)[/C][C]78504.71315[/C][/ROW]
[ROW][C]0.2 (5)[/C][C]7811.138457[/C][/ROW]
[ROW][C]0.208 (4.8077)[/C][C]7649.831606[/C][/ROW]
[ROW][C]0.216 (4.6296)[/C][C]263674.529641[/C][/ROW]
[ROW][C]0.224 (4.4643)[/C][C]1015766.415396[/C][/ROW]
[ROW][C]0.232 (4.3103)[/C][C]402136.352714[/C][/ROW]
[ROW][C]0.24 (4.1667)[/C][C]135140.620491[/C][/ROW]
[ROW][C]0.248 (4.0323)[/C][C]10945.388138[/C][/ROW]
[ROW][C]0.256 (3.9062)[/C][C]339489.324823[/C][/ROW]
[ROW][C]0.264 (3.7879)[/C][C]206226.646393[/C][/ROW]
[ROW][C]0.272 (3.6765)[/C][C]75809.930449[/C][/ROW]
[ROW][C]0.28 (3.5714)[/C][C]908346.604412[/C][/ROW]
[ROW][C]0.288 (3.4722)[/C][C]128438.32099[/C][/ROW]
[ROW][C]0.296 (3.3784)[/C][C]76322.888751[/C][/ROW]
[ROW][C]0.304 (3.2895)[/C][C]230296.042963[/C][/ROW]
[ROW][C]0.312 (3.2051)[/C][C]10844.395997[/C][/ROW]
[ROW][C]0.32 (3.125)[/C][C]142143.509707[/C][/ROW]
[ROW][C]0.328 (3.0488)[/C][C]14396.317495[/C][/ROW]
[ROW][C]0.336 (2.9762)[/C][C]429999.661276[/C][/ROW]
[ROW][C]0.344 (2.907)[/C][C]910197.463277[/C][/ROW]
[ROW][C]0.352 (2.8409)[/C][C]1484771.612106[/C][/ROW]
[ROW][C]0.36 (2.7778)[/C][C]54485.053901[/C][/ROW]
[ROW][C]0.368 (2.7174)[/C][C]167679.039881[/C][/ROW]
[ROW][C]0.376 (2.6596)[/C][C]144653.316644[/C][/ROW]
[ROW][C]0.384 (2.6042)[/C][C]282568.394596[/C][/ROW]
[ROW][C]0.392 (2.551)[/C][C]211142.297915[/C][/ROW]
[ROW][C]0.4 (2.5)[/C][C]571626.264979[/C][/ROW]
[ROW][C]0.408 (2.451)[/C][C]1183109.228438[/C][/ROW]
[ROW][C]0.416 (2.4038)[/C][C]3046062.962395[/C][/ROW]
[ROW][C]0.424 (2.3585)[/C][C]968057.664781[/C][/ROW]
[ROW][C]0.432 (2.3148)[/C][C]656265.20132[/C][/ROW]
[ROW][C]0.44 (2.2727)[/C][C]143412.181366[/C][/ROW]
[ROW][C]0.448 (2.2321)[/C][C]119051.005021[/C][/ROW]
[ROW][C]0.456 (2.193)[/C][C]236107.091552[/C][/ROW]
[ROW][C]0.464 (2.1552)[/C][C]118261.352341[/C][/ROW]
[ROW][C]0.472 (2.1186)[/C][C]249605.001589[/C][/ROW]
[ROW][C]0.48 (2.0833)[/C][C]73431.749747[/C][/ROW]
[ROW][C]0.488 (2.0492)[/C][C]231446.678559[/C][/ROW]
[ROW][C]0.496 (2.0161)[/C][C]608323.403726[/C][/ROW]
[/TABLE]
Source: https://freestatistics.org/blog/index.php?pk=301421&T=1

Globally Unique Identifier (entire table): ba.freestatistics.org/blog/index.php?pk=301421&T=1

As an alternative you can also use a QR Code:  

The GUIDs for individual cells are displayed in the table below:

Raw Periodogram
ParameterValue
Box-Cox transformation parameter (lambda)1
Degree of non-seasonal differencing (d)1
Degree of seasonal differencing (D)0
Seasonal Period (s)12
Frequency (Period)Spectrum
0.008 (125)3924.487087
0.016 (62.5)40262.022414
0.024 (41.6667)1127.032607
0.032 (31.25)15560.892402
0.04 (25)93605.704271
0.048 (20.8333)10788.999088
0.056 (17.8571)94829.97792
0.064 (15.625)30498.662457
0.072 (13.8889)149043.727407
0.08 (12.5)235837.457922
0.088 (11.3636)41174.523936
0.096 (10.4167)32243.676287
0.104 (9.6154)5372.019107
0.112 (8.9286)104073.167234
0.12 (8.3333)50123.302401
0.128 (7.8125)22865.075666
0.136 (7.3529)63326.501283
0.144 (6.9444)193893.950389
0.152 (6.5789)352040.639873
0.16 (6.25)204505.947486
0.168 (5.9524)698388.740536
0.176 (5.6818)245801.641622
0.184 (5.4348)320401.365148
0.192 (5.2083)78504.71315
0.2 (5)7811.138457
0.208 (4.8077)7649.831606
0.216 (4.6296)263674.529641
0.224 (4.4643)1015766.415396
0.232 (4.3103)402136.352714
0.24 (4.1667)135140.620491
0.248 (4.0323)10945.388138
0.256 (3.9062)339489.324823
0.264 (3.7879)206226.646393
0.272 (3.6765)75809.930449
0.28 (3.5714)908346.604412
0.288 (3.4722)128438.32099
0.296 (3.3784)76322.888751
0.304 (3.2895)230296.042963
0.312 (3.2051)10844.395997
0.32 (3.125)142143.509707
0.328 (3.0488)14396.317495
0.336 (2.9762)429999.661276
0.344 (2.907)910197.463277
0.352 (2.8409)1484771.612106
0.36 (2.7778)54485.053901
0.368 (2.7174)167679.039881
0.376 (2.6596)144653.316644
0.384 (2.6042)282568.394596
0.392 (2.551)211142.297915
0.4 (2.5)571626.264979
0.408 (2.451)1183109.228438
0.416 (2.4038)3046062.962395
0.424 (2.3585)968057.664781
0.432 (2.3148)656265.20132
0.44 (2.2727)143412.181366
0.448 (2.2321)119051.005021
0.456 (2.193)236107.091552
0.464 (2.1552)118261.352341
0.472 (2.1186)249605.001589
0.48 (2.0833)73431.749747
0.488 (2.0492)231446.678559
0.496 (2.0161)608323.403726


Parameters (Session):
par1 = 1 ; par2 = 1 ; par3 = 0 ; par4 = 12 ;
Parameters (R input):
par1 = 1 ; par2 = 1 ; par3 = 0 ; par4 = 12 ;
R code (references can be found in the software module):
par1 <- as.numeric(par1)
par2 <- as.numeric(par2)
par3 <- as.numeric(par3)
par4 <- as.numeric(par4)
if (par1 == 0) {
x <- log(x)
} else {
x <- (x ^ par1 - 1) / par1
}
if (par2 > 0) x <- diff(x,lag=1,difference=par2)
if (par3 > 0) x <- diff(x,lag=par4,difference=par3)
bitmap(file='test1.png')
r <- spectrum(x,main='Raw Periodogram')
dev.off()
bitmap(file='test2.png')
cpgram(x,main='Cumulative Periodogram')
dev.off()
load(file='createtable')
a<-table.start()
a<-table.row.start(a)
a<-table.element(a,'Raw Periodogram',2,TRUE)
a<-table.row.end(a)
a<-table.row.start(a)
a<-table.element(a,'Parameter',header=TRUE)
a<-table.element(a,'Value',header=TRUE)
a<-table.row.end(a)
a<-table.row.start(a)
a<-table.element(a,'Box-Cox transformation parameter (lambda)',header=TRUE)
a<-table.element(a,par1)
a<-table.row.end(a)
a<-table.row.start(a)
a<-table.element(a,'Degree of non-seasonal differencing (d)',header=TRUE)
a<-table.element(a,par2)
a<-table.row.end(a)
a<-table.row.start(a)
a<-table.element(a,'Degree of seasonal differencing (D)',header=TRUE)
a<-table.element(a,par3)
a<-table.row.end(a)
a<-table.row.start(a)
a<-table.element(a,'Seasonal Period (s)',header=TRUE)
a<-table.element(a,par4)
a<-table.row.end(a)
a<-table.row.start(a)
a<-table.element(a,'Frequency (Period)',header=TRUE)
a<-table.element(a,'Spectrum',header=TRUE)
a<-table.row.end(a)
for (i in 1:length(r$freq)) {
a<-table.row.start(a)
mylab <- round(r$freq[i],4)
mylab <- paste(mylab,' (',sep='')
mylab <- paste(mylab,round(1/r$freq[i],4),sep='')
mylab <- paste(mylab,')',sep='')
a<-table.element(a,mylab,header=TRUE)
a<-table.element(a,round(r$spec[i],6))
a<-table.row.end(a)
}
a<-table.end(a)
table.save(a,file='mytable.tab')