Free Statistics

of Irreproducible Research!

Author's title

Author*The author of this computation has been verified*
R Software Modulerwasp_multipleregression.wasp
Title produced by softwareMultiple Regression
Date of computationMon, 19 Dec 2016 15:35:18 +0100
Cite this page as followsStatistical Computations at FreeStatistics.org, Office for Research Development and Education, URL https://freestatistics.org/blog/index.php?v=date/2016/Dec/19/t1482158161b9os09vqrtz8xgt.htm/, Retrieved Fri, 17 May 2024 16:08:50 +0000
Statistical Computations at FreeStatistics.org, Office for Research Development and Education, URL https://freestatistics.org/blog/index.php?pk=301370, Retrieved Fri, 17 May 2024 16:08:50 +0000
QR Codes:

Original text written by user:
IsPrivate?No (this computation is public)
User-defined keywords
Estimated Impact71
Family? (F = Feedback message, R = changed R code, M = changed R Module, P = changed Parameters, D = changed Data)
-       [Multiple Regression] [Multiple regression ] [2016-12-19 14:35:18] [9fb47d69755d1f4b66b6f2591280f9e0] [Current]
Feedback Forum

Post a new message
Dataseries X:
13	4	2	3
16	5	3	4
17	4	4	4
NA	3	4	3
NA	4	4	4
16	3	4	4
NA	3	4	3
NA	3	4	4
NA	4	5	4
17	4	5	4
17	4	4	4
15	4	4	3
16	4	4	3
14	3	3	4
16	4	4	4
17	3	4	4
NA	3	4	4
NA	NA	NA	NA
NA	5	5	3
NA	4	4	4
16	3	4	3
NA	4	4	4
16	4	4	4
NA	4	4	4
NA	4	4	4
NA	3	4	4
16	3	4	3
15	4	4	4
16	2	4	4
16	5	4	4
13	4	3	4
15	4	5	4
17	5	4	4
NA	4	3	4
13	2	3	4
17	4	5	4
NA	3	4	4
14	4	3	3
14	4	3	4
18	4	4	4
NA	5	4	4
17	4	5	4
13	3	3	4
16	5	5	3
15	5	4	3
15	4	4	3
NA	4	4	4
15	3	5	3
13	4	4	4
NA	2	3	2
17	4	5	4
NA	5	5	4
NA	5	5	4
11	4	3	4
14	4	3	3
13	4	4	4
NA	3	4	3
17	3	4	4
16	4	4	3
NA	4	4	4
17	5	5	4
16	2	4	4
16	4	4	4
16	3	4	4
15	4	4	4
12	4	2	4
17	4	4	3
14	4	4	3
14	5	4	3
16	3	4	3
NA	3	4	3
NA	4	5	5
NA	4	4	4
NA	4	4	4
NA	4	4	5
15	3	4	4
16	4	4	4
14	3	4	3
15	3	3	4
17	4	3	4
NA	4	4	4
10	3	3	4
NA	4	4	4
17	4	4	4
NA	4	4	4
20	5	4	4
17	5	4	5
18	4	4	4
NA	3	4	4
17	3	NA	4
14	4	2	3
NA	4	4	4
17	4	4	4
NA	4	4	4
17	4	5	4
NA	3	4	3
16	4	4	4
18	5	4	4
18	5	4	5
16	4	5	4
NA	3	4	4
NA	5	3	4
15	4	4	4
13	5	4	4
NA	3	4	3
NA	5	4	5
NA	4	4	3
NA	4	4	3
NA	4	4	4
16	4	4	4
NA	3	4	4
NA	4	4	4
NA	4	4	3
12	3	3	3
NA	4	4	3
16	3	4	4
16	4	4	4
NA	5	4	1
16	5	4	4
14	4	4	4
15	4	4	3
14	3	4	3
NA	4	4	4
15	4	4	4
NA	4	5	4
15	3	4	4
16	4	4	3
NA	4	4	4
NA	3	4	3
NA	4	4	3
11	3	2	2
NA	4	4	3
18	5	4	3
NA	2	4	3
11	3	3	4
NA	4	4	3
18	5	5	4
NA	NA	NA	NA
15	4	5	4
19	5	5	5
17	4	5	4
NA	4	4	3
14	3	4	4
NA	4	4	4
13	4	4	4
17	4	4	4
14	4	4	4
19	5	4	3
14	4	3	4
NA	4	4	4
NA	3	3	3
16	4	5	4
16	4	4	3
15	4	4	4
12	3	4	3
NA	4	4	4
17	5	4	4
NA	4	4	4
NA	2	3	4
18	4	4	4
15	4	3	3
18	4	4	4
15	4	5	5
NA	5	4	4
NA	5	4	3
NA	3	3	4
16	4	4	4
NA	4	4	4
16	2	3	5


Summary of computational transaction
Raw Input view raw input (R code)
Raw Outputview raw output of R engine
Computing time7 seconds
R ServerBig Analytics Cloud Computing Center

\begin{tabular}{lllllllll}
\hline
Summary of computational transaction \tabularnewline
Raw Input view raw input (R code)  \tabularnewline
Raw Outputview raw output of R engine  \tabularnewline
Computing time7 seconds \tabularnewline
R ServerBig Analytics Cloud Computing Center \tabularnewline
\hline
\end{tabular}
%Source: https://freestatistics.org/blog/index.php?pk=301370&T=0

[TABLE]
[ROW]
Summary of computational transaction[/C][/ROW] [ROW]Raw Input[/C] view raw input (R code) [/C][/ROW] [ROW]Raw Output[/C]view raw output of R engine [/C][/ROW] [ROW]Computing time[/C]7 seconds[/C][/ROW] [ROW]R Server[/C]Big Analytics Cloud Computing Center[/C][/ROW] [/TABLE] Source: https://freestatistics.org/blog/index.php?pk=301370&T=0

Globally Unique Identifier (entire table): ba.freestatistics.org/blog/index.php?pk=301370&T=0

As an alternative you can also use a QR Code:  

The GUIDs for individual cells are displayed in the table below:

Summary of computational transaction
Raw Input view raw input (R code)
Raw Outputview raw output of R engine
Computing time7 seconds
R ServerBig Analytics Cloud Computing Center


Multiple Linear Regression - Estimated Regression Equation
a[t] = + 6.47204 + 0.653687b[t] + 1.22044d[t] + 0.48177e[t] -0.00265787t + e[t]

\begin{tabular}{lllllllll}
\hline
Multiple Linear Regression - Estimated Regression Equation \tabularnewline
a[t] =  +  6.47204 +  0.653687b[t] +  1.22044d[t] +  0.48177e[t] -0.00265787t  + e[t] \tabularnewline
 \tabularnewline
\hline
\end{tabular}
%Source: https://freestatistics.org/blog/index.php?pk=301370&T=1

[TABLE]
[ROW][C]Multiple Linear Regression - Estimated Regression Equation[/C][/ROW]
[ROW][C]a[t] =  +  6.47204 +  0.653687b[t] +  1.22044d[t] +  0.48177e[t] -0.00265787t  + e[t][/C][/ROW]
[ROW][C][/C][/ROW]
[/TABLE]
Source: https://freestatistics.org/blog/index.php?pk=301370&T=1

Globally Unique Identifier (entire table): ba.freestatistics.org/blog/index.php?pk=301370&T=1

As an alternative you can also use a QR Code:  

The GUIDs for individual cells are displayed in the table below:

Multiple Linear Regression - Estimated Regression Equation
a[t] = + 6.47204 + 0.653687b[t] + 1.22044d[t] + 0.48177e[t] -0.00265787t + e[t]


Multiple Linear Regression - Ordinary Least Squares
VariableParameterS.D.T-STATH0: parameter = 02-tail p-value1-tail p-value
(Intercept)+6.472 1.352+4.7860e+00 6.081e-06 3.041e-06
b+0.6537 0.2119+3.0850e+00 0.002649 0.001325
d+1.22 0.2308+5.2880e+00 7.628e-07 3.814e-07
e+0.4818 0.2834+1.7000e+00 0.0923 0.04615
t-0.002658 0.005131-5.1800e-01 0.6057 0.3028

\begin{tabular}{lllllllll}
\hline
Multiple Linear Regression - Ordinary Least Squares \tabularnewline
Variable & Parameter & S.D. & T-STATH0: parameter = 0 & 2-tail p-value & 1-tail p-value \tabularnewline
(Intercept) & +6.472 &  1.352 & +4.7860e+00 &  6.081e-06 &  3.041e-06 \tabularnewline
b & +0.6537 &  0.2119 & +3.0850e+00 &  0.002649 &  0.001325 \tabularnewline
d & +1.22 &  0.2308 & +5.2880e+00 &  7.628e-07 &  3.814e-07 \tabularnewline
e & +0.4818 &  0.2834 & +1.7000e+00 &  0.0923 &  0.04615 \tabularnewline
t & -0.002658 &  0.005131 & -5.1800e-01 &  0.6057 &  0.3028 \tabularnewline
\hline
\end{tabular}
%Source: https://freestatistics.org/blog/index.php?pk=301370&T=2

[TABLE]
[ROW][C]Multiple Linear Regression - Ordinary Least Squares[/C][/ROW]
[ROW][C]Variable[/C][C]Parameter[/C][C]S.D.[/C][C]T-STATH0: parameter = 0[/C][C]2-tail p-value[/C][C]1-tail p-value[/C][/ROW]
[ROW][C](Intercept)[/C][C]+6.472[/C][C] 1.352[/C][C]+4.7860e+00[/C][C] 6.081e-06[/C][C] 3.041e-06[/C][/ROW]
[ROW][C]b[/C][C]+0.6537[/C][C] 0.2119[/C][C]+3.0850e+00[/C][C] 0.002649[/C][C] 0.001325[/C][/ROW]
[ROW][C]d[/C][C]+1.22[/C][C] 0.2308[/C][C]+5.2880e+00[/C][C] 7.628e-07[/C][C] 3.814e-07[/C][/ROW]
[ROW][C]e[/C][C]+0.4818[/C][C] 0.2834[/C][C]+1.7000e+00[/C][C] 0.0923[/C][C] 0.04615[/C][/ROW]
[ROW][C]t[/C][C]-0.002658[/C][C] 0.005131[/C][C]-5.1800e-01[/C][C] 0.6057[/C][C] 0.3028[/C][/ROW]
[/TABLE]
Source: https://freestatistics.org/blog/index.php?pk=301370&T=2

Globally Unique Identifier (entire table): ba.freestatistics.org/blog/index.php?pk=301370&T=2

As an alternative you can also use a QR Code:  

The GUIDs for individual cells are displayed in the table below:

Multiple Linear Regression - Ordinary Least Squares
VariableParameterS.D.T-STATH0: parameter = 02-tail p-value1-tail p-value
(Intercept)+6.472 1.352+4.7860e+00 6.081e-06 3.041e-06
b+0.6537 0.2119+3.0850e+00 0.002649 0.001325
d+1.22 0.2308+5.2880e+00 7.628e-07 3.814e-07
e+0.4818 0.2834+1.7000e+00 0.0923 0.04615
t-0.002658 0.005131-5.1800e-01 0.6057 0.3028


Multiple Linear Regression - Regression Statistics
Multiple R 0.6136
R-squared 0.3764
Adjusted R-squared 0.3507
F-TEST (value) 14.64
F-TEST (DF numerator)4
F-TEST (DF denominator)97
p-value 2.168e-09
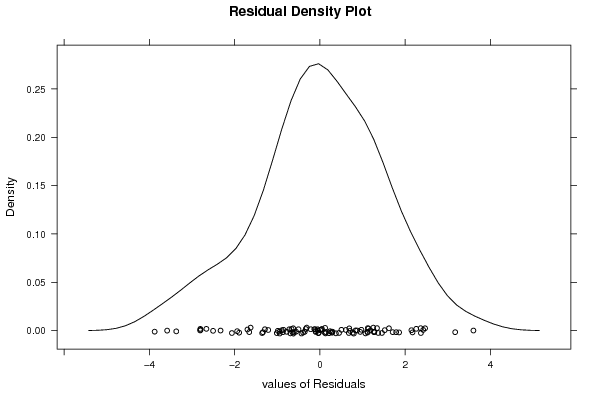
Multiple Linear Regression - Residual Statistics
Residual Standard Deviation 1.511
Sum Squared Residuals 221.6

\begin{tabular}{lllllllll}
\hline
Multiple Linear Regression - Regression Statistics \tabularnewline
Multiple R &  0.6136 \tabularnewline
R-squared &  0.3764 \tabularnewline
Adjusted R-squared &  0.3507 \tabularnewline
F-TEST (value) &  14.64 \tabularnewline
F-TEST (DF numerator) & 4 \tabularnewline
F-TEST (DF denominator) & 97 \tabularnewline
p-value &  2.168e-09 \tabularnewline
Multiple Linear Regression - Residual Statistics \tabularnewline
Residual Standard Deviation &  1.511 \tabularnewline
Sum Squared Residuals &  221.6 \tabularnewline
\hline
\end{tabular}
%Source: https://freestatistics.org/blog/index.php?pk=301370&T=3

[TABLE]
[ROW][C]Multiple Linear Regression - Regression Statistics[/C][/ROW]
[ROW][C]Multiple R[/C][C] 0.6136[/C][/ROW]
[ROW][C]R-squared[/C][C] 0.3764[/C][/ROW]
[ROW][C]Adjusted R-squared[/C][C] 0.3507[/C][/ROW]
[ROW][C]F-TEST (value)[/C][C] 14.64[/C][/ROW]
[ROW][C]F-TEST (DF numerator)[/C][C]4[/C][/ROW]
[ROW][C]F-TEST (DF denominator)[/C][C]97[/C][/ROW]
[ROW][C]p-value[/C][C] 2.168e-09[/C][/ROW]
[ROW][C]Multiple Linear Regression - Residual Statistics[/C][/ROW]
[ROW][C]Residual Standard Deviation[/C][C] 1.511[/C][/ROW]
[ROW][C]Sum Squared Residuals[/C][C] 221.6[/C][/ROW]
[/TABLE]
Source: https://freestatistics.org/blog/index.php?pk=301370&T=3

Globally Unique Identifier (entire table): ba.freestatistics.org/blog/index.php?pk=301370&T=3

As an alternative you can also use a QR Code:  

The GUIDs for individual cells are displayed in the table below:

Multiple Linear Regression - Regression Statistics
Multiple R 0.6136
R-squared 0.3764
Adjusted R-squared 0.3507
F-TEST (value) 14.64
F-TEST (DF numerator)4
F-TEST (DF denominator)97
p-value 2.168e-09
Multiple Linear Regression - Residual Statistics
Residual Standard Deviation 1.511
Sum Squared Residuals 221.6


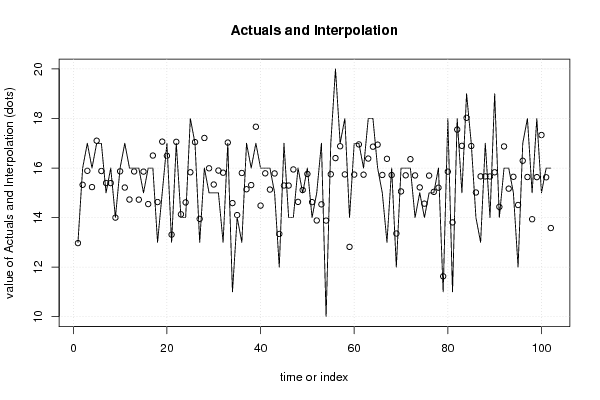
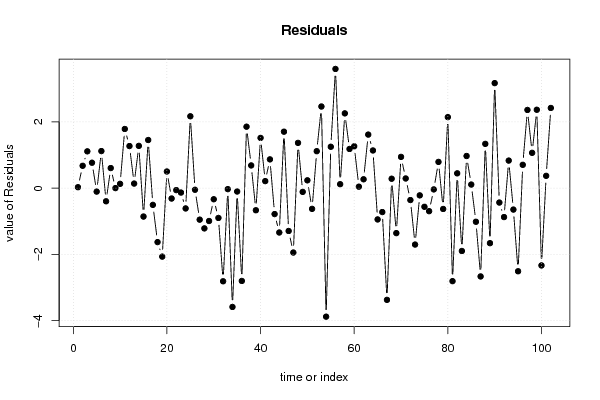
Multiple Linear Regression - Actuals, Interpolation, and Residuals
Time or IndexActualsInterpolationForecastResidualsPrediction Error
1 13 12.97 0.02969
2 16 15.32 0.6765
3 17 15.89 1.112
4 16 15.23 0.7687
5 17 17.1-0.1028
6 17 15.88 1.12
7 15 15.4-0.3952
8 16 15.39 0.6074
9 14 14 0.002433
10 16 15.87 0.131
11 17 15.21 1.787
12 16 14.73 1.272
13 16 15.86 0.1389
14 16 14.72 1.277
15 15 15.86-0.8557
16 16 14.55 1.454
17 16 16.5-0.5041
18 13 14.63-1.627
19 15 17.07-2.066
20 17 16.5 0.5039
21 13 13.31-0.312
22 17 17.06-0.05758
23 14 14.13-0.1323
24 14 14.61-0.6114
25 18 15.83 2.171
26 17 17.05-0.04695
27 13 13.95-0.9497
28 16 17.21-1.214
29 15 15.99-0.9905
30 15 15.33-0.3341
31 15 15.9-0.8982
32 13 15.81-2.811
33 17 17.03-0.02834
34 11 14.58-3.585
35 14 14.1-0.1004
36 13 15.8-2.8
37 17 15.14 1.856
38 16 15.31 0.6872
39 17 17.67-0.6661
40 16 14.48 1.518
41 16 15.79 0.2134
42 16 15.13 0.8697
43 15 15.78-0.7813
44 12 13.34-1.338
45 17 15.29 1.706
46 14 15.29-1.292
47 14 15.94-1.943
48 16 14.63 1.367
49 15 15.11-0.1117
50 16 15.76 0.2373
51 14 14.62-0.6246
52 15 13.88 1.117
53 17 14.53 2.466
54 10 13.88-3.878
55 17 15.75 1.251
56 20 16.4 3.6
57 17 16.88 0.1204
58 18 15.74 2.259
59 14 12.82 1.184
60 17 15.74 1.264
61 17 16.95 0.04608
62 16 15.73 0.2692
63 18 16.38 1.618
64 18 16.86 1.139
65 16 16.94-0.9433
66 15 15.72-0.7202
67 13 16.37-3.371
68 16 15.71 0.2851
69 12 13.36-1.356
70 16 15.06 0.9441
71 16 15.71 0.2931
72 16 16.36-0.3579
73 14 15.7-1.702
74 15 15.22-0.2172
75 14 14.56-0.5608
76 15 15.69-0.6936
77 15 15.04-0.03727
78 16 15.21 0.7935
79 11 11.63-0.6275
80 18 15.85 2.145
81 11 13.81-2.806
82 18 17.55 0.4482
83 15 16.9-1.895
84 19 18.03 0.9718
85 17 16.89 0.1099
86 14 15.01-1.013
87 13 15.66-2.664
88 17 15.66 1.338
89 14 15.66-1.659
90 19 15.83 3.172
91 14 14.43-0.4333
92 16 16.87-0.8715
93 16 15.17 0.8333
94 15 15.65-0.6458
95 12 14.51-2.508
96 17 16.29 0.7059
97 18 15.64 2.362
98 15 13.93 1.067
99 18 15.63 2.368
100 15 17.33-2.332
101 16 15.63 0.3728
102 16 13.58 2.422

\begin{tabular}{lllllllll}
\hline
Multiple Linear Regression - Actuals, Interpolation, and Residuals \tabularnewline
Time or Index & Actuals & InterpolationForecast & ResidualsPrediction Error \tabularnewline
1 &  13 &  12.97 &  0.02969 \tabularnewline
2 &  16 &  15.32 &  0.6765 \tabularnewline
3 &  17 &  15.89 &  1.112 \tabularnewline
4 &  16 &  15.23 &  0.7687 \tabularnewline
5 &  17 &  17.1 & -0.1028 \tabularnewline
6 &  17 &  15.88 &  1.12 \tabularnewline
7 &  15 &  15.4 & -0.3952 \tabularnewline
8 &  16 &  15.39 &  0.6074 \tabularnewline
9 &  14 &  14 &  0.002433 \tabularnewline
10 &  16 &  15.87 &  0.131 \tabularnewline
11 &  17 &  15.21 &  1.787 \tabularnewline
12 &  16 &  14.73 &  1.272 \tabularnewline
13 &  16 &  15.86 &  0.1389 \tabularnewline
14 &  16 &  14.72 &  1.277 \tabularnewline
15 &  15 &  15.86 & -0.8557 \tabularnewline
16 &  16 &  14.55 &  1.454 \tabularnewline
17 &  16 &  16.5 & -0.5041 \tabularnewline
18 &  13 &  14.63 & -1.627 \tabularnewline
19 &  15 &  17.07 & -2.066 \tabularnewline
20 &  17 &  16.5 &  0.5039 \tabularnewline
21 &  13 &  13.31 & -0.312 \tabularnewline
22 &  17 &  17.06 & -0.05758 \tabularnewline
23 &  14 &  14.13 & -0.1323 \tabularnewline
24 &  14 &  14.61 & -0.6114 \tabularnewline
25 &  18 &  15.83 &  2.171 \tabularnewline
26 &  17 &  17.05 & -0.04695 \tabularnewline
27 &  13 &  13.95 & -0.9497 \tabularnewline
28 &  16 &  17.21 & -1.214 \tabularnewline
29 &  15 &  15.99 & -0.9905 \tabularnewline
30 &  15 &  15.33 & -0.3341 \tabularnewline
31 &  15 &  15.9 & -0.8982 \tabularnewline
32 &  13 &  15.81 & -2.811 \tabularnewline
33 &  17 &  17.03 & -0.02834 \tabularnewline
34 &  11 &  14.58 & -3.585 \tabularnewline
35 &  14 &  14.1 & -0.1004 \tabularnewline
36 &  13 &  15.8 & -2.8 \tabularnewline
37 &  17 &  15.14 &  1.856 \tabularnewline
38 &  16 &  15.31 &  0.6872 \tabularnewline
39 &  17 &  17.67 & -0.6661 \tabularnewline
40 &  16 &  14.48 &  1.518 \tabularnewline
41 &  16 &  15.79 &  0.2134 \tabularnewline
42 &  16 &  15.13 &  0.8697 \tabularnewline
43 &  15 &  15.78 & -0.7813 \tabularnewline
44 &  12 &  13.34 & -1.338 \tabularnewline
45 &  17 &  15.29 &  1.706 \tabularnewline
46 &  14 &  15.29 & -1.292 \tabularnewline
47 &  14 &  15.94 & -1.943 \tabularnewline
48 &  16 &  14.63 &  1.367 \tabularnewline
49 &  15 &  15.11 & -0.1117 \tabularnewline
50 &  16 &  15.76 &  0.2373 \tabularnewline
51 &  14 &  14.62 & -0.6246 \tabularnewline
52 &  15 &  13.88 &  1.117 \tabularnewline
53 &  17 &  14.53 &  2.466 \tabularnewline
54 &  10 &  13.88 & -3.878 \tabularnewline
55 &  17 &  15.75 &  1.251 \tabularnewline
56 &  20 &  16.4 &  3.6 \tabularnewline
57 &  17 &  16.88 &  0.1204 \tabularnewline
58 &  18 &  15.74 &  2.259 \tabularnewline
59 &  14 &  12.82 &  1.184 \tabularnewline
60 &  17 &  15.74 &  1.264 \tabularnewline
61 &  17 &  16.95 &  0.04608 \tabularnewline
62 &  16 &  15.73 &  0.2692 \tabularnewline
63 &  18 &  16.38 &  1.618 \tabularnewline
64 &  18 &  16.86 &  1.139 \tabularnewline
65 &  16 &  16.94 & -0.9433 \tabularnewline
66 &  15 &  15.72 & -0.7202 \tabularnewline
67 &  13 &  16.37 & -3.371 \tabularnewline
68 &  16 &  15.71 &  0.2851 \tabularnewline
69 &  12 &  13.36 & -1.356 \tabularnewline
70 &  16 &  15.06 &  0.9441 \tabularnewline
71 &  16 &  15.71 &  0.2931 \tabularnewline
72 &  16 &  16.36 & -0.3579 \tabularnewline
73 &  14 &  15.7 & -1.702 \tabularnewline
74 &  15 &  15.22 & -0.2172 \tabularnewline
75 &  14 &  14.56 & -0.5608 \tabularnewline
76 &  15 &  15.69 & -0.6936 \tabularnewline
77 &  15 &  15.04 & -0.03727 \tabularnewline
78 &  16 &  15.21 &  0.7935 \tabularnewline
79 &  11 &  11.63 & -0.6275 \tabularnewline
80 &  18 &  15.85 &  2.145 \tabularnewline
81 &  11 &  13.81 & -2.806 \tabularnewline
82 &  18 &  17.55 &  0.4482 \tabularnewline
83 &  15 &  16.9 & -1.895 \tabularnewline
84 &  19 &  18.03 &  0.9718 \tabularnewline
85 &  17 &  16.89 &  0.1099 \tabularnewline
86 &  14 &  15.01 & -1.013 \tabularnewline
87 &  13 &  15.66 & -2.664 \tabularnewline
88 &  17 &  15.66 &  1.338 \tabularnewline
89 &  14 &  15.66 & -1.659 \tabularnewline
90 &  19 &  15.83 &  3.172 \tabularnewline
91 &  14 &  14.43 & -0.4333 \tabularnewline
92 &  16 &  16.87 & -0.8715 \tabularnewline
93 &  16 &  15.17 &  0.8333 \tabularnewline
94 &  15 &  15.65 & -0.6458 \tabularnewline
95 &  12 &  14.51 & -2.508 \tabularnewline
96 &  17 &  16.29 &  0.7059 \tabularnewline
97 &  18 &  15.64 &  2.362 \tabularnewline
98 &  15 &  13.93 &  1.067 \tabularnewline
99 &  18 &  15.63 &  2.368 \tabularnewline
100 &  15 &  17.33 & -2.332 \tabularnewline
101 &  16 &  15.63 &  0.3728 \tabularnewline
102 &  16 &  13.58 &  2.422 \tabularnewline
\hline
\end{tabular}
%Source: https://freestatistics.org/blog/index.php?pk=301370&T=4

[TABLE]
[ROW][C]Multiple Linear Regression - Actuals, Interpolation, and Residuals[/C][/ROW]
[ROW][C]Time or Index[/C][C]Actuals[/C][C]InterpolationForecast[/C][C]ResidualsPrediction Error[/C][/ROW]
[ROW][C]1[/C][C] 13[/C][C] 12.97[/C][C] 0.02969[/C][/ROW]
[ROW][C]2[/C][C] 16[/C][C] 15.32[/C][C] 0.6765[/C][/ROW]
[ROW][C]3[/C][C] 17[/C][C] 15.89[/C][C] 1.112[/C][/ROW]
[ROW][C]4[/C][C] 16[/C][C] 15.23[/C][C] 0.7687[/C][/ROW]
[ROW][C]5[/C][C] 17[/C][C] 17.1[/C][C]-0.1028[/C][/ROW]
[ROW][C]6[/C][C] 17[/C][C] 15.88[/C][C] 1.12[/C][/ROW]
[ROW][C]7[/C][C] 15[/C][C] 15.4[/C][C]-0.3952[/C][/ROW]
[ROW][C]8[/C][C] 16[/C][C] 15.39[/C][C] 0.6074[/C][/ROW]
[ROW][C]9[/C][C] 14[/C][C] 14[/C][C] 0.002433[/C][/ROW]
[ROW][C]10[/C][C] 16[/C][C] 15.87[/C][C] 0.131[/C][/ROW]
[ROW][C]11[/C][C] 17[/C][C] 15.21[/C][C] 1.787[/C][/ROW]
[ROW][C]12[/C][C] 16[/C][C] 14.73[/C][C] 1.272[/C][/ROW]
[ROW][C]13[/C][C] 16[/C][C] 15.86[/C][C] 0.1389[/C][/ROW]
[ROW][C]14[/C][C] 16[/C][C] 14.72[/C][C] 1.277[/C][/ROW]
[ROW][C]15[/C][C] 15[/C][C] 15.86[/C][C]-0.8557[/C][/ROW]
[ROW][C]16[/C][C] 16[/C][C] 14.55[/C][C] 1.454[/C][/ROW]
[ROW][C]17[/C][C] 16[/C][C] 16.5[/C][C]-0.5041[/C][/ROW]
[ROW][C]18[/C][C] 13[/C][C] 14.63[/C][C]-1.627[/C][/ROW]
[ROW][C]19[/C][C] 15[/C][C] 17.07[/C][C]-2.066[/C][/ROW]
[ROW][C]20[/C][C] 17[/C][C] 16.5[/C][C] 0.5039[/C][/ROW]
[ROW][C]21[/C][C] 13[/C][C] 13.31[/C][C]-0.312[/C][/ROW]
[ROW][C]22[/C][C] 17[/C][C] 17.06[/C][C]-0.05758[/C][/ROW]
[ROW][C]23[/C][C] 14[/C][C] 14.13[/C][C]-0.1323[/C][/ROW]
[ROW][C]24[/C][C] 14[/C][C] 14.61[/C][C]-0.6114[/C][/ROW]
[ROW][C]25[/C][C] 18[/C][C] 15.83[/C][C] 2.171[/C][/ROW]
[ROW][C]26[/C][C] 17[/C][C] 17.05[/C][C]-0.04695[/C][/ROW]
[ROW][C]27[/C][C] 13[/C][C] 13.95[/C][C]-0.9497[/C][/ROW]
[ROW][C]28[/C][C] 16[/C][C] 17.21[/C][C]-1.214[/C][/ROW]
[ROW][C]29[/C][C] 15[/C][C] 15.99[/C][C]-0.9905[/C][/ROW]
[ROW][C]30[/C][C] 15[/C][C] 15.33[/C][C]-0.3341[/C][/ROW]
[ROW][C]31[/C][C] 15[/C][C] 15.9[/C][C]-0.8982[/C][/ROW]
[ROW][C]32[/C][C] 13[/C][C] 15.81[/C][C]-2.811[/C][/ROW]
[ROW][C]33[/C][C] 17[/C][C] 17.03[/C][C]-0.02834[/C][/ROW]
[ROW][C]34[/C][C] 11[/C][C] 14.58[/C][C]-3.585[/C][/ROW]
[ROW][C]35[/C][C] 14[/C][C] 14.1[/C][C]-0.1004[/C][/ROW]
[ROW][C]36[/C][C] 13[/C][C] 15.8[/C][C]-2.8[/C][/ROW]
[ROW][C]37[/C][C] 17[/C][C] 15.14[/C][C] 1.856[/C][/ROW]
[ROW][C]38[/C][C] 16[/C][C] 15.31[/C][C] 0.6872[/C][/ROW]
[ROW][C]39[/C][C] 17[/C][C] 17.67[/C][C]-0.6661[/C][/ROW]
[ROW][C]40[/C][C] 16[/C][C] 14.48[/C][C] 1.518[/C][/ROW]
[ROW][C]41[/C][C] 16[/C][C] 15.79[/C][C] 0.2134[/C][/ROW]
[ROW][C]42[/C][C] 16[/C][C] 15.13[/C][C] 0.8697[/C][/ROW]
[ROW][C]43[/C][C] 15[/C][C] 15.78[/C][C]-0.7813[/C][/ROW]
[ROW][C]44[/C][C] 12[/C][C] 13.34[/C][C]-1.338[/C][/ROW]
[ROW][C]45[/C][C] 17[/C][C] 15.29[/C][C] 1.706[/C][/ROW]
[ROW][C]46[/C][C] 14[/C][C] 15.29[/C][C]-1.292[/C][/ROW]
[ROW][C]47[/C][C] 14[/C][C] 15.94[/C][C]-1.943[/C][/ROW]
[ROW][C]48[/C][C] 16[/C][C] 14.63[/C][C] 1.367[/C][/ROW]
[ROW][C]49[/C][C] 15[/C][C] 15.11[/C][C]-0.1117[/C][/ROW]
[ROW][C]50[/C][C] 16[/C][C] 15.76[/C][C] 0.2373[/C][/ROW]
[ROW][C]51[/C][C] 14[/C][C] 14.62[/C][C]-0.6246[/C][/ROW]
[ROW][C]52[/C][C] 15[/C][C] 13.88[/C][C] 1.117[/C][/ROW]
[ROW][C]53[/C][C] 17[/C][C] 14.53[/C][C] 2.466[/C][/ROW]
[ROW][C]54[/C][C] 10[/C][C] 13.88[/C][C]-3.878[/C][/ROW]
[ROW][C]55[/C][C] 17[/C][C] 15.75[/C][C] 1.251[/C][/ROW]
[ROW][C]56[/C][C] 20[/C][C] 16.4[/C][C] 3.6[/C][/ROW]
[ROW][C]57[/C][C] 17[/C][C] 16.88[/C][C] 0.1204[/C][/ROW]
[ROW][C]58[/C][C] 18[/C][C] 15.74[/C][C] 2.259[/C][/ROW]
[ROW][C]59[/C][C] 14[/C][C] 12.82[/C][C] 1.184[/C][/ROW]
[ROW][C]60[/C][C] 17[/C][C] 15.74[/C][C] 1.264[/C][/ROW]
[ROW][C]61[/C][C] 17[/C][C] 16.95[/C][C] 0.04608[/C][/ROW]
[ROW][C]62[/C][C] 16[/C][C] 15.73[/C][C] 0.2692[/C][/ROW]
[ROW][C]63[/C][C] 18[/C][C] 16.38[/C][C] 1.618[/C][/ROW]
[ROW][C]64[/C][C] 18[/C][C] 16.86[/C][C] 1.139[/C][/ROW]
[ROW][C]65[/C][C] 16[/C][C] 16.94[/C][C]-0.9433[/C][/ROW]
[ROW][C]66[/C][C] 15[/C][C] 15.72[/C][C]-0.7202[/C][/ROW]
[ROW][C]67[/C][C] 13[/C][C] 16.37[/C][C]-3.371[/C][/ROW]
[ROW][C]68[/C][C] 16[/C][C] 15.71[/C][C] 0.2851[/C][/ROW]
[ROW][C]69[/C][C] 12[/C][C] 13.36[/C][C]-1.356[/C][/ROW]
[ROW][C]70[/C][C] 16[/C][C] 15.06[/C][C] 0.9441[/C][/ROW]
[ROW][C]71[/C][C] 16[/C][C] 15.71[/C][C] 0.2931[/C][/ROW]
[ROW][C]72[/C][C] 16[/C][C] 16.36[/C][C]-0.3579[/C][/ROW]
[ROW][C]73[/C][C] 14[/C][C] 15.7[/C][C]-1.702[/C][/ROW]
[ROW][C]74[/C][C] 15[/C][C] 15.22[/C][C]-0.2172[/C][/ROW]
[ROW][C]75[/C][C] 14[/C][C] 14.56[/C][C]-0.5608[/C][/ROW]
[ROW][C]76[/C][C] 15[/C][C] 15.69[/C][C]-0.6936[/C][/ROW]
[ROW][C]77[/C][C] 15[/C][C] 15.04[/C][C]-0.03727[/C][/ROW]
[ROW][C]78[/C][C] 16[/C][C] 15.21[/C][C] 0.7935[/C][/ROW]
[ROW][C]79[/C][C] 11[/C][C] 11.63[/C][C]-0.6275[/C][/ROW]
[ROW][C]80[/C][C] 18[/C][C] 15.85[/C][C] 2.145[/C][/ROW]
[ROW][C]81[/C][C] 11[/C][C] 13.81[/C][C]-2.806[/C][/ROW]
[ROW][C]82[/C][C] 18[/C][C] 17.55[/C][C] 0.4482[/C][/ROW]
[ROW][C]83[/C][C] 15[/C][C] 16.9[/C][C]-1.895[/C][/ROW]
[ROW][C]84[/C][C] 19[/C][C] 18.03[/C][C] 0.9718[/C][/ROW]
[ROW][C]85[/C][C] 17[/C][C] 16.89[/C][C] 0.1099[/C][/ROW]
[ROW][C]86[/C][C] 14[/C][C] 15.01[/C][C]-1.013[/C][/ROW]
[ROW][C]87[/C][C] 13[/C][C] 15.66[/C][C]-2.664[/C][/ROW]
[ROW][C]88[/C][C] 17[/C][C] 15.66[/C][C] 1.338[/C][/ROW]
[ROW][C]89[/C][C] 14[/C][C] 15.66[/C][C]-1.659[/C][/ROW]
[ROW][C]90[/C][C] 19[/C][C] 15.83[/C][C] 3.172[/C][/ROW]
[ROW][C]91[/C][C] 14[/C][C] 14.43[/C][C]-0.4333[/C][/ROW]
[ROW][C]92[/C][C] 16[/C][C] 16.87[/C][C]-0.8715[/C][/ROW]
[ROW][C]93[/C][C] 16[/C][C] 15.17[/C][C] 0.8333[/C][/ROW]
[ROW][C]94[/C][C] 15[/C][C] 15.65[/C][C]-0.6458[/C][/ROW]
[ROW][C]95[/C][C] 12[/C][C] 14.51[/C][C]-2.508[/C][/ROW]
[ROW][C]96[/C][C] 17[/C][C] 16.29[/C][C] 0.7059[/C][/ROW]
[ROW][C]97[/C][C] 18[/C][C] 15.64[/C][C] 2.362[/C][/ROW]
[ROW][C]98[/C][C] 15[/C][C] 13.93[/C][C] 1.067[/C][/ROW]
[ROW][C]99[/C][C] 18[/C][C] 15.63[/C][C] 2.368[/C][/ROW]
[ROW][C]100[/C][C] 15[/C][C] 17.33[/C][C]-2.332[/C][/ROW]
[ROW][C]101[/C][C] 16[/C][C] 15.63[/C][C] 0.3728[/C][/ROW]
[ROW][C]102[/C][C] 16[/C][C] 13.58[/C][C] 2.422[/C][/ROW]
[/TABLE]
Source: https://freestatistics.org/blog/index.php?pk=301370&T=4

Globally Unique Identifier (entire table): ba.freestatistics.org/blog/index.php?pk=301370&T=4

As an alternative you can also use a QR Code:  

The GUIDs for individual cells are displayed in the table below:

Multiple Linear Regression - Actuals, Interpolation, and Residuals
Time or IndexActualsInterpolationForecastResidualsPrediction Error
1 13 12.97 0.02969
2 16 15.32 0.6765
3 17 15.89 1.112
4 16 15.23 0.7687
5 17 17.1-0.1028
6 17 15.88 1.12
7 15 15.4-0.3952
8 16 15.39 0.6074
9 14 14 0.002433
10 16 15.87 0.131
11 17 15.21 1.787
12 16 14.73 1.272
13 16 15.86 0.1389
14 16 14.72 1.277
15 15 15.86-0.8557
16 16 14.55 1.454
17 16 16.5-0.5041
18 13 14.63-1.627
19 15 17.07-2.066
20 17 16.5 0.5039
21 13 13.31-0.312
22 17 17.06-0.05758
23 14 14.13-0.1323
24 14 14.61-0.6114
25 18 15.83 2.171
26 17 17.05-0.04695
27 13 13.95-0.9497
28 16 17.21-1.214
29 15 15.99-0.9905
30 15 15.33-0.3341
31 15 15.9-0.8982
32 13 15.81-2.811
33 17 17.03-0.02834
34 11 14.58-3.585
35 14 14.1-0.1004
36 13 15.8-2.8
37 17 15.14 1.856
38 16 15.31 0.6872
39 17 17.67-0.6661
40 16 14.48 1.518
41 16 15.79 0.2134
42 16 15.13 0.8697
43 15 15.78-0.7813
44 12 13.34-1.338
45 17 15.29 1.706
46 14 15.29-1.292
47 14 15.94-1.943
48 16 14.63 1.367
49 15 15.11-0.1117
50 16 15.76 0.2373
51 14 14.62-0.6246
52 15 13.88 1.117
53 17 14.53 2.466
54 10 13.88-3.878
55 17 15.75 1.251
56 20 16.4 3.6
57 17 16.88 0.1204
58 18 15.74 2.259
59 14 12.82 1.184
60 17 15.74 1.264
61 17 16.95 0.04608
62 16 15.73 0.2692
63 18 16.38 1.618
64 18 16.86 1.139
65 16 16.94-0.9433
66 15 15.72-0.7202
67 13 16.37-3.371
68 16 15.71 0.2851
69 12 13.36-1.356
70 16 15.06 0.9441
71 16 15.71 0.2931
72 16 16.36-0.3579
73 14 15.7-1.702
74 15 15.22-0.2172
75 14 14.56-0.5608
76 15 15.69-0.6936
77 15 15.04-0.03727
78 16 15.21 0.7935
79 11 11.63-0.6275
80 18 15.85 2.145
81 11 13.81-2.806
82 18 17.55 0.4482
83 15 16.9-1.895
84 19 18.03 0.9718
85 17 16.89 0.1099
86 14 15.01-1.013
87 13 15.66-2.664
88 17 15.66 1.338
89 14 15.66-1.659
90 19 15.83 3.172
91 14 14.43-0.4333
92 16 16.87-0.8715
93 16 15.17 0.8333
94 15 15.65-0.6458
95 12 14.51-2.508
96 17 16.29 0.7059
97 18 15.64 2.362
98 15 13.93 1.067
99 18 15.63 2.368
100 15 17.33-2.332
101 16 15.63 0.3728
102 16 13.58 2.422


Goldfeld-Quandt test for Heteroskedasticity
p-valuesAlternative Hypothesis
breakpoint indexgreater2-sidedless
8 0.04758 0.09517 0.9524
9 0.05267 0.1053 0.9473
10 0.01975 0.0395 0.9803
11 0.03445 0.06891 0.9655
12 0.0237 0.0474 0.9763
13 0.01226 0.02452 0.9877
14 0.006716 0.01343 0.9933
15 0.00744 0.01488 0.9926
16 0.00366 0.00732 0.9963
17 0.001574 0.003148 0.9984
18 0.001944 0.003888 0.9981
19 0.005085 0.01017 0.9949
20 0.01207 0.02413 0.9879
21 0.007539 0.01508 0.9925
22 0.004288 0.008576 0.9957
23 0.002475 0.00495 0.9975
24 0.001277 0.002554 0.9987
25 0.01104 0.02208 0.989
26 0.006496 0.01299 0.9935
27 0.0045 0.008999 0.9955
28 0.003075 0.006151 0.9969
29 0.001764 0.003528 0.9982
30 0.000969 0.001938 0.999
31 0.0006513 0.001303 0.9993
32 0.001672 0.003343 0.9983
33 0.001181 0.002363 0.9988
34 0.004345 0.008691 0.9957
35 0.004187 0.008374 0.9958
36 0.006023 0.01205 0.994
37 0.02295 0.0459 0.977
38 0.02442 0.04884 0.9756
39 0.01915 0.0383 0.9808
40 0.02408 0.04817 0.9759
41 0.02086 0.04172 0.9791
42 0.01943 0.03885 0.9806
43 0.01361 0.02722 0.9864
44 0.01166 0.02331 0.9883
45 0.01986 0.03972 0.9801
46 0.01629 0.03259 0.9837
47 0.019 0.038 0.981
48 0.02052 0.04103 0.9795
49 0.01445 0.0289 0.9855
50 0.01168 0.02336 0.9883
51 0.008484 0.01697 0.9915
52 0.009122 0.01825 0.9909
53 0.03018 0.06036 0.9698
54 0.1349 0.2698 0.8651
55 0.143 0.286 0.857
56 0.3957 0.7915 0.6043
57 0.3457 0.6914 0.6543
58 0.4345 0.8689 0.5655
59 0.4081 0.8162 0.5919
60 0.4077 0.8153 0.5923
61 0.3677 0.7354 0.6323
62 0.3244 0.6487 0.6756
63 0.3378 0.6756 0.6622
64 0.3296 0.6591 0.6704
65 0.2942 0.5885 0.7058
66 0.2521 0.5042 0.7479
67 0.4551 0.9102 0.5449
68 0.4063 0.8126 0.5937
69 0.3688 0.7376 0.6312
70 0.4205 0.8411 0.5795
71 0.3845 0.769 0.6155
72 0.3263 0.6527 0.6737
73 0.3073 0.6146 0.6927
74 0.2514 0.5028 0.7486
75 0.2157 0.4315 0.7843
76 0.1708 0.3416 0.8292
77 0.1689 0.3378 0.8311
78 0.1651 0.3303 0.8349
79 0.1245 0.2491 0.8755
80 0.1548 0.3096 0.8452
81 0.1903 0.3805 0.8097
82 0.1547 0.3093 0.8453
83 0.1266 0.2532 0.8734
84 0.1162 0.2325 0.8838
85 0.1285 0.2569 0.8715
86 0.09909 0.1982 0.9009
87 0.125 0.2501 0.875
88 0.1375 0.275 0.8625
89 0.1119 0.2238 0.8881
90 0.2665 0.5331 0.7335
91 0.3266 0.6532 0.6734
92 0.261 0.522 0.739
93 0.2679 0.5358 0.7321
94 0.1778 0.3557 0.8222

\begin{tabular}{lllllllll}
\hline
Goldfeld-Quandt test for Heteroskedasticity \tabularnewline
p-values & Alternative Hypothesis \tabularnewline
breakpoint index & greater & 2-sided & less \tabularnewline
8 &  0.04758 &  0.09517 &  0.9524 \tabularnewline
9 &  0.05267 &  0.1053 &  0.9473 \tabularnewline
10 &  0.01975 &  0.0395 &  0.9803 \tabularnewline
11 &  0.03445 &  0.06891 &  0.9655 \tabularnewline
12 &  0.0237 &  0.0474 &  0.9763 \tabularnewline
13 &  0.01226 &  0.02452 &  0.9877 \tabularnewline
14 &  0.006716 &  0.01343 &  0.9933 \tabularnewline
15 &  0.00744 &  0.01488 &  0.9926 \tabularnewline
16 &  0.00366 &  0.00732 &  0.9963 \tabularnewline
17 &  0.001574 &  0.003148 &  0.9984 \tabularnewline
18 &  0.001944 &  0.003888 &  0.9981 \tabularnewline
19 &  0.005085 &  0.01017 &  0.9949 \tabularnewline
20 &  0.01207 &  0.02413 &  0.9879 \tabularnewline
21 &  0.007539 &  0.01508 &  0.9925 \tabularnewline
22 &  0.004288 &  0.008576 &  0.9957 \tabularnewline
23 &  0.002475 &  0.00495 &  0.9975 \tabularnewline
24 &  0.001277 &  0.002554 &  0.9987 \tabularnewline
25 &  0.01104 &  0.02208 &  0.989 \tabularnewline
26 &  0.006496 &  0.01299 &  0.9935 \tabularnewline
27 &  0.0045 &  0.008999 &  0.9955 \tabularnewline
28 &  0.003075 &  0.006151 &  0.9969 \tabularnewline
29 &  0.001764 &  0.003528 &  0.9982 \tabularnewline
30 &  0.000969 &  0.001938 &  0.999 \tabularnewline
31 &  0.0006513 &  0.001303 &  0.9993 \tabularnewline
32 &  0.001672 &  0.003343 &  0.9983 \tabularnewline
33 &  0.001181 &  0.002363 &  0.9988 \tabularnewline
34 &  0.004345 &  0.008691 &  0.9957 \tabularnewline
35 &  0.004187 &  0.008374 &  0.9958 \tabularnewline
36 &  0.006023 &  0.01205 &  0.994 \tabularnewline
37 &  0.02295 &  0.0459 &  0.977 \tabularnewline
38 &  0.02442 &  0.04884 &  0.9756 \tabularnewline
39 &  0.01915 &  0.0383 &  0.9808 \tabularnewline
40 &  0.02408 &  0.04817 &  0.9759 \tabularnewline
41 &  0.02086 &  0.04172 &  0.9791 \tabularnewline
42 &  0.01943 &  0.03885 &  0.9806 \tabularnewline
43 &  0.01361 &  0.02722 &  0.9864 \tabularnewline
44 &  0.01166 &  0.02331 &  0.9883 \tabularnewline
45 &  0.01986 &  0.03972 &  0.9801 \tabularnewline
46 &  0.01629 &  0.03259 &  0.9837 \tabularnewline
47 &  0.019 &  0.038 &  0.981 \tabularnewline
48 &  0.02052 &  0.04103 &  0.9795 \tabularnewline
49 &  0.01445 &  0.0289 &  0.9855 \tabularnewline
50 &  0.01168 &  0.02336 &  0.9883 \tabularnewline
51 &  0.008484 &  0.01697 &  0.9915 \tabularnewline
52 &  0.009122 &  0.01825 &  0.9909 \tabularnewline
53 &  0.03018 &  0.06036 &  0.9698 \tabularnewline
54 &  0.1349 &  0.2698 &  0.8651 \tabularnewline
55 &  0.143 &  0.286 &  0.857 \tabularnewline
56 &  0.3957 &  0.7915 &  0.6043 \tabularnewline
57 &  0.3457 &  0.6914 &  0.6543 \tabularnewline
58 &  0.4345 &  0.8689 &  0.5655 \tabularnewline
59 &  0.4081 &  0.8162 &  0.5919 \tabularnewline
60 &  0.4077 &  0.8153 &  0.5923 \tabularnewline
61 &  0.3677 &  0.7354 &  0.6323 \tabularnewline
62 &  0.3244 &  0.6487 &  0.6756 \tabularnewline
63 &  0.3378 &  0.6756 &  0.6622 \tabularnewline
64 &  0.3296 &  0.6591 &  0.6704 \tabularnewline
65 &  0.2942 &  0.5885 &  0.7058 \tabularnewline
66 &  0.2521 &  0.5042 &  0.7479 \tabularnewline
67 &  0.4551 &  0.9102 &  0.5449 \tabularnewline
68 &  0.4063 &  0.8126 &  0.5937 \tabularnewline
69 &  0.3688 &  0.7376 &  0.6312 \tabularnewline
70 &  0.4205 &  0.8411 &  0.5795 \tabularnewline
71 &  0.3845 &  0.769 &  0.6155 \tabularnewline
72 &  0.3263 &  0.6527 &  0.6737 \tabularnewline
73 &  0.3073 &  0.6146 &  0.6927 \tabularnewline
74 &  0.2514 &  0.5028 &  0.7486 \tabularnewline
75 &  0.2157 &  0.4315 &  0.7843 \tabularnewline
76 &  0.1708 &  0.3416 &  0.8292 \tabularnewline
77 &  0.1689 &  0.3378 &  0.8311 \tabularnewline
78 &  0.1651 &  0.3303 &  0.8349 \tabularnewline
79 &  0.1245 &  0.2491 &  0.8755 \tabularnewline
80 &  0.1548 &  0.3096 &  0.8452 \tabularnewline
81 &  0.1903 &  0.3805 &  0.8097 \tabularnewline
82 &  0.1547 &  0.3093 &  0.8453 \tabularnewline
83 &  0.1266 &  0.2532 &  0.8734 \tabularnewline
84 &  0.1162 &  0.2325 &  0.8838 \tabularnewline
85 &  0.1285 &  0.2569 &  0.8715 \tabularnewline
86 &  0.09909 &  0.1982 &  0.9009 \tabularnewline
87 &  0.125 &  0.2501 &  0.875 \tabularnewline
88 &  0.1375 &  0.275 &  0.8625 \tabularnewline
89 &  0.1119 &  0.2238 &  0.8881 \tabularnewline
90 &  0.2665 &  0.5331 &  0.7335 \tabularnewline
91 &  0.3266 &  0.6532 &  0.6734 \tabularnewline
92 &  0.261 &  0.522 &  0.739 \tabularnewline
93 &  0.2679 &  0.5358 &  0.7321 \tabularnewline
94 &  0.1778 &  0.3557 &  0.8222 \tabularnewline
\hline
\end{tabular}
%Source: https://freestatistics.org/blog/index.php?pk=301370&T=5

[TABLE]
[ROW][C]Goldfeld-Quandt test for Heteroskedasticity[/C][/ROW]
[ROW][C]p-values[/C][C]Alternative Hypothesis[/C][/ROW]
[ROW][C]breakpoint index[/C][C]greater[/C][C]2-sided[/C][C]less[/C][/ROW]
[ROW][C]8[/C][C] 0.04758[/C][C] 0.09517[/C][C] 0.9524[/C][/ROW]
[ROW][C]9[/C][C] 0.05267[/C][C] 0.1053[/C][C] 0.9473[/C][/ROW]
[ROW][C]10[/C][C] 0.01975[/C][C] 0.0395[/C][C] 0.9803[/C][/ROW]
[ROW][C]11[/C][C] 0.03445[/C][C] 0.06891[/C][C] 0.9655[/C][/ROW]
[ROW][C]12[/C][C] 0.0237[/C][C] 0.0474[/C][C] 0.9763[/C][/ROW]
[ROW][C]13[/C][C] 0.01226[/C][C] 0.02452[/C][C] 0.9877[/C][/ROW]
[ROW][C]14[/C][C] 0.006716[/C][C] 0.01343[/C][C] 0.9933[/C][/ROW]
[ROW][C]15[/C][C] 0.00744[/C][C] 0.01488[/C][C] 0.9926[/C][/ROW]
[ROW][C]16[/C][C] 0.00366[/C][C] 0.00732[/C][C] 0.9963[/C][/ROW]
[ROW][C]17[/C][C] 0.001574[/C][C] 0.003148[/C][C] 0.9984[/C][/ROW]
[ROW][C]18[/C][C] 0.001944[/C][C] 0.003888[/C][C] 0.9981[/C][/ROW]
[ROW][C]19[/C][C] 0.005085[/C][C] 0.01017[/C][C] 0.9949[/C][/ROW]
[ROW][C]20[/C][C] 0.01207[/C][C] 0.02413[/C][C] 0.9879[/C][/ROW]
[ROW][C]21[/C][C] 0.007539[/C][C] 0.01508[/C][C] 0.9925[/C][/ROW]
[ROW][C]22[/C][C] 0.004288[/C][C] 0.008576[/C][C] 0.9957[/C][/ROW]
[ROW][C]23[/C][C] 0.002475[/C][C] 0.00495[/C][C] 0.9975[/C][/ROW]
[ROW][C]24[/C][C] 0.001277[/C][C] 0.002554[/C][C] 0.9987[/C][/ROW]
[ROW][C]25[/C][C] 0.01104[/C][C] 0.02208[/C][C] 0.989[/C][/ROW]
[ROW][C]26[/C][C] 0.006496[/C][C] 0.01299[/C][C] 0.9935[/C][/ROW]
[ROW][C]27[/C][C] 0.0045[/C][C] 0.008999[/C][C] 0.9955[/C][/ROW]
[ROW][C]28[/C][C] 0.003075[/C][C] 0.006151[/C][C] 0.9969[/C][/ROW]
[ROW][C]29[/C][C] 0.001764[/C][C] 0.003528[/C][C] 0.9982[/C][/ROW]
[ROW][C]30[/C][C] 0.000969[/C][C] 0.001938[/C][C] 0.999[/C][/ROW]
[ROW][C]31[/C][C] 0.0006513[/C][C] 0.001303[/C][C] 0.9993[/C][/ROW]
[ROW][C]32[/C][C] 0.001672[/C][C] 0.003343[/C][C] 0.9983[/C][/ROW]
[ROW][C]33[/C][C] 0.001181[/C][C] 0.002363[/C][C] 0.9988[/C][/ROW]
[ROW][C]34[/C][C] 0.004345[/C][C] 0.008691[/C][C] 0.9957[/C][/ROW]
[ROW][C]35[/C][C] 0.004187[/C][C] 0.008374[/C][C] 0.9958[/C][/ROW]
[ROW][C]36[/C][C] 0.006023[/C][C] 0.01205[/C][C] 0.994[/C][/ROW]
[ROW][C]37[/C][C] 0.02295[/C][C] 0.0459[/C][C] 0.977[/C][/ROW]
[ROW][C]38[/C][C] 0.02442[/C][C] 0.04884[/C][C] 0.9756[/C][/ROW]
[ROW][C]39[/C][C] 0.01915[/C][C] 0.0383[/C][C] 0.9808[/C][/ROW]
[ROW][C]40[/C][C] 0.02408[/C][C] 0.04817[/C][C] 0.9759[/C][/ROW]
[ROW][C]41[/C][C] 0.02086[/C][C] 0.04172[/C][C] 0.9791[/C][/ROW]
[ROW][C]42[/C][C] 0.01943[/C][C] 0.03885[/C][C] 0.9806[/C][/ROW]
[ROW][C]43[/C][C] 0.01361[/C][C] 0.02722[/C][C] 0.9864[/C][/ROW]
[ROW][C]44[/C][C] 0.01166[/C][C] 0.02331[/C][C] 0.9883[/C][/ROW]
[ROW][C]45[/C][C] 0.01986[/C][C] 0.03972[/C][C] 0.9801[/C][/ROW]
[ROW][C]46[/C][C] 0.01629[/C][C] 0.03259[/C][C] 0.9837[/C][/ROW]
[ROW][C]47[/C][C] 0.019[/C][C] 0.038[/C][C] 0.981[/C][/ROW]
[ROW][C]48[/C][C] 0.02052[/C][C] 0.04103[/C][C] 0.9795[/C][/ROW]
[ROW][C]49[/C][C] 0.01445[/C][C] 0.0289[/C][C] 0.9855[/C][/ROW]
[ROW][C]50[/C][C] 0.01168[/C][C] 0.02336[/C][C] 0.9883[/C][/ROW]
[ROW][C]51[/C][C] 0.008484[/C][C] 0.01697[/C][C] 0.9915[/C][/ROW]
[ROW][C]52[/C][C] 0.009122[/C][C] 0.01825[/C][C] 0.9909[/C][/ROW]
[ROW][C]53[/C][C] 0.03018[/C][C] 0.06036[/C][C] 0.9698[/C][/ROW]
[ROW][C]54[/C][C] 0.1349[/C][C] 0.2698[/C][C] 0.8651[/C][/ROW]
[ROW][C]55[/C][C] 0.143[/C][C] 0.286[/C][C] 0.857[/C][/ROW]
[ROW][C]56[/C][C] 0.3957[/C][C] 0.7915[/C][C] 0.6043[/C][/ROW]
[ROW][C]57[/C][C] 0.3457[/C][C] 0.6914[/C][C] 0.6543[/C][/ROW]
[ROW][C]58[/C][C] 0.4345[/C][C] 0.8689[/C][C] 0.5655[/C][/ROW]
[ROW][C]59[/C][C] 0.4081[/C][C] 0.8162[/C][C] 0.5919[/C][/ROW]
[ROW][C]60[/C][C] 0.4077[/C][C] 0.8153[/C][C] 0.5923[/C][/ROW]
[ROW][C]61[/C][C] 0.3677[/C][C] 0.7354[/C][C] 0.6323[/C][/ROW]
[ROW][C]62[/C][C] 0.3244[/C][C] 0.6487[/C][C] 0.6756[/C][/ROW]
[ROW][C]63[/C][C] 0.3378[/C][C] 0.6756[/C][C] 0.6622[/C][/ROW]
[ROW][C]64[/C][C] 0.3296[/C][C] 0.6591[/C][C] 0.6704[/C][/ROW]
[ROW][C]65[/C][C] 0.2942[/C][C] 0.5885[/C][C] 0.7058[/C][/ROW]
[ROW][C]66[/C][C] 0.2521[/C][C] 0.5042[/C][C] 0.7479[/C][/ROW]
[ROW][C]67[/C][C] 0.4551[/C][C] 0.9102[/C][C] 0.5449[/C][/ROW]
[ROW][C]68[/C][C] 0.4063[/C][C] 0.8126[/C][C] 0.5937[/C][/ROW]
[ROW][C]69[/C][C] 0.3688[/C][C] 0.7376[/C][C] 0.6312[/C][/ROW]
[ROW][C]70[/C][C] 0.4205[/C][C] 0.8411[/C][C] 0.5795[/C][/ROW]
[ROW][C]71[/C][C] 0.3845[/C][C] 0.769[/C][C] 0.6155[/C][/ROW]
[ROW][C]72[/C][C] 0.3263[/C][C] 0.6527[/C][C] 0.6737[/C][/ROW]
[ROW][C]73[/C][C] 0.3073[/C][C] 0.6146[/C][C] 0.6927[/C][/ROW]
[ROW][C]74[/C][C] 0.2514[/C][C] 0.5028[/C][C] 0.7486[/C][/ROW]
[ROW][C]75[/C][C] 0.2157[/C][C] 0.4315[/C][C] 0.7843[/C][/ROW]
[ROW][C]76[/C][C] 0.1708[/C][C] 0.3416[/C][C] 0.8292[/C][/ROW]
[ROW][C]77[/C][C] 0.1689[/C][C] 0.3378[/C][C] 0.8311[/C][/ROW]
[ROW][C]78[/C][C] 0.1651[/C][C] 0.3303[/C][C] 0.8349[/C][/ROW]
[ROW][C]79[/C][C] 0.1245[/C][C] 0.2491[/C][C] 0.8755[/C][/ROW]
[ROW][C]80[/C][C] 0.1548[/C][C] 0.3096[/C][C] 0.8452[/C][/ROW]
[ROW][C]81[/C][C] 0.1903[/C][C] 0.3805[/C][C] 0.8097[/C][/ROW]
[ROW][C]82[/C][C] 0.1547[/C][C] 0.3093[/C][C] 0.8453[/C][/ROW]
[ROW][C]83[/C][C] 0.1266[/C][C] 0.2532[/C][C] 0.8734[/C][/ROW]
[ROW][C]84[/C][C] 0.1162[/C][C] 0.2325[/C][C] 0.8838[/C][/ROW]
[ROW][C]85[/C][C] 0.1285[/C][C] 0.2569[/C][C] 0.8715[/C][/ROW]
[ROW][C]86[/C][C] 0.09909[/C][C] 0.1982[/C][C] 0.9009[/C][/ROW]
[ROW][C]87[/C][C] 0.125[/C][C] 0.2501[/C][C] 0.875[/C][/ROW]
[ROW][C]88[/C][C] 0.1375[/C][C] 0.275[/C][C] 0.8625[/C][/ROW]
[ROW][C]89[/C][C] 0.1119[/C][C] 0.2238[/C][C] 0.8881[/C][/ROW]
[ROW][C]90[/C][C] 0.2665[/C][C] 0.5331[/C][C] 0.7335[/C][/ROW]
[ROW][C]91[/C][C] 0.3266[/C][C] 0.6532[/C][C] 0.6734[/C][/ROW]
[ROW][C]92[/C][C] 0.261[/C][C] 0.522[/C][C] 0.739[/C][/ROW]
[ROW][C]93[/C][C] 0.2679[/C][C] 0.5358[/C][C] 0.7321[/C][/ROW]
[ROW][C]94[/C][C] 0.1778[/C][C] 0.3557[/C][C] 0.8222[/C][/ROW]
[/TABLE]
Source: https://freestatistics.org/blog/index.php?pk=301370&T=5

Globally Unique Identifier (entire table): ba.freestatistics.org/blog/index.php?pk=301370&T=5

As an alternative you can also use a QR Code:  

The GUIDs for individual cells are displayed in the table below:

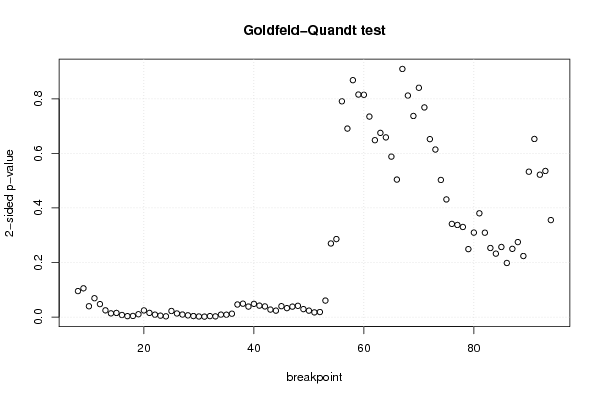
Goldfeld-Quandt test for Heteroskedasticity
p-valuesAlternative Hypothesis
breakpoint indexgreater2-sidedless
8 0.04758 0.09517 0.9524
9 0.05267 0.1053 0.9473
10 0.01975 0.0395 0.9803
11 0.03445 0.06891 0.9655
12 0.0237 0.0474 0.9763
13 0.01226 0.02452 0.9877
14 0.006716 0.01343 0.9933
15 0.00744 0.01488 0.9926
16 0.00366 0.00732 0.9963
17 0.001574 0.003148 0.9984
18 0.001944 0.003888 0.9981
19 0.005085 0.01017 0.9949
20 0.01207 0.02413 0.9879
21 0.007539 0.01508 0.9925
22 0.004288 0.008576 0.9957
23 0.002475 0.00495 0.9975
24 0.001277 0.002554 0.9987
25 0.01104 0.02208 0.989
26 0.006496 0.01299 0.9935
27 0.0045 0.008999 0.9955
28 0.003075 0.006151 0.9969
29 0.001764 0.003528 0.9982
30 0.000969 0.001938 0.999
31 0.0006513 0.001303 0.9993
32 0.001672 0.003343 0.9983
33 0.001181 0.002363 0.9988
34 0.004345 0.008691 0.9957
35 0.004187 0.008374 0.9958
36 0.006023 0.01205 0.994
37 0.02295 0.0459 0.977
38 0.02442 0.04884 0.9756
39 0.01915 0.0383 0.9808
40 0.02408 0.04817 0.9759
41 0.02086 0.04172 0.9791
42 0.01943 0.03885 0.9806
43 0.01361 0.02722 0.9864
44 0.01166 0.02331 0.9883
45 0.01986 0.03972 0.9801
46 0.01629 0.03259 0.9837
47 0.019 0.038 0.981
48 0.02052 0.04103 0.9795
49 0.01445 0.0289 0.9855
50 0.01168 0.02336 0.9883
51 0.008484 0.01697 0.9915
52 0.009122 0.01825 0.9909
53 0.03018 0.06036 0.9698
54 0.1349 0.2698 0.8651
55 0.143 0.286 0.857
56 0.3957 0.7915 0.6043
57 0.3457 0.6914 0.6543
58 0.4345 0.8689 0.5655
59 0.4081 0.8162 0.5919
60 0.4077 0.8153 0.5923
61 0.3677 0.7354 0.6323
62 0.3244 0.6487 0.6756
63 0.3378 0.6756 0.6622
64 0.3296 0.6591 0.6704
65 0.2942 0.5885 0.7058
66 0.2521 0.5042 0.7479
67 0.4551 0.9102 0.5449
68 0.4063 0.8126 0.5937
69 0.3688 0.7376 0.6312
70 0.4205 0.8411 0.5795
71 0.3845 0.769 0.6155
72 0.3263 0.6527 0.6737
73 0.3073 0.6146 0.6927
74 0.2514 0.5028 0.7486
75 0.2157 0.4315 0.7843
76 0.1708 0.3416 0.8292
77 0.1689 0.3378 0.8311
78 0.1651 0.3303 0.8349
79 0.1245 0.2491 0.8755
80 0.1548 0.3096 0.8452
81 0.1903 0.3805 0.8097
82 0.1547 0.3093 0.8453
83 0.1266 0.2532 0.8734
84 0.1162 0.2325 0.8838
85 0.1285 0.2569 0.8715
86 0.09909 0.1982 0.9009
87 0.125 0.2501 0.875
88 0.1375 0.275 0.8625
89 0.1119 0.2238 0.8881
90 0.2665 0.5331 0.7335
91 0.3266 0.6532 0.6734
92 0.261 0.522 0.739
93 0.2679 0.5358 0.7321
94 0.1778 0.3557 0.8222


Meta Analysis of Goldfeld-Quandt test for Heteroskedasticity
Description# significant tests% significant testsOK/NOK
1% type I error level15 0.1724NOK
5% type I error level420.482759NOK
10% type I error level450.517241NOK

\begin{tabular}{lllllllll}
\hline
Meta Analysis of Goldfeld-Quandt test for Heteroskedasticity \tabularnewline
Description & # significant tests & % significant tests & OK/NOK \tabularnewline
1% type I error level & 15 &  0.1724 & NOK \tabularnewline
5% type I error level & 42 & 0.482759 & NOK \tabularnewline
10% type I error level & 45 & 0.517241 & NOK \tabularnewline
\hline
\end{tabular}
%Source: https://freestatistics.org/blog/index.php?pk=301370&T=6

[TABLE]
[ROW][C]Meta Analysis of Goldfeld-Quandt test for Heteroskedasticity[/C][/ROW]
[ROW][C]Description[/C][C]# significant tests[/C][C]% significant tests[/C][C]OK/NOK[/C][/ROW]
[ROW][C]1% type I error level[/C][C]15[/C][C] 0.1724[/C][C]NOK[/C][/ROW]
[ROW][C]5% type I error level[/C][C]42[/C][C]0.482759[/C][C]NOK[/C][/ROW]
[ROW][C]10% type I error level[/C][C]45[/C][C]0.517241[/C][C]NOK[/C][/ROW]
[/TABLE]
Source: https://freestatistics.org/blog/index.php?pk=301370&T=6

Globally Unique Identifier (entire table): ba.freestatistics.org/blog/index.php?pk=301370&T=6

As an alternative you can also use a QR Code:  

The GUIDs for individual cells are displayed in the table below:

Meta Analysis of Goldfeld-Quandt test for Heteroskedasticity
Description# significant tests% significant testsOK/NOK
1% type I error level15 0.1724NOK
5% type I error level420.482759NOK
10% type I error level450.517241NOK


Ramsey RESET F-Test for powers (2 and 3) of fitted values
> reset_test_fitted
	RESET test
data:  mylm
RESET = 0.83478, df1 = 2, df2 = 95, p-value = 0.4371
Ramsey RESET F-Test for powers (2 and 3) of regressors
> reset_test_regressors
	RESET test
data:  mylm
RESET = 1.7692, df1 = 8, df2 = 89, p-value = 0.09374
Ramsey RESET F-Test for powers (2 and 3) of principal components
> reset_test_principal_components
	RESET test
data:  mylm
RESET = 0.75636, df1 = 2, df2 = 95, p-value = 0.4722

\begin{tabular}{lllllllll}
\hline
Ramsey RESET F-Test for powers (2 and 3) of fitted values \tabularnewline
> reset_test_fitted
	RESET test
data:  mylm
RESET = 0.83478, df1 = 2, df2 = 95, p-value = 0.4371
\tabularnewline Ramsey RESET F-Test for powers (2 and 3) of regressors \tabularnewline
> reset_test_regressors
	RESET test
data:  mylm
RESET = 1.7692, df1 = 8, df2 = 89, p-value = 0.09374
\tabularnewline Ramsey RESET F-Test for powers (2 and 3) of principal components \tabularnewline
> reset_test_principal_components
	RESET test
data:  mylm
RESET = 0.75636, df1 = 2, df2 = 95, p-value = 0.4722
\tabularnewline \hline \end{tabular} %Source: https://freestatistics.org/blog/index.php?pk=301370&T=7

[TABLE]
[ROW][C]Ramsey RESET F-Test for powers (2 and 3) of fitted values[/C][/ROW]
[ROW][C]
> reset_test_fitted
	RESET test
data:  mylm
RESET = 0.83478, df1 = 2, df2 = 95, p-value = 0.4371
[/C][/ROW] [ROW][C]Ramsey RESET F-Test for powers (2 and 3) of regressors[/C][/ROW] [ROW][C]
> reset_test_regressors
	RESET test
data:  mylm
RESET = 1.7692, df1 = 8, df2 = 89, p-value = 0.09374
[/C][/ROW] [ROW][C]Ramsey RESET F-Test for powers (2 and 3) of principal components[/C][/ROW] [ROW][C]
> reset_test_principal_components
	RESET test
data:  mylm
RESET = 0.75636, df1 = 2, df2 = 95, p-value = 0.4722
[/C][/ROW] [/TABLE] Source: https://freestatistics.org/blog/index.php?pk=301370&T=7

Globally Unique Identifier (entire table): ba.freestatistics.org/blog/index.php?pk=301370&T=7

As an alternative you can also use a QR Code:  

The GUIDs for individual cells are displayed in the table below:

Ramsey RESET F-Test for powers (2 and 3) of fitted values
> reset_test_fitted
	RESET test
data:  mylm
RESET = 0.83478, df1 = 2, df2 = 95, p-value = 0.4371
Ramsey RESET F-Test for powers (2 and 3) of regressors
> reset_test_regressors
	RESET test
data:  mylm
RESET = 1.7692, df1 = 8, df2 = 89, p-value = 0.09374
Ramsey RESET F-Test for powers (2 and 3) of principal components
> reset_test_principal_components
	RESET test
data:  mylm
RESET = 0.75636, df1 = 2, df2 = 95, p-value = 0.4722


Variance Inflation Factors (Multicollinearity)
> vif
       b        d        e        t 
1.072689 1.123955 1.066935 1.019301 

\begin{tabular}{lllllllll}
\hline
Variance Inflation Factors (Multicollinearity) \tabularnewline
> vif
       b        d        e        t 
1.072689 1.123955 1.066935 1.019301 
\tabularnewline \hline \end{tabular} %Source: https://freestatistics.org/blog/index.php?pk=301370&T=8

[TABLE]
[ROW][C]Variance Inflation Factors (Multicollinearity)[/C][/ROW]
[ROW][C]
> vif
       b        d        e        t 
1.072689 1.123955 1.066935 1.019301 
[/C][/ROW] [/TABLE] Source: https://freestatistics.org/blog/index.php?pk=301370&T=8

Globally Unique Identifier (entire table): ba.freestatistics.org/blog/index.php?pk=301370&T=8

As an alternative you can also use a QR Code:  

The GUIDs for individual cells are displayed in the table below:

Variance Inflation Factors (Multicollinearity)
> vif
       b        d        e        t 
1.072689 1.123955 1.066935 1.019301 


Parameters (Session):
par1 = 1 ; par2 = Do not include Seasonal Dummies ; par3 = Linear Trend ; par4 = 0 ; par5 = 0 ;
Parameters (R input):
par1 = 1 ; par2 = Do not include Seasonal Dummies ; par3 = Linear Trend ; par4 = 0 ; par5 = 0 ;
R code (references can be found in the software module):
par5 <- '0'
par4 <- '0'
par3 <- 'Linear Trend'
par2 <- 'Do not include Seasonal Dummies'
par1 <- '1'
library(lattice)
library(lmtest)
library(car)
library(MASS)
n25 <- 25 #minimum number of obs. for Goldfeld-Quandt test
mywarning <- ''
par1 <- as.numeric(par1)
if(is.na(par1)) {
par1 <- 1
mywarning = 'Warning: you did not specify the column number of the endogenous series! The first column was selected by default.'
}
if (par4=='') par4 <- 0
par4 <- as.numeric(par4)
if (par5=='') par5 <- 0
par5 <- as.numeric(par5)
x <- na.omit(t(y))
k <- length(x[1,])
n <- length(x[,1])
x1 <- cbind(x[,par1], x[,1:k!=par1])
mycolnames <- c(colnames(x)[par1], colnames(x)[1:k!=par1])
colnames(x1) <- mycolnames #colnames(x)[par1]
x <- x1
if (par3 == 'First Differences'){
(n <- n -1)
x2 <- array(0, dim=c(n,k), dimnames=list(1:n, paste('(1-B)',colnames(x),sep='')))
for (i in 1:n) {
for (j in 1:k) {
x2[i,j] <- x[i+1,j] - x[i,j]
}
}
x <- x2
}
if (par3 == 'Seasonal Differences (s=12)'){
(n <- n - 12)
x2 <- array(0, dim=c(n,k), dimnames=list(1:n, paste('(1-B12)',colnames(x),sep='')))
for (i in 1:n) {
for (j in 1:k) {
x2[i,j] <- x[i+12,j] - x[i,j]
}
}
x <- x2
}
if (par3 == 'First and Seasonal Differences (s=12)'){
(n <- n -1)
x2 <- array(0, dim=c(n,k), dimnames=list(1:n, paste('(1-B)',colnames(x),sep='')))
for (i in 1:n) {
for (j in 1:k) {
x2[i,j] <- x[i+1,j] - x[i,j]
}
}
x <- x2
(n <- n - 12)
x2 <- array(0, dim=c(n,k), dimnames=list(1:n, paste('(1-B12)',colnames(x),sep='')))
for (i in 1:n) {
for (j in 1:k) {
x2[i,j] <- x[i+12,j] - x[i,j]
}
}
x <- x2
}
if(par4 > 0) {
x2 <- array(0, dim=c(n-par4,par4), dimnames=list(1:(n-par4), paste(colnames(x)[par1],'(t-',1:par4,')',sep='')))
for (i in 1:(n-par4)) {
for (j in 1:par4) {
x2[i,j] <- x[i+par4-j,par1]
}
}
x <- cbind(x[(par4+1):n,], x2)
n <- n - par4
}
if(par5 > 0) {
x2 <- array(0, dim=c(n-par5*12,par5), dimnames=list(1:(n-par5*12), paste(colnames(x)[par1],'(t-',1:par5,'s)',sep='')))
for (i in 1:(n-par5*12)) {
for (j in 1:par5) {
x2[i,j] <- x[i+par5*12-j*12,par1]
}
}
x <- cbind(x[(par5*12+1):n,], x2)
n <- n - par5*12
}
if (par2 == 'Include Monthly Dummies'){
x2 <- array(0, dim=c(n,11), dimnames=list(1:n, paste('M', seq(1:11), sep ='')))
for (i in 1:11){
x2[seq(i,n,12),i] <- 1
}
x <- cbind(x, x2)
}
if (par2 == 'Include Quarterly Dummies'){
x2 <- array(0, dim=c(n,3), dimnames=list(1:n, paste('Q', seq(1:3), sep ='')))
for (i in 1:3){
x2[seq(i,n,4),i] <- 1
}
x <- cbind(x, x2)
}
(k <- length(x[n,]))
if (par3 == 'Linear Trend'){
x <- cbind(x, c(1:n))
colnames(x)[k+1] <- 't'
}
print(x)
(k <- length(x[n,]))
head(x)
df <- as.data.frame(x)
(mylm <- lm(df))
(mysum <- summary(mylm))
if (n > n25) {
kp3 <- k + 3
nmkm3 <- n - k - 3
gqarr <- array(NA, dim=c(nmkm3-kp3+1,3))
numgqtests <- 0
numsignificant1 <- 0
numsignificant5 <- 0
numsignificant10 <- 0
for (mypoint in kp3:nmkm3) {
j <- 0
numgqtests <- numgqtests + 1
for (myalt in c('greater', 'two.sided', 'less')) {
j <- j + 1
gqarr[mypoint-kp3+1,j] <- gqtest(mylm, point=mypoint, alternative=myalt)$p.value
}
if (gqarr[mypoint-kp3+1,2] < 0.01) numsignificant1 <- numsignificant1 + 1
if (gqarr[mypoint-kp3+1,2] < 0.05) numsignificant5 <- numsignificant5 + 1
if (gqarr[mypoint-kp3+1,2] < 0.10) numsignificant10 <- numsignificant10 + 1
}
gqarr
}
bitmap(file='test0.png')
plot(x[,1], type='l', main='Actuals and Interpolation', ylab='value of Actuals and Interpolation (dots)', xlab='time or index')
points(x[,1]-mysum$resid)
grid()
dev.off()
bitmap(file='test1.png')
plot(mysum$resid, type='b', pch=19, main='Residuals', ylab='value of Residuals', xlab='time or index')
grid()
dev.off()
bitmap(file='test2.png')
sresid <- studres(mylm)
hist(sresid, freq=FALSE, main='Distribution of Studentized Residuals')
xfit<-seq(min(sresid),max(sresid),length=40)
yfit<-dnorm(xfit)
lines(xfit, yfit)
grid()
dev.off()
bitmap(file='test3.png')
densityplot(~mysum$resid,col='black',main='Residual Density Plot', xlab='values of Residuals')
dev.off()
bitmap(file='test4.png')
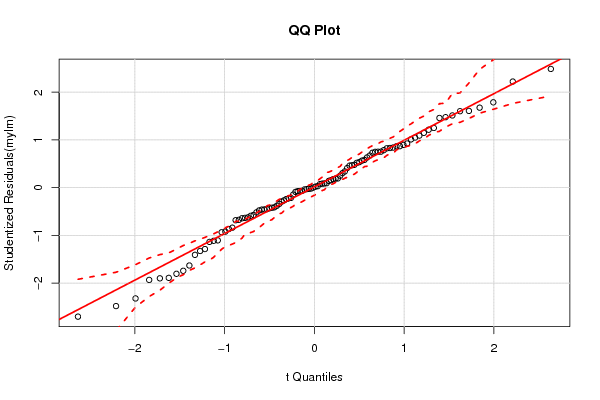
qqPlot(mylm, main='QQ Plot')
grid()
dev.off()
(myerror <- as.ts(mysum$resid))
bitmap(file='test5.png')
dum <- cbind(lag(myerror,k=1),myerror)
dum
dum1 <- dum[2:length(myerror),]
dum1
z <- as.data.frame(dum1)
print(z)
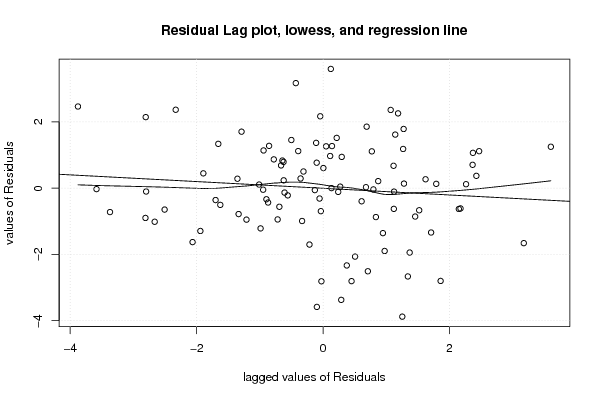
plot(z,main=paste('Residual Lag plot, lowess, and regression line'), ylab='values of Residuals', xlab='lagged values of Residuals')
lines(lowess(z))
abline(lm(z))
grid()
dev.off()
bitmap(file='test6.png')
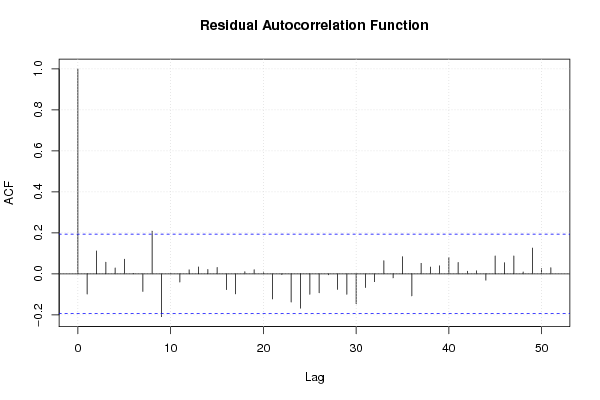
acf(mysum$resid, lag.max=length(mysum$resid)/2, main='Residual Autocorrelation Function')
grid()
dev.off()
bitmap(file='test7.png')
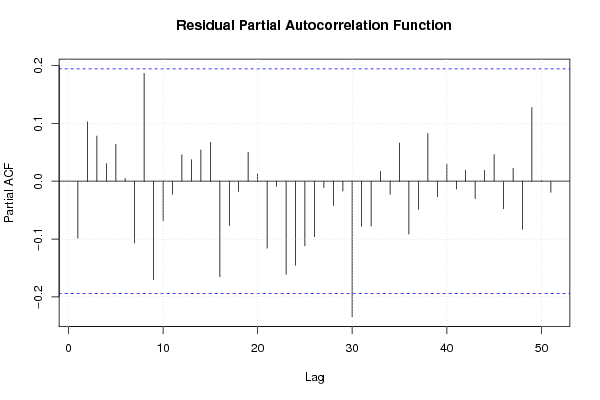
pacf(mysum$resid, lag.max=length(mysum$resid)/2, main='Residual Partial Autocorrelation Function')
grid()
dev.off()
bitmap(file='test8.png')
opar <- par(mfrow = c(2,2), oma = c(0, 0, 1.1, 0))
plot(mylm, las = 1, sub='Residual Diagnostics')
par(opar)
dev.off()
if (n > n25) {
bitmap(file='test9.png')
plot(kp3:nmkm3,gqarr[,2], main='Goldfeld-Quandt test',ylab='2-sided p-value',xlab='breakpoint')
grid()
dev.off()
}
load(file='createtable')
a<-table.start()
a<-table.row.start(a)
a<-table.element(a, 'Multiple Linear Regression - Estimated Regression Equation', 1, TRUE)
a<-table.row.end(a)
myeq <- colnames(x)[1]
myeq <- paste(myeq, '[t] = ', sep='')
for (i in 1:k){
if (mysum$coefficients[i,1] > 0) myeq <- paste(myeq, '+', '')
myeq <- paste(myeq, signif(mysum$coefficients[i,1],6), sep=' ')
if (rownames(mysum$coefficients)[i] != '(Intercept)') {
myeq <- paste(myeq, rownames(mysum$coefficients)[i], sep='')
if (rownames(mysum$coefficients)[i] != 't') myeq <- paste(myeq, '[t]', sep='')
}
}
myeq <- paste(myeq, ' + e[t]')
a<-table.row.start(a)
a<-table.element(a, myeq)
a<-table.row.end(a)
a<-table.row.start(a)
a<-table.element(a, mywarning)
a<-table.row.end(a)
a<-table.end(a)
table.save(a,file='mytable1.tab')
a<-table.start()
a<-table.row.start(a)
a<-table.element(a,'Multiple Linear Regression - Ordinary Least Squares', 6, TRUE)
a<-table.row.end(a)
a<-table.row.start(a)
a<-table.element(a,'Variable',header=TRUE)
a<-table.element(a,'Parameter',header=TRUE)
a<-table.element(a,'S.D.',header=TRUE)
a<-table.element(a,'T-STAT
H0: parameter = 0',header=TRUE)
a<-table.element(a,'2-tail p-value',header=TRUE)
a<-table.element(a,'1-tail p-value',header=TRUE)
a<-table.row.end(a)
for (i in 1:k){
a<-table.row.start(a)
a<-table.element(a,rownames(mysum$coefficients)[i],header=TRUE)
a<-table.element(a,formatC(signif(mysum$coefficients[i,1],5),format='g',flag='+'))
a<-table.element(a,formatC(signif(mysum$coefficients[i,2],5),format='g',flag=' '))
a<-table.element(a,formatC(signif(mysum$coefficients[i,3],4),format='e',flag='+'))
a<-table.element(a,formatC(signif(mysum$coefficients[i,4],4),format='g',flag=' '))
a<-table.element(a,formatC(signif(mysum$coefficients[i,4]/2,4),format='g',flag=' '))
a<-table.row.end(a)
}
a<-table.end(a)
table.save(a,file='mytable2.tab')
a<-table.start()
a<-table.row.start(a)
a<-table.element(a, 'Multiple Linear Regression - Regression Statistics', 2, TRUE)
a<-table.row.end(a)
a<-table.row.start(a)
a<-table.element(a, 'Multiple R',1,TRUE)
a<-table.element(a,formatC(signif(sqrt(mysum$r.squared),6),format='g',flag=' '))
a<-table.row.end(a)
a<-table.row.start(a)
a<-table.element(a, 'R-squared',1,TRUE)
a<-table.element(a,formatC(signif(mysum$r.squared,6),format='g',flag=' '))
a<-table.row.end(a)
a<-table.row.start(a)
a<-table.element(a, 'Adjusted R-squared',1,TRUE)
a<-table.element(a,formatC(signif(mysum$adj.r.squared,6),format='g',flag=' '))
a<-table.row.end(a)
a<-table.row.start(a)
a<-table.element(a, 'F-TEST (value)',1,TRUE)
a<-table.element(a,formatC(signif(mysum$fstatistic[1],6),format='g',flag=' '))
a<-table.row.end(a)
a<-table.row.start(a)
a<-table.element(a, 'F-TEST (DF numerator)',1,TRUE)
a<-table.element(a, signif(mysum$fstatistic[2],6))
a<-table.row.end(a)
a<-table.row.start(a)
a<-table.element(a, 'F-TEST (DF denominator)',1,TRUE)
a<-table.element(a, signif(mysum$fstatistic[3],6))
a<-table.row.end(a)
a<-table.row.start(a)
a<-table.element(a, 'p-value',1,TRUE)
a<-table.element(a,formatC(signif(1-pf(mysum$fstatistic[1],mysum$fstatistic[2],mysum$fstatistic[3]),6),format='g',flag=' '))
a<-table.row.end(a)
a<-table.row.start(a)
a<-table.element(a, 'Multiple Linear Regression - Residual Statistics', 2, TRUE)
a<-table.row.end(a)
a<-table.row.start(a)
a<-table.element(a, 'Residual Standard Deviation',1,TRUE)
a<-table.element(a,formatC(signif(mysum$sigma,6),format='g',flag=' '))
a<-table.row.end(a)
a<-table.row.start(a)
a<-table.element(a, 'Sum Squared Residuals',1,TRUE)
a<-table.element(a,formatC(signif(sum(myerror*myerror),6),format='g',flag=' '))
a<-table.row.end(a)
a<-table.end(a)
table.save(a,file='mytable3.tab')
myr <- as.numeric(mysum$resid)
myr
if(n < 200) {
a<-table.start()
a<-table.row.start(a)
a<-table.element(a, 'Multiple Linear Regression - Actuals, Interpolation, and Residuals', 4, TRUE)
a<-table.row.end(a)
a<-table.row.start(a)
a<-table.element(a, 'Time or Index', 1, TRUE)
a<-table.element(a, 'Actuals', 1, TRUE)
a<-table.element(a, 'Interpolation
Forecast', 1, TRUE)
a<-table.element(a, 'Residuals
Prediction Error', 1, TRUE)
a<-table.row.end(a)
for (i in 1:n) {
a<-table.row.start(a)
a<-table.element(a,i, 1, TRUE)
a<-table.element(a,formatC(signif(x[i],6),format='g',flag=' '))
a<-table.element(a,formatC(signif(x[i]-mysum$resid[i],6),format='g',flag=' '))
a<-table.element(a,formatC(signif(mysum$resid[i],6),format='g',flag=' '))
a<-table.row.end(a)
}
a<-table.end(a)
table.save(a,file='mytable4.tab')
if (n > n25) {
a<-table.start()
a<-table.row.start(a)
a<-table.element(a,'Goldfeld-Quandt test for Heteroskedasticity',4,TRUE)
a<-table.row.end(a)
a<-table.row.start(a)
a<-table.element(a,'p-values',header=TRUE)
a<-table.element(a,'Alternative Hypothesis',3,header=TRUE)
a<-table.row.end(a)
a<-table.row.start(a)
a<-table.element(a,'breakpoint index',header=TRUE)
a<-table.element(a,'greater',header=TRUE)
a<-table.element(a,'2-sided',header=TRUE)
a<-table.element(a,'less',header=TRUE)
a<-table.row.end(a)
for (mypoint in kp3:nmkm3) {
a<-table.row.start(a)
a<-table.element(a,mypoint,header=TRUE)
a<-table.element(a,formatC(signif(gqarr[mypoint-kp3+1,1],6),format='g',flag=' '))
a<-table.element(a,formatC(signif(gqarr[mypoint-kp3+1,2],6),format='g',flag=' '))
a<-table.element(a,formatC(signif(gqarr[mypoint-kp3+1,3],6),format='g',flag=' '))
a<-table.row.end(a)
}
a<-table.end(a)
table.save(a,file='mytable5.tab')
a<-table.start()
a<-table.row.start(a)
a<-table.element(a,'Meta Analysis of Goldfeld-Quandt test for Heteroskedasticity',4,TRUE)
a<-table.row.end(a)
a<-table.row.start(a)
a<-table.element(a,'Description',header=TRUE)
a<-table.element(a,'# significant tests',header=TRUE)
a<-table.element(a,'% significant tests',header=TRUE)
a<-table.element(a,'OK/NOK',header=TRUE)
a<-table.row.end(a)
a<-table.row.start(a)
a<-table.element(a,'1% type I error level',header=TRUE)
a<-table.element(a,signif(numsignificant1,6))
a<-table.element(a,formatC(signif(numsignificant1/numgqtests,6),format='g',flag=' '))
if (numsignificant1/numgqtests < 0.01) dum <- 'OK' else dum <- 'NOK'
a<-table.element(a,dum)
a<-table.row.end(a)
a<-table.row.start(a)
a<-table.element(a,'5% type I error level',header=TRUE)
a<-table.element(a,signif(numsignificant5,6))
a<-table.element(a,signif(numsignificant5/numgqtests,6))
if (numsignificant5/numgqtests < 0.05) dum <- 'OK' else dum <- 'NOK'
a<-table.element(a,dum)
a<-table.row.end(a)
a<-table.row.start(a)
a<-table.element(a,'10% type I error level',header=TRUE)
a<-table.element(a,signif(numsignificant10,6))
a<-table.element(a,signif(numsignificant10/numgqtests,6))
if (numsignificant10/numgqtests < 0.1) dum <- 'OK' else dum <- 'NOK'
a<-table.element(a,dum)
a<-table.row.end(a)
a<-table.end(a)
table.save(a,file='mytable6.tab')
}
}
a<-table.start()
a<-table.row.start(a)
a<-table.element(a,'Ramsey RESET F-Test for powers (2 and 3) of fitted values',1,TRUE)
a<-table.row.end(a)
a<-table.row.start(a)
reset_test_fitted <- resettest(mylm,power=2:3,type='fitted')
a<-table.element(a,paste('
',RC.texteval('reset_test_fitted'),'
',sep=''))
a<-table.row.end(a)
a<-table.row.start(a)
a<-table.element(a,'Ramsey RESET F-Test for powers (2 and 3) of regressors',1,TRUE)
a<-table.row.end(a)
a<-table.row.start(a)
reset_test_regressors <- resettest(mylm,power=2:3,type='regressor')
a<-table.element(a,paste('
',RC.texteval('reset_test_regressors'),'
',sep=''))
a<-table.row.end(a)
a<-table.row.start(a)
a<-table.element(a,'Ramsey RESET F-Test for powers (2 and 3) of principal components',1,TRUE)
a<-table.row.end(a)
a<-table.row.start(a)
reset_test_principal_components <- resettest(mylm,power=2:3,type='princomp')
a<-table.element(a,paste('
',RC.texteval('reset_test_principal_components'),'
',sep=''))
a<-table.row.end(a)
a<-table.end(a)
table.save(a,file='mytable8.tab')
a<-table.start()
a<-table.row.start(a)
a<-table.element(a,'Variance Inflation Factors (Multicollinearity)',1,TRUE)
a<-table.row.end(a)
a<-table.row.start(a)
vif <- vif(mylm)
a<-table.element(a,paste('
',RC.texteval('vif'),'
',sep=''))
a<-table.row.end(a)
a<-table.end(a)
table.save(a,file='mytable9.tab')