Free Statistics

of Irreproducible Research!

Author's title

Author*The author of this computation has been verified*
R Software Modulerwasp_smp.wasp
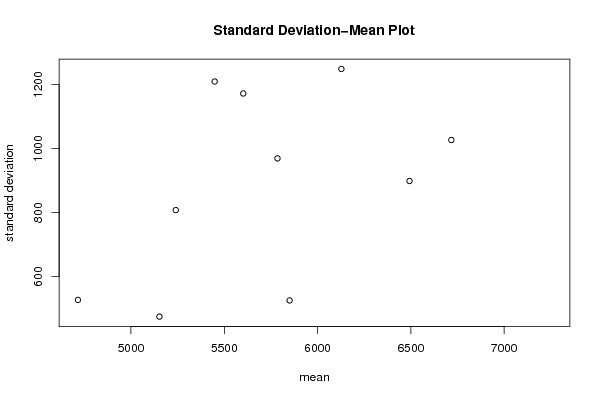
Title produced by softwareStandard Deviation-Mean Plot
Date of computationMon, 19 Dec 2016 14:29:42 +0100
Cite this page as followsStatistical Computations at FreeStatistics.org, Office for Research Development and Education, URL https://freestatistics.org/blog/index.php?v=date/2016/Dec/19/t1482154293xzemhqtw41juupx.htm/, Retrieved Fri, 17 May 2024 17:25:36 +0000
Statistical Computations at FreeStatistics.org, Office for Research Development and Education, URL https://freestatistics.org/blog/index.php?pk=301345, Retrieved Fri, 17 May 2024 17:25:36 +0000
QR Codes:

Original text written by user:
IsPrivate?No (this computation is public)
User-defined keywords
Estimated Impact88
Family? (F = Feedback message, R = changed R code, M = changed R Module, P = changed Parameters, D = changed Data)
-       [Standard Deviation-Mean Plot] [Standard Deviatio...] [2016-12-19 13:29:42] [2e2b863c9581eba851d0277c64dc678f] [Current]
Feedback Forum

Post a new message
Dataseries X:
5900
6350
8520
6600
4920
4990
3890
5110
6730
7380
6600
6540
6120
5640
6850
6620
6020
5830
5050
5590
6150
5410
5420
5500
4030
5690
6680
4950
5290
6720
4580
4500
5350
4890
5160
5040
4980
5480
5620
4790
4880
4790
4400
5170
6100
5420
5450
4750
4620
4600
3960
4270
4610
4050
4430
4660
5570
5360
5070
5390
3380
4360
3820
3990
5560
6230
6240
6320
6890
6000
6160
6430
6090
5550
5740
6790
6390
6510
6340
8750
7620
6380
5820
5930
5560
5960
4910
4000
5250
4650
4280
4760
7000
6770
6330
7750
6090
6560
8550
7050
7490
7800
6160
5040
6700
7650
5980
5530
5940
5830
7130
5790
4960
4900
4330
5100
6160
7850
5570
5860
7250
NA
NA
NA
NA
NA
NA
NA
NA
NA
NA
NA
NA
NA
NA
NA
NA
NA
NA
NA
NA
NA
NA
NA


Summary of computational transaction
Raw Input view raw input (R code)
Raw Outputview raw output of R engine
Computing time0 seconds
R ServerBig Analytics Cloud Computing Center

\begin{tabular}{lllllllll}
\hline
Summary of computational transaction \tabularnewline
Raw Input view raw input (R code)  \tabularnewline
Raw Outputview raw output of R engine  \tabularnewline
Computing time0 seconds \tabularnewline
R ServerBig Analytics Cloud Computing Center \tabularnewline
\hline
\end{tabular}
%Source: https://freestatistics.org/blog/index.php?pk=301345&T=0

[TABLE]
[ROW]
Summary of computational transaction[/C][/ROW] [ROW]Raw Input[/C] view raw input (R code) [/C][/ROW] [ROW]Raw Output[/C]view raw output of R engine [/C][/ROW] [ROW]Computing time[/C]0 seconds[/C][/ROW] [ROW]R Server[/C]Big Analytics Cloud Computing Center[/C][/ROW] [/TABLE] Source: https://freestatistics.org/blog/index.php?pk=301345&T=0

Globally Unique Identifier (entire table): ba.freestatistics.org/blog/index.php?pk=301345&T=0

As an alternative you can also use a QR Code:  

The GUIDs for individual cells are displayed in the table below:

Summary of computational transaction
Raw Input view raw input (R code)
Raw Outputview raw output of R engine
Computing time0 seconds
R ServerBig Analytics Cloud Computing Center


Standard Deviation-Mean Plot
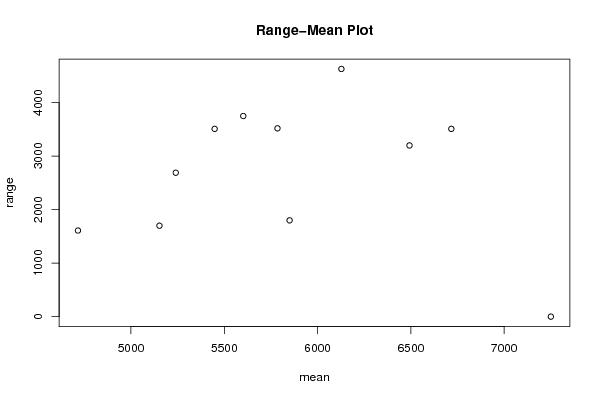
SectionMeanStandard DeviationRange
16127.51249.269786715424630
25850525.5127366331251800
35240807.994149393762690
45152.5474.7271943873761700
54715.83333333333527.1270044191241610
65448.333333333331209.942397827523510
76492.5898.8894663568333200
85601.666666666671172.587142203343750
96716.666666666671027.108326882573510
105785969.625044681053520
117250NA0
12NaNNA-Inf

\begin{tabular}{lllllllll}
\hline
Standard Deviation-Mean Plot \tabularnewline
Section & Mean & Standard Deviation & Range \tabularnewline
1 & 6127.5 & 1249.26978671542 & 4630 \tabularnewline
2 & 5850 & 525.512736633125 & 1800 \tabularnewline
3 & 5240 & 807.99414939376 & 2690 \tabularnewline
4 & 5152.5 & 474.727194387376 & 1700 \tabularnewline
5 & 4715.83333333333 & 527.127004419124 & 1610 \tabularnewline
6 & 5448.33333333333 & 1209.94239782752 & 3510 \tabularnewline
7 & 6492.5 & 898.889466356833 & 3200 \tabularnewline
8 & 5601.66666666667 & 1172.58714220334 & 3750 \tabularnewline
9 & 6716.66666666667 & 1027.10832688257 & 3510 \tabularnewline
10 & 5785 & 969.62504468105 & 3520 \tabularnewline
11 & 7250 & NA & 0 \tabularnewline
12 & NaN & NA & -Inf \tabularnewline
\hline
\end{tabular}
%Source: https://freestatistics.org/blog/index.php?pk=301345&T=1

[TABLE]
[ROW][C]Standard Deviation-Mean Plot[/C][/ROW]
[ROW][C]Section[/C][C]Mean[/C][C]Standard Deviation[/C][C]Range[/C][/ROW]
[ROW][C]1[/C][C]6127.5[/C][C]1249.26978671542[/C][C]4630[/C][/ROW]
[ROW][C]2[/C][C]5850[/C][C]525.512736633125[/C][C]1800[/C][/ROW]
[ROW][C]3[/C][C]5240[/C][C]807.99414939376[/C][C]2690[/C][/ROW]
[ROW][C]4[/C][C]5152.5[/C][C]474.727194387376[/C][C]1700[/C][/ROW]
[ROW][C]5[/C][C]4715.83333333333[/C][C]527.127004419124[/C][C]1610[/C][/ROW]
[ROW][C]6[/C][C]5448.33333333333[/C][C]1209.94239782752[/C][C]3510[/C][/ROW]
[ROW][C]7[/C][C]6492.5[/C][C]898.889466356833[/C][C]3200[/C][/ROW]
[ROW][C]8[/C][C]5601.66666666667[/C][C]1172.58714220334[/C][C]3750[/C][/ROW]
[ROW][C]9[/C][C]6716.66666666667[/C][C]1027.10832688257[/C][C]3510[/C][/ROW]
[ROW][C]10[/C][C]5785[/C][C]969.62504468105[/C][C]3520[/C][/ROW]
[ROW][C]11[/C][C]7250[/C][C]NA[/C][C]0[/C][/ROW]
[ROW][C]12[/C][C]NaN[/C][C]NA[/C][C]-Inf[/C][/ROW]
[/TABLE]
Source: https://freestatistics.org/blog/index.php?pk=301345&T=1

Globally Unique Identifier (entire table): ba.freestatistics.org/blog/index.php?pk=301345&T=1

As an alternative you can also use a QR Code:  

The GUIDs for individual cells are displayed in the table below:

Standard Deviation-Mean Plot
SectionMeanStandard DeviationRange
16127.51249.269786715424630
25850525.5127366331251800
35240807.994149393762690
45152.5474.7271943873761700
54715.83333333333527.1270044191241610
65448.333333333331209.942397827523510
76492.5898.8894663568333200
85601.666666666671172.587142203343750
96716.666666666671027.108326882573510
105785969.625044681053520
117250NA0
12NaNNA-Inf


Regression: S.E.(k) = alpha + beta * Mean(k)
alpha-392.132681612742
beta0.223772274910337
S.D.0.149021301408867
T-STAT1.50161267412621
p-value0.171594844679979

\begin{tabular}{lllllllll}
\hline
Regression: S.E.(k) = alpha + beta * Mean(k) \tabularnewline
alpha & -392.132681612742 \tabularnewline
beta & 0.223772274910337 \tabularnewline
S.D. & 0.149021301408867 \tabularnewline
T-STAT & 1.50161267412621 \tabularnewline
p-value & 0.171594844679979 \tabularnewline
\hline
\end{tabular}
%Source: https://freestatistics.org/blog/index.php?pk=301345&T=2

[TABLE]
[ROW][C]Regression: S.E.(k) = alpha + beta * Mean(k)[/C][/ROW]
[ROW][C]alpha[/C][C]-392.132681612742[/C][/ROW]
[ROW][C]beta[/C][C]0.223772274910337[/C][/ROW]
[ROW][C]S.D.[/C][C]0.149021301408867[/C][/ROW]
[ROW][C]T-STAT[/C][C]1.50161267412621[/C][/ROW]
[ROW][C]p-value[/C][C]0.171594844679979[/C][/ROW]
[/TABLE]
Source: https://freestatistics.org/blog/index.php?pk=301345&T=2

Globally Unique Identifier (entire table): ba.freestatistics.org/blog/index.php?pk=301345&T=2

As an alternative you can also use a QR Code:  

The GUIDs for individual cells are displayed in the table below:

Regression: S.E.(k) = alpha + beta * Mean(k)
alpha-392.132681612742
beta0.223772274910337
S.D.0.149021301408867
T-STAT1.50161267412621
p-value0.171594844679979


Regression: ln S.E.(k) = alpha + beta * ln Mean(k)
alpha-8.62324424511226
beta1.77588765083569
S.D.1.03230977193306
T-STAT1.72030498898623
p-value0.123688364332204
Lambda-0.775887650835687

\begin{tabular}{lllllllll}
\hline
Regression: ln S.E.(k) = alpha + beta * ln Mean(k) \tabularnewline
alpha & -8.62324424511226 \tabularnewline
beta & 1.77588765083569 \tabularnewline
S.D. & 1.03230977193306 \tabularnewline
T-STAT & 1.72030498898623 \tabularnewline
p-value & 0.123688364332204 \tabularnewline
Lambda & -0.775887650835687 \tabularnewline
\hline
\end{tabular}
%Source: https://freestatistics.org/blog/index.php?pk=301345&T=3

[TABLE]
[ROW][C]Regression: ln S.E.(k) = alpha + beta * ln Mean(k)[/C][/ROW]
[ROW][C]alpha[/C][C]-8.62324424511226[/C][/ROW]
[ROW][C]beta[/C][C]1.77588765083569[/C][/ROW]
[ROW][C]S.D.[/C][C]1.03230977193306[/C][/ROW]
[ROW][C]T-STAT[/C][C]1.72030498898623[/C][/ROW]
[ROW][C]p-value[/C][C]0.123688364332204[/C][/ROW]
[ROW][C]Lambda[/C][C]-0.775887650835687[/C][/ROW]
[/TABLE]
Source: https://freestatistics.org/blog/index.php?pk=301345&T=3

Globally Unique Identifier (entire table): ba.freestatistics.org/blog/index.php?pk=301345&T=3

As an alternative you can also use a QR Code:  

The GUIDs for individual cells are displayed in the table below:

Regression: ln S.E.(k) = alpha + beta * ln Mean(k)
alpha-8.62324424511226
beta1.77588765083569
S.D.1.03230977193306
T-STAT1.72030498898623
p-value0.123688364332204
Lambda-0.775887650835687


Parameters (Session):
par1 = 12 ;
Parameters (R input):
par1 = 12 ;
R code (references can be found in the software module):
par1 <- as.numeric(par1)
(n <- length(x))
(np <- floor(n / par1))
arr <- array(NA,dim=c(par1,np))
j <- 0
k <- 1
for (i in 1:(np*par1))
{
j = j + 1
arr[j,k] <- x[i]
if (j == par1) {
j = 0
k=k+1
}
}
arr
arr.mean <- array(NA,dim=np)
arr.sd <- array(NA,dim=np)
arr.range <- array(NA,dim=np)
for (j in 1:np)
{
arr.mean[j] <- mean(arr[,j],na.rm=TRUE)
arr.sd[j] <- sd(arr[,j],na.rm=TRUE)
arr.range[j] <- max(arr[,j],na.rm=TRUE) - min(arr[,j],na.rm=TRUE)
}
arr.mean
arr.sd
arr.range
(lm1 <- lm(arr.sd~arr.mean))
(lnlm1 <- lm(log(arr.sd)~log(arr.mean)))
(lm2 <- lm(arr.range~arr.mean))
bitmap(file='test1.png')
plot(arr.mean,arr.sd,main='Standard Deviation-Mean Plot',xlab='mean',ylab='standard deviation')
dev.off()
bitmap(file='test2.png')
plot(arr.mean,arr.range,main='Range-Mean Plot',xlab='mean',ylab='range')
dev.off()
load(file='createtable')
a<-table.start()
a<-table.row.start(a)
a<-table.element(a,'Standard Deviation-Mean Plot',4,TRUE)
a<-table.row.end(a)
a<-table.row.start(a)
a<-table.element(a,'Section',header=TRUE)
a<-table.element(a,'Mean',header=TRUE)
a<-table.element(a,'Standard Deviation',header=TRUE)
a<-table.element(a,'Range',header=TRUE)
a<-table.row.end(a)
for (j in 1:np) {
a<-table.row.start(a)
a<-table.element(a,j,header=TRUE)
a<-table.element(a,arr.mean[j])
a<-table.element(a,arr.sd[j] )
a<-table.element(a,arr.range[j] )
a<-table.row.end(a)
}
a<-table.end(a)
table.save(a,file='mytable.tab')
a<-table.start()
a<-table.row.start(a)
a<-table.element(a,'Regression: S.E.(k) = alpha + beta * Mean(k)',2,TRUE)
a<-table.row.end(a)
a<-table.row.start(a)
a<-table.element(a,'alpha',header=TRUE)
a<-table.element(a,lm1$coefficients[[1]])
a<-table.row.end(a)
a<-table.row.start(a)
a<-table.element(a,'beta',header=TRUE)
a<-table.element(a,lm1$coefficients[[2]])
a<-table.row.end(a)
a<-table.row.start(a)
a<-table.element(a,'S.D.',header=TRUE)
a<-table.element(a,summary(lm1)$coefficients[2,2])
a<-table.row.end(a)
a<-table.row.start(a)
a<-table.element(a,'T-STAT',header=TRUE)
a<-table.element(a,summary(lm1)$coefficients[2,3])
a<-table.row.end(a)
a<-table.row.start(a)
a<-table.element(a,'p-value',header=TRUE)
a<-table.element(a,summary(lm1)$coefficients[2,4])
a<-table.row.end(a)
a<-table.end(a)
table.save(a,file='mytable1.tab')
a<-table.start()
a<-table.row.start(a)
a<-table.element(a,'Regression: ln S.E.(k) = alpha + beta * ln Mean(k)',2,TRUE)
a<-table.row.end(a)
a<-table.row.start(a)
a<-table.element(a,'alpha',header=TRUE)
a<-table.element(a,lnlm1$coefficients[[1]])
a<-table.row.end(a)
a<-table.row.start(a)
a<-table.element(a,'beta',header=TRUE)
a<-table.element(a,lnlm1$coefficients[[2]])
a<-table.row.end(a)
a<-table.row.start(a)
a<-table.element(a,'S.D.',header=TRUE)
a<-table.element(a,summary(lnlm1)$coefficients[2,2])
a<-table.row.end(a)
a<-table.row.start(a)
a<-table.element(a,'T-STAT',header=TRUE)
a<-table.element(a,summary(lnlm1)$coefficients[2,3])
a<-table.row.end(a)
a<-table.row.start(a)
a<-table.element(a,'p-value',header=TRUE)
a<-table.element(a,summary(lnlm1)$coefficients[2,4])
a<-table.row.end(a)
a<-table.row.start(a)
a<-table.element(a,'Lambda',header=TRUE)
a<-table.element(a,1-lnlm1$coefficients[[2]])
a<-table.row.end(a)
a<-table.end(a)
table.save(a,file='mytable2.tab')