Free Statistics

of Irreproducible Research!

Author's title

Author*The author of this computation has been verified*
R Software Modulerwasp_arimabackwardselection.wasp
Title produced by softwareARIMA Backward Selection
Date of computationMon, 19 Dec 2016 13:01:52 +0100
Cite this page as followsStatistical Computations at FreeStatistics.org, Office for Research Development and Education, URL https://freestatistics.org/blog/index.php?v=date/2016/Dec/19/t14821489724ozj3mwqoywma4q.htm/, Retrieved Fri, 17 May 2024 16:05:36 +0000
Statistical Computations at FreeStatistics.org, Office for Research Development and Education, URL https://freestatistics.org/blog/index.php?pk=301315, Retrieved Fri, 17 May 2024 16:05:36 +0000
QR Codes:

Original text written by user:
IsPrivate?No (this computation is public)
User-defined keywords
Estimated Impact84
Family? (F = Feedback message, R = changed R code, M = changed R Module, P = changed Parameters, D = changed Data)
-       [ARIMA Backward Selection] [ARIMA] [2016-12-19 12:01:52] [3373ac80755a3c11b71e203db9ac7f73] [Current]
Feedback Forum

Post a new message
Dataseries X:
4150
4300
4300
4450
4500
4400
3950
2150
4350
4550
4600
4250
4350
4400
4300
4350
4350
4400
3850
2300
4300
4350
4350
4200
4150
4450
4300
4350
4300
4350
3900
2250
4300
4450
4400
4250
4250
4300
4450
3900
4350
4500
3800
2450
4400
4500
4500
4400
4450
4600
4700
4700
2950
3750
4050
2550
4600
5000
5100
4900
4950
5000
4950
5100
5250
5200
4300
2650
4950
5200
5350
5150
5350
5550
5400
5450
5450
5200
4400
2650
5100
5200
5300
4900
5200
5300
5250
5150
5050
4900
4150
2800
5100
5250
5200
5000
5150
5250
5250
5350
5450
5300
4300
3000
5300
5400
5550
5350
5500
5750
5750
5700
5800
5800
4600
3150
5500
5750
5950
5600
6100
6250
6150
6050
6300
5950


Summary of computational transaction
Raw Input view raw input (R code)
Raw Outputview raw output of R engine
Computing time8 seconds
R ServerBig Analytics Cloud Computing Center

\begin{tabular}{lllllllll}
\hline
Summary of computational transaction \tabularnewline
Raw Input view raw input (R code)  \tabularnewline
Raw Outputview raw output of R engine  \tabularnewline
Computing time8 seconds \tabularnewline
R ServerBig Analytics Cloud Computing Center \tabularnewline
\hline
\end{tabular}
%Source: https://freestatistics.org/blog/index.php?pk=301315&T=0

[TABLE]
[ROW]
Summary of computational transaction[/C][/ROW] [ROW]Raw Input[/C] view raw input (R code) [/C][/ROW] [ROW]Raw Output[/C]view raw output of R engine [/C][/ROW] [ROW]Computing time[/C]8 seconds[/C][/ROW] [ROW]R Server[/C]Big Analytics Cloud Computing Center[/C][/ROW] [/TABLE] Source: https://freestatistics.org/blog/index.php?pk=301315&T=0

Globally Unique Identifier (entire table): ba.freestatistics.org/blog/index.php?pk=301315&T=0

As an alternative you can also use a QR Code:  

The GUIDs for individual cells are displayed in the table below:

Summary of computational transaction
Raw Input view raw input (R code)
Raw Outputview raw output of R engine
Computing time8 seconds
R ServerBig Analytics Cloud Computing Center


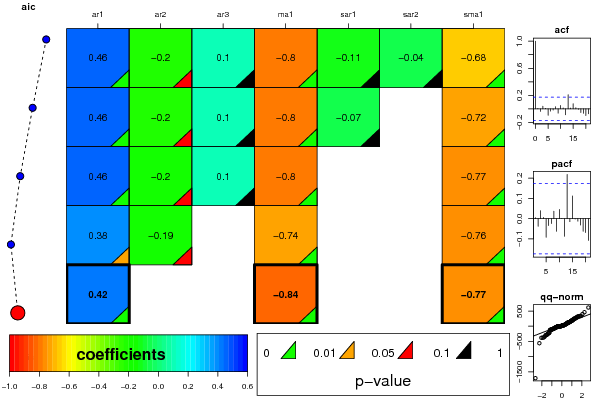
ARIMA Parameter Estimation and Backward Selection
Iterationar1ar2ar3ma1sar1sar2sma1
Estimates ( 1 )0.4609-0.2030.1015-0.801-0.1095-0.0421-0.6795
(p-val)(0.0049 )(0.0612 )(0.3991 )(0 )(0.5754 )(0.7694 )(0.0013 )
Estimates ( 2 )0.4633-0.20220.1013-0.8007-0.06860-0.7249
(p-val)(0.0049 )(0.0627 )(0.4008 )(0 )(0.6109 )(NA )(0 )
Estimates ( 3 )0.4588-0.19840.0987-0.804500-0.7719
(p-val)(0.0048 )(0.0673 )(0.4116 )(0 )(NA )(NA )(0 )
Estimates ( 4 )0.3771-0.19260-0.735600-0.7643
(p-val)(0.0102 )(0.081 )(NA )(0 )(NA )(NA )(0 )
Estimates ( 5 )0.419300-0.835500-0.7705
(p-val)(0.0012 )(NA )(NA )(0 )(NA )(NA )(0 )
Estimates ( 6 )NANANANANANANA
(p-val)(NA )(NA )(NA )(NA )(NA )(NA )(NA )
Estimates ( 7 )NANANANANANANA
(p-val)(NA )(NA )(NA )(NA )(NA )(NA )(NA )
Estimates ( 8 )NANANANANANANA
(p-val)(NA )(NA )(NA )(NA )(NA )(NA )(NA )
Estimates ( 9 )NANANANANANANA
(p-val)(NA )(NA )(NA )(NA )(NA )(NA )(NA )
Estimates ( 10 )NANANANANANANA
(p-val)(NA )(NA )(NA )(NA )(NA )(NA )(NA )
Estimates ( 11 )NANANANANANANA
(p-val)(NA )(NA )(NA )(NA )(NA )(NA )(NA )
Estimates ( 12 )NANANANANANANA
(p-val)(NA )(NA )(NA )(NA )(NA )(NA )(NA )
Estimates ( 13 )NANANANANANANA
(p-val)(NA )(NA )(NA )(NA )(NA )(NA )(NA )

\begin{tabular}{lllllllll}
\hline
ARIMA Parameter Estimation and Backward Selection \tabularnewline
Iteration & ar1 & ar2 & ar3 & ma1 & sar1 & sar2 & sma1 \tabularnewline
Estimates ( 1 ) & 0.4609 & -0.203 & 0.1015 & -0.801 & -0.1095 & -0.0421 & -0.6795 \tabularnewline
(p-val) & (0.0049 ) & (0.0612 ) & (0.3991 ) & (0 ) & (0.5754 ) & (0.7694 ) & (0.0013 ) \tabularnewline
Estimates ( 2 ) & 0.4633 & -0.2022 & 0.1013 & -0.8007 & -0.0686 & 0 & -0.7249 \tabularnewline
(p-val) & (0.0049 ) & (0.0627 ) & (0.4008 ) & (0 ) & (0.6109 ) & (NA ) & (0 ) \tabularnewline
Estimates ( 3 ) & 0.4588 & -0.1984 & 0.0987 & -0.8045 & 0 & 0 & -0.7719 \tabularnewline
(p-val) & (0.0048 ) & (0.0673 ) & (0.4116 ) & (0 ) & (NA ) & (NA ) & (0 ) \tabularnewline
Estimates ( 4 ) & 0.3771 & -0.1926 & 0 & -0.7356 & 0 & 0 & -0.7643 \tabularnewline
(p-val) & (0.0102 ) & (0.081 ) & (NA ) & (0 ) & (NA ) & (NA ) & (0 ) \tabularnewline
Estimates ( 5 ) & 0.4193 & 0 & 0 & -0.8355 & 0 & 0 & -0.7705 \tabularnewline
(p-val) & (0.0012 ) & (NA ) & (NA ) & (0 ) & (NA ) & (NA ) & (0 ) \tabularnewline
Estimates ( 6 ) & NA & NA & NA & NA & NA & NA & NA \tabularnewline
(p-val) & (NA ) & (NA ) & (NA ) & (NA ) & (NA ) & (NA ) & (NA ) \tabularnewline
Estimates ( 7 ) & NA & NA & NA & NA & NA & NA & NA \tabularnewline
(p-val) & (NA ) & (NA ) & (NA ) & (NA ) & (NA ) & (NA ) & (NA ) \tabularnewline
Estimates ( 8 ) & NA & NA & NA & NA & NA & NA & NA \tabularnewline
(p-val) & (NA ) & (NA ) & (NA ) & (NA ) & (NA ) & (NA ) & (NA ) \tabularnewline
Estimates ( 9 ) & NA & NA & NA & NA & NA & NA & NA \tabularnewline
(p-val) & (NA ) & (NA ) & (NA ) & (NA ) & (NA ) & (NA ) & (NA ) \tabularnewline
Estimates ( 10 ) & NA & NA & NA & NA & NA & NA & NA \tabularnewline
(p-val) & (NA ) & (NA ) & (NA ) & (NA ) & (NA ) & (NA ) & (NA ) \tabularnewline
Estimates ( 11 ) & NA & NA & NA & NA & NA & NA & NA \tabularnewline
(p-val) & (NA ) & (NA ) & (NA ) & (NA ) & (NA ) & (NA ) & (NA ) \tabularnewline
Estimates ( 12 ) & NA & NA & NA & NA & NA & NA & NA \tabularnewline
(p-val) & (NA ) & (NA ) & (NA ) & (NA ) & (NA ) & (NA ) & (NA ) \tabularnewline
Estimates ( 13 ) & NA & NA & NA & NA & NA & NA & NA \tabularnewline
(p-val) & (NA ) & (NA ) & (NA ) & (NA ) & (NA ) & (NA ) & (NA ) \tabularnewline
\hline
\end{tabular}
%Source: https://freestatistics.org/blog/index.php?pk=301315&T=1

[TABLE]
[ROW][C]ARIMA Parameter Estimation and Backward Selection[/C][/ROW]
[ROW][C]Iteration[/C][C]ar1[/C][C]ar2[/C][C]ar3[/C][C]ma1[/C][C]sar1[/C][C]sar2[/C][C]sma1[/C][/ROW]
[ROW][C]Estimates ( 1 )[/C][C]0.4609[/C][C]-0.203[/C][C]0.1015[/C][C]-0.801[/C][C]-0.1095[/C][C]-0.0421[/C][C]-0.6795[/C][/ROW]
[ROW][C](p-val)[/C][C](0.0049 )[/C][C](0.0612 )[/C][C](0.3991 )[/C][C](0 )[/C][C](0.5754 )[/C][C](0.7694 )[/C][C](0.0013 )[/C][/ROW]
[ROW][C]Estimates ( 2 )[/C][C]0.4633[/C][C]-0.2022[/C][C]0.1013[/C][C]-0.8007[/C][C]-0.0686[/C][C]0[/C][C]-0.7249[/C][/ROW]
[ROW][C](p-val)[/C][C](0.0049 )[/C][C](0.0627 )[/C][C](0.4008 )[/C][C](0 )[/C][C](0.6109 )[/C][C](NA )[/C][C](0 )[/C][/ROW]
[ROW][C]Estimates ( 3 )[/C][C]0.4588[/C][C]-0.1984[/C][C]0.0987[/C][C]-0.8045[/C][C]0[/C][C]0[/C][C]-0.7719[/C][/ROW]
[ROW][C](p-val)[/C][C](0.0048 )[/C][C](0.0673 )[/C][C](0.4116 )[/C][C](0 )[/C][C](NA )[/C][C](NA )[/C][C](0 )[/C][/ROW]
[ROW][C]Estimates ( 4 )[/C][C]0.3771[/C][C]-0.1926[/C][C]0[/C][C]-0.7356[/C][C]0[/C][C]0[/C][C]-0.7643[/C][/ROW]
[ROW][C](p-val)[/C][C](0.0102 )[/C][C](0.081 )[/C][C](NA )[/C][C](0 )[/C][C](NA )[/C][C](NA )[/C][C](0 )[/C][/ROW]
[ROW][C]Estimates ( 5 )[/C][C]0.4193[/C][C]0[/C][C]0[/C][C]-0.8355[/C][C]0[/C][C]0[/C][C]-0.7705[/C][/ROW]
[ROW][C](p-val)[/C][C](0.0012 )[/C][C](NA )[/C][C](NA )[/C][C](0 )[/C][C](NA )[/C][C](NA )[/C][C](0 )[/C][/ROW]
[ROW][C]Estimates ( 6 )[/C][C]NA[/C][C]NA[/C][C]NA[/C][C]NA[/C][C]NA[/C][C]NA[/C][C]NA[/C][/ROW]
[ROW][C](p-val)[/C][C](NA )[/C][C](NA )[/C][C](NA )[/C][C](NA )[/C][C](NA )[/C][C](NA )[/C][C](NA )[/C][/ROW]
[ROW][C]Estimates ( 7 )[/C][C]NA[/C][C]NA[/C][C]NA[/C][C]NA[/C][C]NA[/C][C]NA[/C][C]NA[/C][/ROW]
[ROW][C](p-val)[/C][C](NA )[/C][C](NA )[/C][C](NA )[/C][C](NA )[/C][C](NA )[/C][C](NA )[/C][C](NA )[/C][/ROW]
[ROW][C]Estimates ( 8 )[/C][C]NA[/C][C]NA[/C][C]NA[/C][C]NA[/C][C]NA[/C][C]NA[/C][C]NA[/C][/ROW]
[ROW][C](p-val)[/C][C](NA )[/C][C](NA )[/C][C](NA )[/C][C](NA )[/C][C](NA )[/C][C](NA )[/C][C](NA )[/C][/ROW]
[ROW][C]Estimates ( 9 )[/C][C]NA[/C][C]NA[/C][C]NA[/C][C]NA[/C][C]NA[/C][C]NA[/C][C]NA[/C][/ROW]
[ROW][C](p-val)[/C][C](NA )[/C][C](NA )[/C][C](NA )[/C][C](NA )[/C][C](NA )[/C][C](NA )[/C][C](NA )[/C][/ROW]
[ROW][C]Estimates ( 10 )[/C][C]NA[/C][C]NA[/C][C]NA[/C][C]NA[/C][C]NA[/C][C]NA[/C][C]NA[/C][/ROW]
[ROW][C](p-val)[/C][C](NA )[/C][C](NA )[/C][C](NA )[/C][C](NA )[/C][C](NA )[/C][C](NA )[/C][C](NA )[/C][/ROW]
[ROW][C]Estimates ( 11 )[/C][C]NA[/C][C]NA[/C][C]NA[/C][C]NA[/C][C]NA[/C][C]NA[/C][C]NA[/C][/ROW]
[ROW][C](p-val)[/C][C](NA )[/C][C](NA )[/C][C](NA )[/C][C](NA )[/C][C](NA )[/C][C](NA )[/C][C](NA )[/C][/ROW]
[ROW][C]Estimates ( 12 )[/C][C]NA[/C][C]NA[/C][C]NA[/C][C]NA[/C][C]NA[/C][C]NA[/C][C]NA[/C][/ROW]
[ROW][C](p-val)[/C][C](NA )[/C][C](NA )[/C][C](NA )[/C][C](NA )[/C][C](NA )[/C][C](NA )[/C][C](NA )[/C][/ROW]
[ROW][C]Estimates ( 13 )[/C][C]NA[/C][C]NA[/C][C]NA[/C][C]NA[/C][C]NA[/C][C]NA[/C][C]NA[/C][/ROW]
[ROW][C](p-val)[/C][C](NA )[/C][C](NA )[/C][C](NA )[/C][C](NA )[/C][C](NA )[/C][C](NA )[/C][C](NA )[/C][/ROW]
[/TABLE]
Source: https://freestatistics.org/blog/index.php?pk=301315&T=1

Globally Unique Identifier (entire table): ba.freestatistics.org/blog/index.php?pk=301315&T=1

As an alternative you can also use a QR Code:  

The GUIDs for individual cells are displayed in the table below:

ARIMA Parameter Estimation and Backward Selection
Iterationar1ar2ar3ma1sar1sar2sma1
Estimates ( 1 )0.4609-0.2030.1015-0.801-0.1095-0.0421-0.6795
(p-val)(0.0049 )(0.0612 )(0.3991 )(0 )(0.5754 )(0.7694 )(0.0013 )
Estimates ( 2 )0.4633-0.20220.1013-0.8007-0.06860-0.7249
(p-val)(0.0049 )(0.0627 )(0.4008 )(0 )(0.6109 )(NA )(0 )
Estimates ( 3 )0.4588-0.19840.0987-0.804500-0.7719
(p-val)(0.0048 )(0.0673 )(0.4116 )(0 )(NA )(NA )(0 )
Estimates ( 4 )0.3771-0.19260-0.735600-0.7643
(p-val)(0.0102 )(0.081 )(NA )(0 )(NA )(NA )(0 )
Estimates ( 5 )0.419300-0.835500-0.7705
(p-val)(0.0012 )(NA )(NA )(0 )(NA )(NA )(0 )
Estimates ( 6 )NANANANANANANA
(p-val)(NA )(NA )(NA )(NA )(NA )(NA )(NA )
Estimates ( 7 )NANANANANANANA
(p-val)(NA )(NA )(NA )(NA )(NA )(NA )(NA )
Estimates ( 8 )NANANANANANANA
(p-val)(NA )(NA )(NA )(NA )(NA )(NA )(NA )
Estimates ( 9 )NANANANANANANA
(p-val)(NA )(NA )(NA )(NA )(NA )(NA )(NA )
Estimates ( 10 )NANANANANANANA
(p-val)(NA )(NA )(NA )(NA )(NA )(NA )(NA )
Estimates ( 11 )NANANANANANANA
(p-val)(NA )(NA )(NA )(NA )(NA )(NA )(NA )
Estimates ( 12 )NANANANANANANA
(p-val)(NA )(NA )(NA )(NA )(NA )(NA )(NA )
Estimates ( 13 )NANANANANANANA
(p-val)(NA )(NA )(NA )(NA )(NA )(NA )(NA )


Estimated ARIMA Residuals
Value
-13.8122531054313
-71.3380123652028
-85.6266863174045
-117.109447688377
-105.252206146099
42.7248214364215
-100.019533583678
177.832118758698
-120.164468425617
-112.712045379989
-106.412929266582
96.1745459847655
-82.4844451366706
181.041429052819
-41.1525491152924
-4.58915913862132
-70.8878056344728
30.6331177058615
31.8093505893012
37.1182085318387
-13.3685278921308
33.056999320586
-61.3577357264144
79.9195429997263
11.7596221418898
-91.3623724302746
203.337596520498
-557.496957604864
292.371347417766
74.7806380747335
-120.9629664289
313.688801701814
-45.0130242774151
38.3741392008107
19.4334712065887
118.991329345278
96.3080721267973
86.274628740497
178.706643033786
201.636999305955
-1706.70537468536
190.377609507551
337.660274018659
142.306876498347
249.226822919117
460.962453010427
338.759764193574
246.621917457127
246.119716114814
73.6183598269168
29.0366243931795
257.63679921348
615.634487237138
-2.88323391976631
-362.966075382351
-207.944535562103
27.3580900074642
-45.382427411953
118.900443130248
38.4598688981352
231.947588841583
184.556386402232
-10.267081514124
135.874260979032
287.871106029833
-289.652410108269
-337.170929945513
-378.671003172893
61.2772187240411
-227.778600442956
-18.7919319711304
-258.655469731631
126.330777077876
-70.5912423518573
-5.98529762960351
-102.120996979559
42.6405922048416
-238.439544073932
-275.930854936204
96.9252100883854
37.7706864023297
4.70082798521051
-81.1252784554187
20.8182233072231
1.36484533044702
-28.1291726756262
35.2126086959282
132.370697233805
320.462664655093
-5.69847846488621
-291.319991403879
157.001749557219
23.2532248927309
-40.6413504291676
124.199497938953
67.5580280287141
77.3908574087069
184.482431590501
121.689070305394
49.6209580035767
262.728636645932
130.476400117905
-378.625615809932
-41.6271658359722
-32.8708115195715
33.9744282704355
145.287359669221
-51.0525945716818
398.989543258086
130.2502197049
90.1653116557591
4.40145828869878
325.14210193622
-224.468663638034

\begin{tabular}{lllllllll}
\hline
Estimated ARIMA Residuals \tabularnewline
Value \tabularnewline
-13.8122531054313 \tabularnewline
-71.3380123652028 \tabularnewline
-85.6266863174045 \tabularnewline
-117.109447688377 \tabularnewline
-105.252206146099 \tabularnewline
42.7248214364215 \tabularnewline
-100.019533583678 \tabularnewline
177.832118758698 \tabularnewline
-120.164468425617 \tabularnewline
-112.712045379989 \tabularnewline
-106.412929266582 \tabularnewline
96.1745459847655 \tabularnewline
-82.4844451366706 \tabularnewline
181.041429052819 \tabularnewline
-41.1525491152924 \tabularnewline
-4.58915913862132 \tabularnewline
-70.8878056344728 \tabularnewline
30.6331177058615 \tabularnewline
31.8093505893012 \tabularnewline
37.1182085318387 \tabularnewline
-13.3685278921308 \tabularnewline
33.056999320586 \tabularnewline
-61.3577357264144 \tabularnewline
79.9195429997263 \tabularnewline
11.7596221418898 \tabularnewline
-91.3623724302746 \tabularnewline
203.337596520498 \tabularnewline
-557.496957604864 \tabularnewline
292.371347417766 \tabularnewline
74.7806380747335 \tabularnewline
-120.9629664289 \tabularnewline
313.688801701814 \tabularnewline
-45.0130242774151 \tabularnewline
38.3741392008107 \tabularnewline
19.4334712065887 \tabularnewline
118.991329345278 \tabularnewline
96.3080721267973 \tabularnewline
86.274628740497 \tabularnewline
178.706643033786 \tabularnewline
201.636999305955 \tabularnewline
-1706.70537468536 \tabularnewline
190.377609507551 \tabularnewline
337.660274018659 \tabularnewline
142.306876498347 \tabularnewline
249.226822919117 \tabularnewline
460.962453010427 \tabularnewline
338.759764193574 \tabularnewline
246.621917457127 \tabularnewline
246.119716114814 \tabularnewline
73.6183598269168 \tabularnewline
29.0366243931795 \tabularnewline
257.63679921348 \tabularnewline
615.634487237138 \tabularnewline
-2.88323391976631 \tabularnewline
-362.966075382351 \tabularnewline
-207.944535562103 \tabularnewline
27.3580900074642 \tabularnewline
-45.382427411953 \tabularnewline
118.900443130248 \tabularnewline
38.4598688981352 \tabularnewline
231.947588841583 \tabularnewline
184.556386402232 \tabularnewline
-10.267081514124 \tabularnewline
135.874260979032 \tabularnewline
287.871106029833 \tabularnewline
-289.652410108269 \tabularnewline
-337.170929945513 \tabularnewline
-378.671003172893 \tabularnewline
61.2772187240411 \tabularnewline
-227.778600442956 \tabularnewline
-18.7919319711304 \tabularnewline
-258.655469731631 \tabularnewline
126.330777077876 \tabularnewline
-70.5912423518573 \tabularnewline
-5.98529762960351 \tabularnewline
-102.120996979559 \tabularnewline
42.6405922048416 \tabularnewline
-238.439544073932 \tabularnewline
-275.930854936204 \tabularnewline
96.9252100883854 \tabularnewline
37.7706864023297 \tabularnewline
4.70082798521051 \tabularnewline
-81.1252784554187 \tabularnewline
20.8182233072231 \tabularnewline
1.36484533044702 \tabularnewline
-28.1291726756262 \tabularnewline
35.2126086959282 \tabularnewline
132.370697233805 \tabularnewline
320.462664655093 \tabularnewline
-5.69847846488621 \tabularnewline
-291.319991403879 \tabularnewline
157.001749557219 \tabularnewline
23.2532248927309 \tabularnewline
-40.6413504291676 \tabularnewline
124.199497938953 \tabularnewline
67.5580280287141 \tabularnewline
77.3908574087069 \tabularnewline
184.482431590501 \tabularnewline
121.689070305394 \tabularnewline
49.6209580035767 \tabularnewline
262.728636645932 \tabularnewline
130.476400117905 \tabularnewline
-378.625615809932 \tabularnewline
-41.6271658359722 \tabularnewline
-32.8708115195715 \tabularnewline
33.9744282704355 \tabularnewline
145.287359669221 \tabularnewline
-51.0525945716818 \tabularnewline
398.989543258086 \tabularnewline
130.2502197049 \tabularnewline
90.1653116557591 \tabularnewline
4.40145828869878 \tabularnewline
325.14210193622 \tabularnewline
-224.468663638034 \tabularnewline
\hline
\end{tabular}
%Source: https://freestatistics.org/blog/index.php?pk=301315&T=2

[TABLE]
[ROW][C]Estimated ARIMA Residuals[/C][/ROW]
[ROW][C]Value[/C][/ROW]
[ROW][C]-13.8122531054313[/C][/ROW]
[ROW][C]-71.3380123652028[/C][/ROW]
[ROW][C]-85.6266863174045[/C][/ROW]
[ROW][C]-117.109447688377[/C][/ROW]
[ROW][C]-105.252206146099[/C][/ROW]
[ROW][C]42.7248214364215[/C][/ROW]
[ROW][C]-100.019533583678[/C][/ROW]
[ROW][C]177.832118758698[/C][/ROW]
[ROW][C]-120.164468425617[/C][/ROW]
[ROW][C]-112.712045379989[/C][/ROW]
[ROW][C]-106.412929266582[/C][/ROW]
[ROW][C]96.1745459847655[/C][/ROW]
[ROW][C]-82.4844451366706[/C][/ROW]
[ROW][C]181.041429052819[/C][/ROW]
[ROW][C]-41.1525491152924[/C][/ROW]
[ROW][C]-4.58915913862132[/C][/ROW]
[ROW][C]-70.8878056344728[/C][/ROW]
[ROW][C]30.6331177058615[/C][/ROW]
[ROW][C]31.8093505893012[/C][/ROW]
[ROW][C]37.1182085318387[/C][/ROW]
[ROW][C]-13.3685278921308[/C][/ROW]
[ROW][C]33.056999320586[/C][/ROW]
[ROW][C]-61.3577357264144[/C][/ROW]
[ROW][C]79.9195429997263[/C][/ROW]
[ROW][C]11.7596221418898[/C][/ROW]
[ROW][C]-91.3623724302746[/C][/ROW]
[ROW][C]203.337596520498[/C][/ROW]
[ROW][C]-557.496957604864[/C][/ROW]
[ROW][C]292.371347417766[/C][/ROW]
[ROW][C]74.7806380747335[/C][/ROW]
[ROW][C]-120.9629664289[/C][/ROW]
[ROW][C]313.688801701814[/C][/ROW]
[ROW][C]-45.0130242774151[/C][/ROW]
[ROW][C]38.3741392008107[/C][/ROW]
[ROW][C]19.4334712065887[/C][/ROW]
[ROW][C]118.991329345278[/C][/ROW]
[ROW][C]96.3080721267973[/C][/ROW]
[ROW][C]86.274628740497[/C][/ROW]
[ROW][C]178.706643033786[/C][/ROW]
[ROW][C]201.636999305955[/C][/ROW]
[ROW][C]-1706.70537468536[/C][/ROW]
[ROW][C]190.377609507551[/C][/ROW]
[ROW][C]337.660274018659[/C][/ROW]
[ROW][C]142.306876498347[/C][/ROW]
[ROW][C]249.226822919117[/C][/ROW]
[ROW][C]460.962453010427[/C][/ROW]
[ROW][C]338.759764193574[/C][/ROW]
[ROW][C]246.621917457127[/C][/ROW]
[ROW][C]246.119716114814[/C][/ROW]
[ROW][C]73.6183598269168[/C][/ROW]
[ROW][C]29.0366243931795[/C][/ROW]
[ROW][C]257.63679921348[/C][/ROW]
[ROW][C]615.634487237138[/C][/ROW]
[ROW][C]-2.88323391976631[/C][/ROW]
[ROW][C]-362.966075382351[/C][/ROW]
[ROW][C]-207.944535562103[/C][/ROW]
[ROW][C]27.3580900074642[/C][/ROW]
[ROW][C]-45.382427411953[/C][/ROW]
[ROW][C]118.900443130248[/C][/ROW]
[ROW][C]38.4598688981352[/C][/ROW]
[ROW][C]231.947588841583[/C][/ROW]
[ROW][C]184.556386402232[/C][/ROW]
[ROW][C]-10.267081514124[/C][/ROW]
[ROW][C]135.874260979032[/C][/ROW]
[ROW][C]287.871106029833[/C][/ROW]
[ROW][C]-289.652410108269[/C][/ROW]
[ROW][C]-337.170929945513[/C][/ROW]
[ROW][C]-378.671003172893[/C][/ROW]
[ROW][C]61.2772187240411[/C][/ROW]
[ROW][C]-227.778600442956[/C][/ROW]
[ROW][C]-18.7919319711304[/C][/ROW]
[ROW][C]-258.655469731631[/C][/ROW]
[ROW][C]126.330777077876[/C][/ROW]
[ROW][C]-70.5912423518573[/C][/ROW]
[ROW][C]-5.98529762960351[/C][/ROW]
[ROW][C]-102.120996979559[/C][/ROW]
[ROW][C]42.6405922048416[/C][/ROW]
[ROW][C]-238.439544073932[/C][/ROW]
[ROW][C]-275.930854936204[/C][/ROW]
[ROW][C]96.9252100883854[/C][/ROW]
[ROW][C]37.7706864023297[/C][/ROW]
[ROW][C]4.70082798521051[/C][/ROW]
[ROW][C]-81.1252784554187[/C][/ROW]
[ROW][C]20.8182233072231[/C][/ROW]
[ROW][C]1.36484533044702[/C][/ROW]
[ROW][C]-28.1291726756262[/C][/ROW]
[ROW][C]35.2126086959282[/C][/ROW]
[ROW][C]132.370697233805[/C][/ROW]
[ROW][C]320.462664655093[/C][/ROW]
[ROW][C]-5.69847846488621[/C][/ROW]
[ROW][C]-291.319991403879[/C][/ROW]
[ROW][C]157.001749557219[/C][/ROW]
[ROW][C]23.2532248927309[/C][/ROW]
[ROW][C]-40.6413504291676[/C][/ROW]
[ROW][C]124.199497938953[/C][/ROW]
[ROW][C]67.5580280287141[/C][/ROW]
[ROW][C]77.3908574087069[/C][/ROW]
[ROW][C]184.482431590501[/C][/ROW]
[ROW][C]121.689070305394[/C][/ROW]
[ROW][C]49.6209580035767[/C][/ROW]
[ROW][C]262.728636645932[/C][/ROW]
[ROW][C]130.476400117905[/C][/ROW]
[ROW][C]-378.625615809932[/C][/ROW]
[ROW][C]-41.6271658359722[/C][/ROW]
[ROW][C]-32.8708115195715[/C][/ROW]
[ROW][C]33.9744282704355[/C][/ROW]
[ROW][C]145.287359669221[/C][/ROW]
[ROW][C]-51.0525945716818[/C][/ROW]
[ROW][C]398.989543258086[/C][/ROW]
[ROW][C]130.2502197049[/C][/ROW]
[ROW][C]90.1653116557591[/C][/ROW]
[ROW][C]4.40145828869878[/C][/ROW]
[ROW][C]325.14210193622[/C][/ROW]
[ROW][C]-224.468663638034[/C][/ROW]
[/TABLE]
Source: https://freestatistics.org/blog/index.php?pk=301315&T=2

Globally Unique Identifier (entire table): ba.freestatistics.org/blog/index.php?pk=301315&T=2

As an alternative you can also use a QR Code:  

The GUIDs for individual cells are displayed in the table below:

Estimated ARIMA Residuals
Value
-13.8122531054313
-71.3380123652028
-85.6266863174045
-117.109447688377
-105.252206146099
42.7248214364215
-100.019533583678
177.832118758698
-120.164468425617
-112.712045379989
-106.412929266582
96.1745459847655
-82.4844451366706
181.041429052819
-41.1525491152924
-4.58915913862132
-70.8878056344728
30.6331177058615
31.8093505893012
37.1182085318387
-13.3685278921308
33.056999320586
-61.3577357264144
79.9195429997263
11.7596221418898
-91.3623724302746
203.337596520498
-557.496957604864
292.371347417766
74.7806380747335
-120.9629664289
313.688801701814
-45.0130242774151
38.3741392008107
19.4334712065887
118.991329345278
96.3080721267973
86.274628740497
178.706643033786
201.636999305955
-1706.70537468536
190.377609507551
337.660274018659
142.306876498347
249.226822919117
460.962453010427
338.759764193574
246.621917457127
246.119716114814
73.6183598269168
29.0366243931795
257.63679921348
615.634487237138
-2.88323391976631
-362.966075382351
-207.944535562103
27.3580900074642
-45.382427411953
118.900443130248
38.4598688981352
231.947588841583
184.556386402232
-10.267081514124
135.874260979032
287.871106029833
-289.652410108269
-337.170929945513
-378.671003172893
61.2772187240411
-227.778600442956
-18.7919319711304
-258.655469731631
126.330777077876
-70.5912423518573
-5.98529762960351
-102.120996979559
42.6405922048416
-238.439544073932
-275.930854936204
96.9252100883854
37.7706864023297
4.70082798521051
-81.1252784554187
20.8182233072231
1.36484533044702
-28.1291726756262
35.2126086959282
132.370697233805
320.462664655093
-5.69847846488621
-291.319991403879
157.001749557219
23.2532248927309
-40.6413504291676
124.199497938953
67.5580280287141
77.3908574087069
184.482431590501
121.689070305394
49.6209580035767
262.728636645932
130.476400117905
-378.625615809932
-41.6271658359722
-32.8708115195715
33.9744282704355
145.287359669221
-51.0525945716818
398.989543258086
130.2502197049
90.1653116557591
4.40145828869878
325.14210193622
-224.468663638034


Parameters (Session):
par1 = 12 ; par2 = Single ; par3 = additive ; par4 = 18 ;
Parameters (R input):
par1 = FALSE ; par2 = 1 ; par3 = 1 ; par4 = 1 ; par5 = 12 ; par6 = 3 ; par7 = 1 ; par8 = 2 ; par9 = 1 ;
R code (references can be found in the software module):
par9 <- '1'
par8 <- '2'
par7 <- '1'
par6 <- '3'
par5 <- '12'
par4 <- '1'
par3 <- '1'
par2 <- '-1.1'
par1 <- 'FALSE'
library(lattice)
if (par1 == 'TRUE') par1 <- TRUE
if (par1 == 'FALSE') par1 <- FALSE
par2 <- as.numeric(par2) #Box-Cox lambda transformation parameter
par3 <- as.numeric(par3) #degree of non-seasonal differencing
par4 <- as.numeric(par4) #degree of seasonal differencing
par5 <- as.numeric(par5) #seasonal period
par6 <- as.numeric(par6) #degree (p) of the non-seasonal AR(p) polynomial
par7 <- as.numeric(par7) #degree (q) of the non-seasonal MA(q) polynomial
par8 <- as.numeric(par8) #degree (P) of the seasonal AR(P) polynomial
par9 <- as.numeric(par9) #degree (Q) of the seasonal MA(Q) polynomial
armaGR <- function(arima.out, names, n){
try1 <- arima.out$coef
try2 <- sqrt(diag(arima.out$var.coef))
try.data.frame <- data.frame(matrix(NA,ncol=4,nrow=length(names)))
dimnames(try.data.frame) <- list(names,c('coef','std','tstat','pv'))
try.data.frame[,1] <- try1
for(i in 1:length(try2)) try.data.frame[which(rownames(try.data.frame)==names(try2)[i]),2] <- try2[i]
try.data.frame[,3] <- try.data.frame[,1] / try.data.frame[,2]
try.data.frame[,4] <- round((1-pt(abs(try.data.frame[,3]),df=n-(length(try2)+1)))*2,5)
vector <- rep(NA,length(names))
vector[is.na(try.data.frame[,4])] <- 0
maxi <- which.max(try.data.frame[,4])
continue <- max(try.data.frame[,4],na.rm=TRUE) > .05
vector[maxi] <- 0
list(summary=try.data.frame,next.vector=vector,continue=continue)
}
arimaSelect <- function(series, order=c(13,0,0), seasonal=list(order=c(2,0,0),period=12), include.mean=F){
nrc <- order[1]+order[3]+seasonal$order[1]+seasonal$order[3]
coeff <- matrix(NA, nrow=nrc*2, ncol=nrc)
pval <- matrix(NA, nrow=nrc*2, ncol=nrc)
mylist <- rep(list(NULL), nrc)
names <- NULL
if(order[1] > 0) names <- paste('ar',1:order[1],sep='')
if(order[3] > 0) names <- c( names , paste('ma',1:order[3],sep='') )
if(seasonal$order[1] > 0) names <- c(names, paste('sar',1:seasonal$order[1],sep=''))
if(seasonal$order[3] > 0) names <- c(names, paste('sma',1:seasonal$order[3],sep=''))
arima.out <- arima(series, order=order, seasonal=seasonal, include.mean=include.mean, method='ML')
mylist[[1]] <- arima.out
last.arma <- armaGR(arima.out, names, length(series))
mystop <- FALSE
i <- 1
coeff[i,] <- last.arma[[1]][,1]
pval [i,] <- last.arma[[1]][,4]
i <- 2
aic <- arima.out$aic
while(!mystop){
mylist[[i]] <- arima.out
arima.out <- arima(series, order=order, seasonal=seasonal, include.mean=include.mean, method='ML', fixed=last.arma$next.vector)
aic <- c(aic, arima.out$aic)
last.arma <- armaGR(arima.out, names, length(series))
mystop <- !last.arma$continue
coeff[i,] <- last.arma[[1]][,1]
pval [i,] <- last.arma[[1]][,4]
i <- i+1
}
list(coeff, pval, mylist, aic=aic)
}
arimaSelectplot <- function(arimaSelect.out,noms,choix){
noms <- names(arimaSelect.out[[3]][[1]]$coef)
coeff <- arimaSelect.out[[1]]
k <- min(which(is.na(coeff[,1])))-1
coeff <- coeff[1:k,]
pval <- arimaSelect.out[[2]][1:k,]
aic <- arimaSelect.out$aic[1:k]
coeff[coeff==0] <- NA
n <- ncol(coeff)
if(missing(choix)) choix <- k
layout(matrix(c(1,1,1,2,
3,3,3,2,
3,3,3,4,
5,6,7,7),nr=4),
widths=c(10,35,45,15),
heights=c(30,30,15,15))
couleurs <- rainbow(75)[1:50]#(50)
ticks <- pretty(coeff)
par(mar=c(1,1,3,1))
plot(aic,k:1-.5,type='o',pch=21,bg='blue',cex=2,axes=F,lty=2,xpd=NA)
points(aic[choix],k-choix+.5,pch=21,cex=4,bg=2,xpd=NA)
title('aic',line=2)
par(mar=c(3,0,0,0))
plot(0,axes=F,xlab='',ylab='',xlim=range(ticks),ylim=c(.1,1))
rect(xleft = min(ticks) + (0:49)/50*(max(ticks)-min(ticks)),
xright = min(ticks) + (1:50)/50*(max(ticks)-min(ticks)),
ytop = rep(1,50),
ybottom= rep(0,50),col=couleurs,border=NA)
axis(1,ticks)
rect(xleft=min(ticks),xright=max(ticks),ytop=1,ybottom=0)
text(mean(coeff,na.rm=T),.5,'coefficients',cex=2,font=2)
par(mar=c(1,1,3,1))
image(1:n,1:k,t(coeff[k:1,]),axes=F,col=couleurs,zlim=range(ticks))
for(i in 1:n) for(j in 1:k) if(!is.na(coeff[j,i])) {
if(pval[j,i]<.01) symb = 'green'
else if( (pval[j,i]<.05) & (pval[j,i]>=.01)) symb = 'orange'
else if( (pval[j,i]<.1) & (pval[j,i]>=.05)) symb = 'red'
else symb = 'black'
polygon(c(i+.5 ,i+.2 ,i+.5 ,i+.5),
c(k-j+0.5,k-j+0.5,k-j+0.8,k-j+0.5),
col=symb)
if(j==choix) {
rect(xleft=i-.5,
xright=i+.5,
ybottom=k-j+1.5,
ytop=k-j+.5,
lwd=4)
text(i,
k-j+1,
round(coeff[j,i],2),
cex=1.2,
font=2)
}
else{
rect(xleft=i-.5,xright=i+.5,ybottom=k-j+1.5,ytop=k-j+.5)
text(i,k-j+1,round(coeff[j,i],2),cex=1.2,font=1)
}
}
axis(3,1:n,noms)
par(mar=c(0.5,0,0,0.5))
plot(0,axes=F,xlab='',ylab='',type='n',xlim=c(0,8),ylim=c(-.2,.8))
cols <- c('green','orange','red','black')
niv <- c('0','0.01','0.05','0.1')
for(i in 0:3){
polygon(c(1+2*i ,1+2*i ,1+2*i-.5 ,1+2*i),
c(.4 ,.7 , .4 , .4),
col=cols[i+1])
text(2*i,0.5,niv[i+1],cex=1.5)
}
text(8,.5,1,cex=1.5)
text(4,0,'p-value',cex=2)
box()
residus <- arimaSelect.out[[3]][[choix]]$res
par(mar=c(1,2,4,1))
acf(residus,main='')
title('acf',line=.5)
par(mar=c(1,2,4,1))
pacf(residus,main='')
title('pacf',line=.5)
par(mar=c(2,2,4,1))
qqnorm(residus,main='')
title('qq-norm',line=.5)
qqline(residus)
residus
}
if (par2 == 0) x <- log(x)
if (par2 != 0) x <- x^par2
(selection <- arimaSelect(x, order=c(par6,par3,par7), seasonal=list(order=c(par8,par4,par9), period=par5)))
bitmap(file='test1.png')
resid <- arimaSelectplot(selection)
dev.off()
resid
bitmap(file='test2.png')
acf(resid,length(resid)/2, main='Residual Autocorrelation Function')
dev.off()
bitmap(file='test3.png')
pacf(resid,length(resid)/2, main='Residual Partial Autocorrelation Function')
dev.off()
bitmap(file='test4.png')
cpgram(resid, main='Residual Cumulative Periodogram')
dev.off()
bitmap(file='test5.png')
hist(resid, main='Residual Histogram', xlab='values of Residuals')
dev.off()
bitmap(file='test6.png')
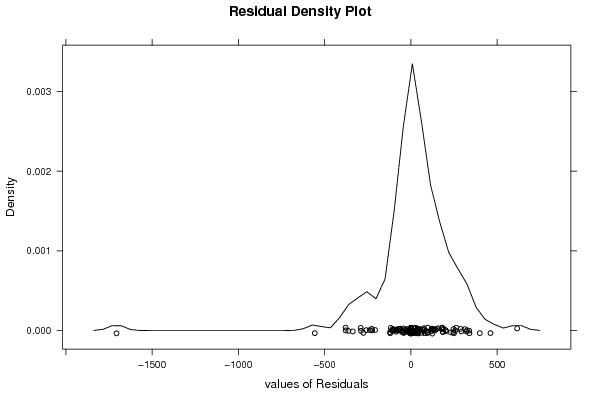
densityplot(~resid,col='black',main='Residual Density Plot', xlab='values of Residuals')
dev.off()
bitmap(file='test7.png')
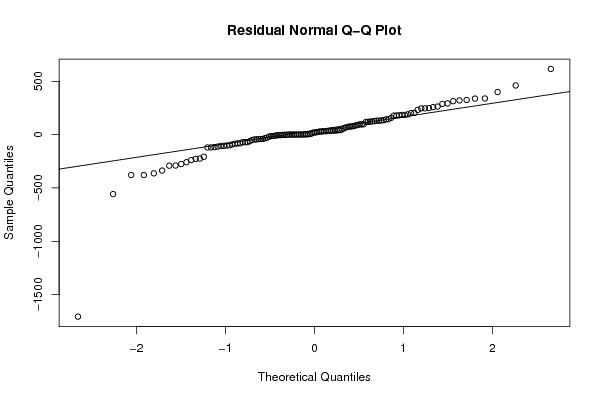
qqnorm(resid, main='Residual Normal Q-Q Plot')
qqline(resid)
dev.off()
ncols <- length(selection[[1]][1,])
nrows <- length(selection[[2]][,1])-1
load(file='createtable')
a<-table.start()
a<-table.row.start(a)
a<-table.element(a,'ARIMA Parameter Estimation and Backward Selection', ncols+1,TRUE)
a<-table.row.end(a)
a<-table.row.start(a)
a<-table.element(a,'Iteration', header=TRUE)
for (i in 1:ncols) {
a<-table.element(a,names(selection[[3]][[1]]$coef)[i],header=TRUE)
}
a<-table.row.end(a)
for (j in 1:nrows) {
a<-table.row.start(a)
mydum <- 'Estimates ('
mydum <- paste(mydum,j)
mydum <- paste(mydum,')')
a<-table.element(a,mydum, header=TRUE)
for (i in 1:ncols) {
a<-table.element(a,round(selection[[1]][j,i],4))
}
a<-table.row.end(a)
a<-table.row.start(a)
a<-table.element(a,'(p-val)', header=TRUE)
for (i in 1:ncols) {
mydum <- '('
mydum <- paste(mydum,round(selection[[2]][j,i],4),sep='')
mydum <- paste(mydum,')')
a<-table.element(a,mydum)
}
a<-table.row.end(a)
}
a<-table.end(a)
table.save(a,file='mytable.tab')
a<-table.start()
a<-table.row.start(a)
a<-table.element(a,'Estimated ARIMA Residuals', 1,TRUE)
a<-table.row.end(a)
a<-table.row.start(a)
a<-table.element(a,'Value', 1,TRUE)
a<-table.row.end(a)
for (i in (par4*par5+par3):length(resid)) {
a<-table.row.start(a)
a<-table.element(a,resid[i])
a<-table.row.end(a)
}
a<-table.end(a)
table.save(a,file='mytable1.tab')