Free Statistics

of Irreproducible Research!

Author's title

Author*The author of this computation has been verified*
R Software Modulerwasp_structuraltimeseries.wasp
Title produced by softwareStructural Time Series Models
Date of computationWed, 14 Dec 2016 19:29:05 +0100
Cite this page as followsStatistical Computations at FreeStatistics.org, Office for Research Development and Education, URL https://freestatistics.org/blog/index.php?v=date/2016/Dec/14/t14817401699chktxv15ysz9cl.htm/, Retrieved Fri, 17 May 2024 14:17:09 +0000
Statistical Computations at FreeStatistics.org, Office for Research Development and Education, URL https://freestatistics.org/blog/index.php?pk=299683, Retrieved Fri, 17 May 2024 14:17:09 +0000
QR Codes:

Original text written by user:
IsPrivate?No (this computation is public)
User-defined keywords
Estimated Impact65
Family? (F = Feedback message, R = changed R code, M = changed R Module, P = changed Parameters, D = changed Data)
-       [Structural Time Series Models] [] [2016-12-14 18:29:05] [130d73899007e5ff8a4f636b9bcfb397] [Current]
Feedback Forum

Post a new message
Dataseries X:
1623.25
2140.55
2451.15
2964.45
3619.1
3764.25
4156
3374.55
4268.55
5290.7
5635.2
5845.9
7286.05
7686.95


Summary of computational transaction
Raw Input view raw input (R code)
Raw Outputview raw output of R engine
Computing time4 seconds
R ServerBig Analytics Cloud Computing Center

\begin{tabular}{lllllllll}
\hline
Summary of computational transaction \tabularnewline
Raw Input view raw input (R code)  \tabularnewline
Raw Outputview raw output of R engine  \tabularnewline
Computing time4 seconds \tabularnewline
R ServerBig Analytics Cloud Computing Center \tabularnewline
\hline
\end{tabular}
%Source: https://freestatistics.org/blog/index.php?pk=299683&T=0

[TABLE]
[ROW]
Summary of computational transaction[/C][/ROW] [ROW]Raw Input[/C] view raw input (R code) [/C][/ROW] [ROW]Raw Output[/C]view raw output of R engine [/C][/ROW] [ROW]Computing time[/C]4 seconds[/C][/ROW] [ROW]R Server[/C]Big Analytics Cloud Computing Center[/C][/ROW] [/TABLE] Source: https://freestatistics.org/blog/index.php?pk=299683&T=0

Globally Unique Identifier (entire table): ba.freestatistics.org/blog/index.php?pk=299683&T=0

As an alternative you can also use a QR Code:  

The GUIDs for individual cells are displayed in the table below:

Summary of computational transaction
Raw Input view raw input (R code)
Raw Outputview raw output of R engine
Computing time4 seconds
R ServerBig Analytics Cloud Computing Center


Structural Time Series Model -- Interpolation
tObservedLevelSlopeSeasonalStand. Residuals
11623.251623.25000
22140.552018.8862023253165.784394155670723.43111932195980.815691454090101
32451.152339.40460561039144.71927181870626.97918668427920.61704336035431
42964.452835.01020654475273.24996242840226.69907269328740.780932193577983
53619.13488.87909890065418.07416510626225.34469276605530.815362985562222
63764.253774.44293373304367.23161918431425.7483354958849-0.281215985016146
741564132.66997695304363.76900896171525.7664559236616-0.0190893821904191
83374.553592.393589661215.808383049388326.8350160265682-1.91747821722736
94268.554106.97913475158207.88228104585126.51251679550311.0584373753821
105290.75062.05124835569495.70218461427526.26117856136361.58608444082992
115635.25598.03329189928511.2206406939526.25440155745980.0855180837707711
125845.95881.36929340949423.41696689139226.2729489644545-0.483864106879555
137286.057015.15938902169683.99624297962487.77379200507891.74517171429364
147686.957695.6701478196682.744380869548-8.06909488523088-0.00600218944217966

\begin{tabular}{lllllllll}
\hline
Structural Time Series Model -- Interpolation \tabularnewline
t & Observed & Level & Slope & Seasonal & Stand. Residuals \tabularnewline
1 & 1623.25 & 1623.25 & 0 & 0 & 0 \tabularnewline
2 & 2140.55 & 2018.88620232531 & 65.7843941556707 & 23.4311193219598 & 0.815691454090101 \tabularnewline
3 & 2451.15 & 2339.40460561039 & 144.719271818706 & 26.9791866842792 & 0.61704336035431 \tabularnewline
4 & 2964.45 & 2835.01020654475 & 273.249962428402 & 26.6990726932874 & 0.780932193577983 \tabularnewline
5 & 3619.1 & 3488.87909890065 & 418.074165106262 & 25.3446927660553 & 0.815362985562222 \tabularnewline
6 & 3764.25 & 3774.44293373304 & 367.231619184314 & 25.7483354958849 & -0.281215985016146 \tabularnewline
7 & 4156 & 4132.66997695304 & 363.769008961715 & 25.7664559236616 & -0.0190893821904191 \tabularnewline
8 & 3374.55 & 3592.3935896612 & 15.8083830493883 & 26.8350160265682 & -1.91747821722736 \tabularnewline
9 & 4268.55 & 4106.97913475158 & 207.882281045851 & 26.5125167955031 & 1.0584373753821 \tabularnewline
10 & 5290.7 & 5062.05124835569 & 495.702184614275 & 26.2611785613636 & 1.58608444082992 \tabularnewline
11 & 5635.2 & 5598.03329189928 & 511.22064069395 & 26.2544015574598 & 0.0855180837707711 \tabularnewline
12 & 5845.9 & 5881.36929340949 & 423.416966891392 & 26.2729489644545 & -0.483864106879555 \tabularnewline
13 & 7286.05 & 7015.15938902169 & 683.996242979624 & 87.7737920050789 & 1.74517171429364 \tabularnewline
14 & 7686.95 & 7695.6701478196 & 682.744380869548 & -8.06909488523088 & -0.00600218944217966 \tabularnewline
\hline
\end{tabular}
%Source: https://freestatistics.org/blog/index.php?pk=299683&T=1

[TABLE]
[ROW][C]Structural Time Series Model -- Interpolation[/C][/ROW]
[ROW][C]t[/C][C]Observed[/C][C]Level[/C][C]Slope[/C][C]Seasonal[/C][C]Stand. Residuals[/C][/ROW]
[ROW][C]1[/C][C]1623.25[/C][C]1623.25[/C][C]0[/C][C]0[/C][C]0[/C][/ROW]
[ROW][C]2[/C][C]2140.55[/C][C]2018.88620232531[/C][C]65.7843941556707[/C][C]23.4311193219598[/C][C]0.815691454090101[/C][/ROW]
[ROW][C]3[/C][C]2451.15[/C][C]2339.40460561039[/C][C]144.719271818706[/C][C]26.9791866842792[/C][C]0.61704336035431[/C][/ROW]
[ROW][C]4[/C][C]2964.45[/C][C]2835.01020654475[/C][C]273.249962428402[/C][C]26.6990726932874[/C][C]0.780932193577983[/C][/ROW]
[ROW][C]5[/C][C]3619.1[/C][C]3488.87909890065[/C][C]418.074165106262[/C][C]25.3446927660553[/C][C]0.815362985562222[/C][/ROW]
[ROW][C]6[/C][C]3764.25[/C][C]3774.44293373304[/C][C]367.231619184314[/C][C]25.7483354958849[/C][C]-0.281215985016146[/C][/ROW]
[ROW][C]7[/C][C]4156[/C][C]4132.66997695304[/C][C]363.769008961715[/C][C]25.7664559236616[/C][C]-0.0190893821904191[/C][/ROW]
[ROW][C]8[/C][C]3374.55[/C][C]3592.3935896612[/C][C]15.8083830493883[/C][C]26.8350160265682[/C][C]-1.91747821722736[/C][/ROW]
[ROW][C]9[/C][C]4268.55[/C][C]4106.97913475158[/C][C]207.882281045851[/C][C]26.5125167955031[/C][C]1.0584373753821[/C][/ROW]
[ROW][C]10[/C][C]5290.7[/C][C]5062.05124835569[/C][C]495.702184614275[/C][C]26.2611785613636[/C][C]1.58608444082992[/C][/ROW]
[ROW][C]11[/C][C]5635.2[/C][C]5598.03329189928[/C][C]511.22064069395[/C][C]26.2544015574598[/C][C]0.0855180837707711[/C][/ROW]
[ROW][C]12[/C][C]5845.9[/C][C]5881.36929340949[/C][C]423.416966891392[/C][C]26.2729489644545[/C][C]-0.483864106879555[/C][/ROW]
[ROW][C]13[/C][C]7286.05[/C][C]7015.15938902169[/C][C]683.996242979624[/C][C]87.7737920050789[/C][C]1.74517171429364[/C][/ROW]
[ROW][C]14[/C][C]7686.95[/C][C]7695.6701478196[/C][C]682.744380869548[/C][C]-8.06909488523088[/C][C]-0.00600218944217966[/C][/ROW]
[/TABLE]
Source: https://freestatistics.org/blog/index.php?pk=299683&T=1

Globally Unique Identifier (entire table): ba.freestatistics.org/blog/index.php?pk=299683&T=1

As an alternative you can also use a QR Code:  

The GUIDs for individual cells are displayed in the table below:

Structural Time Series Model -- Interpolation
tObservedLevelSlopeSeasonalStand. Residuals
11623.251623.25000
22140.552018.8862023253165.784394155670723.43111932195980.815691454090101
32451.152339.40460561039144.71927181870626.97918668427920.61704336035431
42964.452835.01020654475273.24996242840226.69907269328740.780932193577983
53619.13488.87909890065418.07416510626225.34469276605530.815362985562222
63764.253774.44293373304367.23161918431425.7483354958849-0.281215985016146
741564132.66997695304363.76900896171525.7664559236616-0.0190893821904191
83374.553592.393589661215.808383049388326.8350160265682-1.91747821722736
94268.554106.97913475158207.88228104585126.51251679550311.0584373753821
105290.75062.05124835569495.70218461427526.26117856136361.58608444082992
115635.25598.03329189928511.2206406939526.25440155745980.0855180837707711
125845.95881.36929340949423.41696689139226.2729489644545-0.483864106879555
137286.057015.15938902169683.99624297962487.77379200507891.74517171429364
147686.957695.6701478196682.744380869548-8.06909488523088-0.00600218944217966


Structural Time Series Model -- Extrapolation
tObservedLevelSeasonal
18006.44028300147672.84440026548333.595882735921
28494.105646925978124.51271302584369.592933900132
39125.685669939388576.1810257862549.50464415318
49250.334516053529027.84933854656222.485177506966
59624.145925263429479.51765130691144.628273956509
68827.327847406089931.18596406727-1103.85811666119
79708.5086042708810382.8542768276-674.345672556754
810720.398871738310834.522589588-114.123717849674
911057.20548129711286.1909023484-228.98542105137
1011262.775461021311737.8592151087-475.083754087365
1112681.798743141312189.5275278691492.271215272187
1213125.514395310912641.1958406294484.31855468146

\begin{tabular}{lllllllll}
\hline
Structural Time Series Model -- Extrapolation \tabularnewline
t & Observed & Level & Seasonal \tabularnewline
1 & 8006.4402830014 & 7672.84440026548 & 333.595882735921 \tabularnewline
2 & 8494.10564692597 & 8124.51271302584 & 369.592933900132 \tabularnewline
3 & 9125.68566993938 & 8576.1810257862 & 549.50464415318 \tabularnewline
4 & 9250.33451605352 & 9027.84933854656 & 222.485177506966 \tabularnewline
5 & 9624.14592526342 & 9479.51765130691 & 144.628273956509 \tabularnewline
6 & 8827.32784740608 & 9931.18596406727 & -1103.85811666119 \tabularnewline
7 & 9708.50860427088 & 10382.8542768276 & -674.345672556754 \tabularnewline
8 & 10720.3988717383 & 10834.522589588 & -114.123717849674 \tabularnewline
9 & 11057.205481297 & 11286.1909023484 & -228.98542105137 \tabularnewline
10 & 11262.7754610213 & 11737.8592151087 & -475.083754087365 \tabularnewline
11 & 12681.7987431413 & 12189.5275278691 & 492.271215272187 \tabularnewline
12 & 13125.5143953109 & 12641.1958406294 & 484.31855468146 \tabularnewline
\hline
\end{tabular}
%Source: https://freestatistics.org/blog/index.php?pk=299683&T=2

[TABLE]
[ROW][C]Structural Time Series Model -- Extrapolation[/C][/ROW]
[ROW][C]t[/C][C]Observed[/C][C]Level[/C][C]Seasonal[/C][/ROW]
[ROW][C]1[/C][C]8006.4402830014[/C][C]7672.84440026548[/C][C]333.595882735921[/C][/ROW]
[ROW][C]2[/C][C]8494.10564692597[/C][C]8124.51271302584[/C][C]369.592933900132[/C][/ROW]
[ROW][C]3[/C][C]9125.68566993938[/C][C]8576.1810257862[/C][C]549.50464415318[/C][/ROW]
[ROW][C]4[/C][C]9250.33451605352[/C][C]9027.84933854656[/C][C]222.485177506966[/C][/ROW]
[ROW][C]5[/C][C]9624.14592526342[/C][C]9479.51765130691[/C][C]144.628273956509[/C][/ROW]
[ROW][C]6[/C][C]8827.32784740608[/C][C]9931.18596406727[/C][C]-1103.85811666119[/C][/ROW]
[ROW][C]7[/C][C]9708.50860427088[/C][C]10382.8542768276[/C][C]-674.345672556754[/C][/ROW]
[ROW][C]8[/C][C]10720.3988717383[/C][C]10834.522589588[/C][C]-114.123717849674[/C][/ROW]
[ROW][C]9[/C][C]11057.205481297[/C][C]11286.1909023484[/C][C]-228.98542105137[/C][/ROW]
[ROW][C]10[/C][C]11262.7754610213[/C][C]11737.8592151087[/C][C]-475.083754087365[/C][/ROW]
[ROW][C]11[/C][C]12681.7987431413[/C][C]12189.5275278691[/C][C]492.271215272187[/C][/ROW]
[ROW][C]12[/C][C]13125.5143953109[/C][C]12641.1958406294[/C][C]484.31855468146[/C][/ROW]
[/TABLE]
Source: https://freestatistics.org/blog/index.php?pk=299683&T=2

Globally Unique Identifier (entire table): ba.freestatistics.org/blog/index.php?pk=299683&T=2

As an alternative you can also use a QR Code:  

The GUIDs for individual cells are displayed in the table below:

Structural Time Series Model -- Extrapolation
tObservedLevelSeasonal
18006.44028300147672.84440026548333.595882735921
28494.105646925978124.51271302584369.592933900132
39125.685669939388576.1810257862549.50464415318
49250.334516053529027.84933854656222.485177506966
59624.145925263429479.51765130691144.628273956509
68827.327847406089931.18596406727-1103.85811666119
79708.5086042708810382.8542768276-674.345672556754
810720.398871738310834.522589588-114.123717849674
911057.20548129711286.1909023484-228.98542105137
1011262.775461021311737.8592151087-475.083754087365
1112681.798743141312189.5275278691492.271215272187
1213125.514395310912641.1958406294484.31855468146


Parameters (Session):
par1 = 12 ; par2 = 12 ; par3 = BFGS ;
Parameters (R input):
par1 = 12 ; par2 = 12 ; par3 = BFGS ;
R code (references can be found in the software module):
require('stsm')
require('stsm.class')
require('KFKSDS')
par1 <- as.numeric(par1)
par2 <- as.numeric(par2)
nx <- length(x)
x <- ts(x,frequency=par1)
m <- StructTS(x,type='BSM')
print(m$coef)
print(m$fitted)
print(m$resid)
mylevel <- as.numeric(m$fitted[,'level'])
myslope <- as.numeric(m$fitted[,'slope'])
myseas <- as.numeric(m$fitted[,'sea'])
myresid <- as.numeric(m$resid)
myfit <- mylevel+myseas
mm <- stsm.model(model = 'BSM', y = x, transPars = 'StructTS')
fit2 <- stsmFit(mm, stsm.method = 'maxlik.td.optim', method = par3, KF.args = list(P0cov = TRUE))
(fit2.comps <- tsSmooth(fit2, P0cov = FALSE)$states)
m2 <- set.pars(mm, pmax(fit2$par, .Machine$double.eps))
(ss <- char2numeric(m2))
(pred <- predict(ss, x, n.ahead = par2))
mylagmax <- nx/2
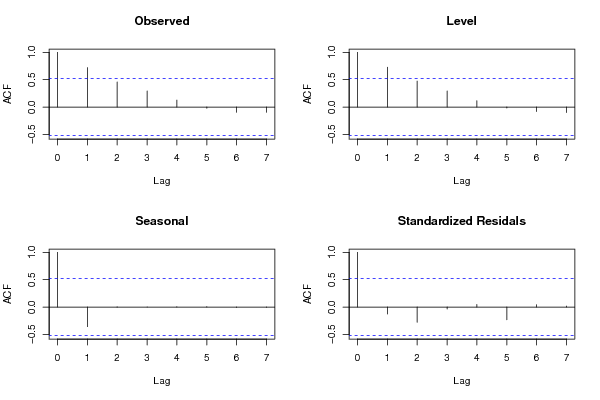
bitmap(file='test2.png')
op <- par(mfrow = c(2,2))
acf(as.numeric(x),lag.max = mylagmax,main='Observed')
acf(mylevel,na.action=na.pass,lag.max = mylagmax,main='Level')
acf(myseas,na.action=na.pass,lag.max = mylagmax,main='Seasonal')
acf(myresid,na.action=na.pass,lag.max = mylagmax,main='Standardized Residals')
par(op)
dev.off()
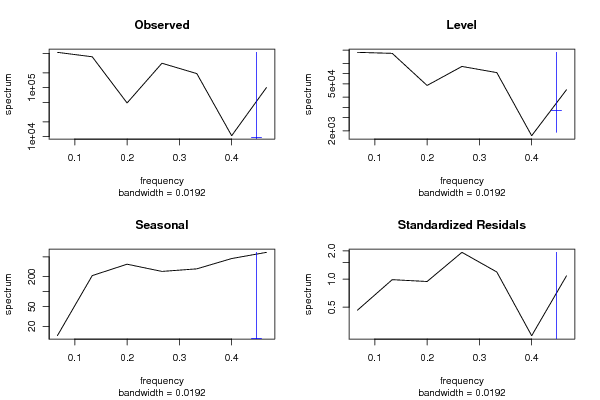
bitmap(file='test3.png')
op <- par(mfrow = c(2,2))
spectrum(as.numeric(x),main='Observed')
spectrum(mylevel,main='Level')
spectrum(myseas,main='Seasonal')
spectrum(myresid,main='Standardized Residals')
par(op)
dev.off()
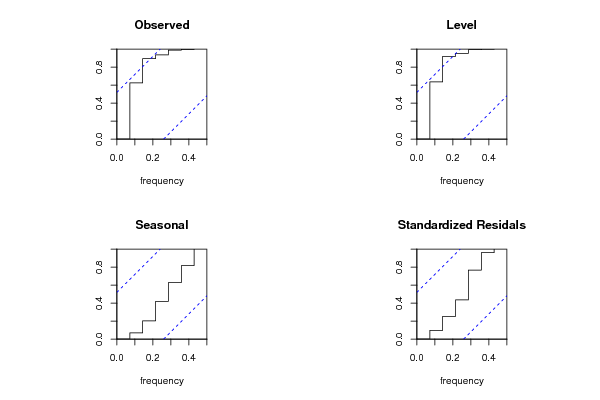
bitmap(file='test4.png')
op <- par(mfrow = c(2,2))
cpgram(as.numeric(x),main='Observed')
cpgram(mylevel,main='Level')
cpgram(myseas,main='Seasonal')
cpgram(myresid,main='Standardized Residals')
par(op)
dev.off()
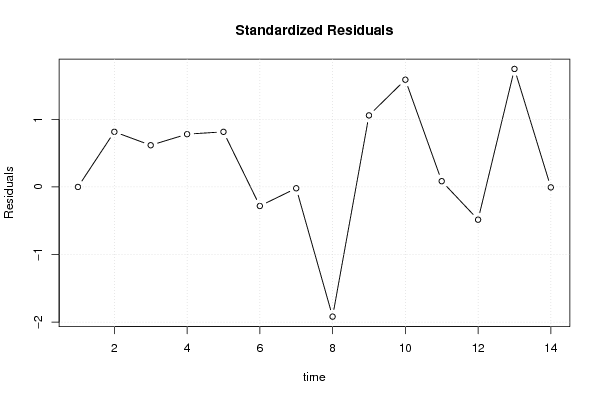
bitmap(file='test1.png')
plot(as.numeric(m$resid),main='Standardized Residuals',ylab='Residuals',xlab='time',type='b')
grid()
dev.off()
bitmap(file='test5.png')
op <- par(mfrow = c(2,2))
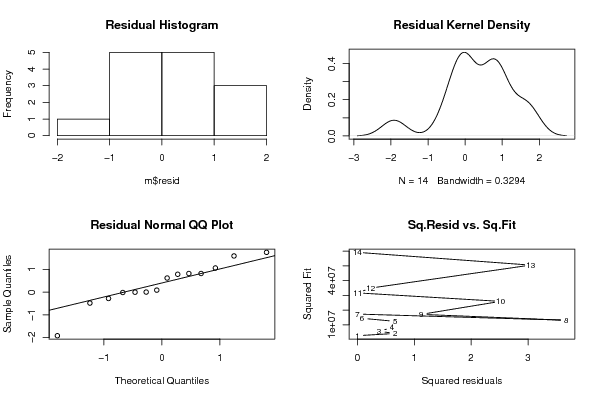
hist(m$resid,main='Residual Histogram')
plot(density(m$resid),main='Residual Kernel Density')
qqnorm(m$resid,main='Residual Normal QQ Plot')
qqline(m$resid)
plot(m$resid^2, myfit^2,main='Sq.Resid vs. Sq.Fit',xlab='Squared residuals',ylab='Squared Fit')
par(op)
dev.off()
bitmap(file='test6.png')
par(mfrow = c(3,1), mar = c(3,3,3,3))
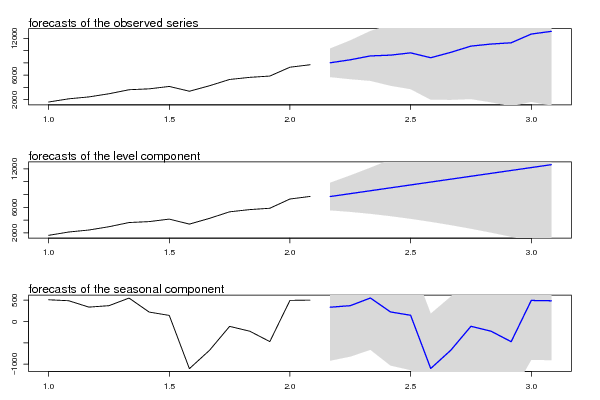
plot(cbind(x, pred$pred), type = 'n', plot.type = 'single', ylab = '')
lines(x)
polygon(c(time(pred$pred), rev(time(pred$pred))), c(pred$pred + 2 * pred$se, rev(pred$pred)), col = 'gray85', border = NA)
polygon(c(time(pred$pred), rev(time(pred$pred))), c(pred$pred - 2 * pred$se, rev(pred$pred)), col = ' gray85', border = NA)
lines(pred$pred, col = 'blue', lwd = 1.5)
mtext(text = 'forecasts of the observed series', side = 3, adj = 0)
plot(cbind(x, pred$a[,1]), type = 'n', plot.type = 'single', ylab = '')
lines(x)
polygon(c(time(pred$a[,1]), rev(time(pred$a[,1]))), c(pred$a[,1] + 2 * sqrt(pred$P[,1]), rev(pred$a[,1])), col = 'gray85', border = NA)
polygon(c(time(pred$a[,1]), rev(time(pred$a[,1]))), c(pred$a[,1] - 2 * sqrt(pred$P[,1]), rev(pred$a[,1])), col = ' gray85', border = NA)
lines(pred$a[,1], col = 'blue', lwd = 1.5)
mtext(text = 'forecasts of the level component', side = 3, adj = 0)
plot(cbind(fit2.comps[,3], pred$a[,3]), type = 'n', plot.type = 'single', ylab = '')
lines(fit2.comps[,3])
polygon(c(time(pred$a[,3]), rev(time(pred$a[,3]))), c(pred$a[,3] + 2 * sqrt(pred$P[,3]), rev(pred$a[,3])), col = 'gray85', border = NA)
polygon(c(time(pred$a[,3]), rev(time(pred$a[,3]))), c(pred$a[,3] - 2 * sqrt(pred$P[,3]), rev(pred$a[,3])), col = ' gray85', border = NA)
lines(pred$a[,3], col = 'blue', lwd = 1.5)
mtext(text = 'forecasts of the seasonal component', side = 3, adj = 0)
dev.off()
load(file='createtable')
a<-table.start()
a<-table.row.start(a)
a<-table.element(a,'Structural Time Series Model -- Interpolation',6,TRUE)
a<-table.row.end(a)
a<-table.row.start(a)
a<-table.element(a,'t',header=TRUE)
a<-table.element(a,'Observed',header=TRUE)
a<-table.element(a,'Level',header=TRUE)
a<-table.element(a,'Slope',header=TRUE)
a<-table.element(a,'Seasonal',header=TRUE)
a<-table.element(a,'Stand. Residuals',header=TRUE)
a<-table.row.end(a)
for (i in 1:nx) {
a<-table.row.start(a)
a<-table.element(a,i,header=TRUE)
a<-table.element(a,x[i])
a<-table.element(a,mylevel[i])
a<-table.element(a,myslope[i])
a<-table.element(a,myseas[i])
a<-table.element(a,myresid[i])
a<-table.row.end(a)
}
a<-table.end(a)
table.save(a,file='mytable.tab')
a<-table.start()
a<-table.row.start(a)
a<-table.element(a,'Structural Time Series Model -- Extrapolation',4,TRUE)
a<-table.row.end(a)
a<-table.row.start(a)
a<-table.element(a,'t',header=TRUE)
a<-table.element(a,'Observed',header=TRUE)
a<-table.element(a,'Level',header=TRUE)
a<-table.element(a,'Seasonal',header=TRUE)
a<-table.row.end(a)
for (i in 1:par2) {
a<-table.row.start(a)
a<-table.element(a,i,header=TRUE)
a<-table.element(a,pred$pred[i])
a<-table.element(a,pred$a[i,1])
a<-table.element(a,pred$a[i,3])
a<-table.row.end(a)
}
a<-table.end(a)
table.save(a,file='mytable1.tab')