Free Statistics

of Irreproducible Research!

Author's title

Author*The author of this computation has been verified*
R Software Modulerwasp_autocorrelation.wasp
Title produced by software(Partial) Autocorrelation Function
Date of computationFri, 09 Dec 2016 16:34:16 +0100
Cite this page as followsStatistical Computations at FreeStatistics.org, Office for Research Development and Education, URL https://freestatistics.org/blog/index.php?v=date/2016/Dec/09/t1481297701qa8op1gspcypm2c.htm/, Retrieved Fri, 17 May 2024 12:32:18 +0000
Statistical Computations at FreeStatistics.org, Office for Research Development and Education, URL https://freestatistics.org/blog/index.php?pk=298576, Retrieved Fri, 17 May 2024 12:32:18 +0000
QR Codes:

Original text written by user:
IsPrivate?No (this computation is public)
User-defined keywords
Estimated Impact77
Family? (F = Feedback message, R = changed R code, M = changed R Module, P = changed Parameters, D = changed Data)
-     [(Partial) Autocorrelation Function] [Autocorr eerste] [2016-12-07 13:39:31] [5f979cb1c6fa86b57093c7542788c28c]
- R  D    [(Partial) Autocorrelation Function] [lf,q] [2016-12-09 15:34:16] [4c05fa0998bf98e29c2e453b139976f4] [Current]
Feedback Forum

Post a new message
Dataseries X:
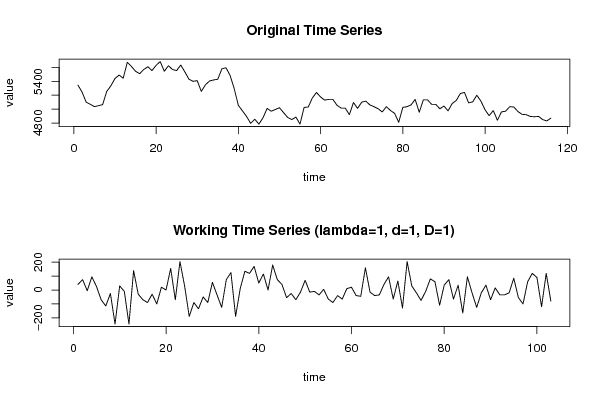
5345
5245
5100
5070
5035
5050
5065
5255
5335
5440
5490
5445
5675
5615
5545
5510
5570
5610
5555
5630
5685
5545
5625
5570
5555
5635
5535
5430
5400
5410
5255
5350
5405
5420
5430
5580
5595
5485
5295
5055
4975
4895
4795
4855
4785
4875
5010
4970
4995
5020
4950
4880
4850
4885
4785
5025
5030
5160
5240
5175
5130
5140
5140
5055
5015
5015
4920
5095
5010
5100
5115
5060
5035
5005
4960
5035
4980
4940
4810
5025
5035
5060
5140
4955
5135
5135
5070
5070
5005
5045
4975
5080
5125
5225
5240
5090
5105
5200
5115
4990
4905
4980
4840
4960
4970
5035
5030
4965
4925
4920
4895
4890
4895
4850
4830
4870


Summary of computational transaction
Raw Input view raw input (R code)
Raw Outputview raw output of R engine
Computing time1 seconds
R ServerBig Analytics Cloud Computing Center

\begin{tabular}{lllllllll}
\hline
Summary of computational transaction \tabularnewline
Raw Input view raw input (R code)  \tabularnewline
Raw Outputview raw output of R engine  \tabularnewline
Computing time1 seconds \tabularnewline
R ServerBig Analytics Cloud Computing Center \tabularnewline
\hline
\end{tabular}
%Source: https://freestatistics.org/blog/index.php?pk=298576&T=0

[TABLE]
[ROW]
Summary of computational transaction[/C][/ROW] [ROW]Raw Input[/C] view raw input (R code) [/C][/ROW] [ROW]Raw Output[/C]view raw output of R engine [/C][/ROW] [ROW]Computing time[/C]1 seconds[/C][/ROW] [ROW]R Server[/C]Big Analytics Cloud Computing Center[/C][/ROW] [/TABLE] Source: https://freestatistics.org/blog/index.php?pk=298576&T=0

Globally Unique Identifier (entire table): ba.freestatistics.org/blog/index.php?pk=298576&T=0

As an alternative you can also use a QR Code:  

The GUIDs for individual cells are displayed in the table below:

Summary of computational transaction
Raw Input view raw input (R code)
Raw Outputview raw output of R engine
Computing time1 seconds
R ServerBig Analytics Cloud Computing Center


Autocorrelation Function
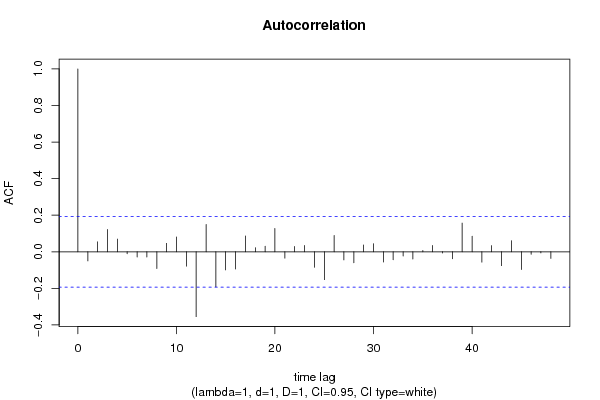
Time lag kACF(k)T-STATP-value
1-0.049852-0.50590.306988
20.0541510.54960.291901
30.1221821.240.108894
40.06930.70330.241724
5-0.010645-0.1080.457089
6-0.02865-0.29080.385909
7-0.028955-0.29390.384728
8-0.091077-0.92430.178736
90.0460780.46760.320513
100.081040.82250.206356
11-0.07838-0.79550.214086
12-0.354827-3.60110.000245
130.1488691.51090.066943
14-0.190874-1.93720.027733
15-0.099127-1.0060.15838
16-0.094539-0.95950.169786
170.0862920.87580.191598
180.0218510.22180.412469
190.030250.3070.379731
200.1274181.29320.099425
21-0.034747-0.35260.362537
220.0288080.29240.385296
230.0344160.34930.363796
24-0.085135-0.8640.19479
25-0.152245-1.54510.062693
260.0886630.89980.185155
27-0.04418-0.44840.327413
28-0.059616-0.6050.273243
290.0370630.37610.353791
300.0443110.44970.326933
31-0.05587-0.5670.285966
32-0.043908-0.44560.328405
33-0.023534-0.23880.405853
34-0.039309-0.39890.34538
350.0068070.06910.47253
360.034380.34890.363933
37-0.006962-0.07070.471902
38-0.038261-0.38830.349297
390.1568721.59210.057216
400.0853370.86610.19423
41-0.056805-0.57650.282767
420.0337220.34220.366433
43-0.075696-0.76820.222054
440.0602910.61190.270982
45-0.097415-0.98870.162575
46-0.01368-0.13880.444927
47-0.006106-0.0620.475355
48-0.036253-0.36790.356843

\begin{tabular}{lllllllll}
\hline
Autocorrelation Function \tabularnewline
Time lag k & ACF(k) & T-STAT & P-value \tabularnewline
1 & -0.049852 & -0.5059 & 0.306988 \tabularnewline
2 & 0.054151 & 0.5496 & 0.291901 \tabularnewline
3 & 0.122182 & 1.24 & 0.108894 \tabularnewline
4 & 0.0693 & 0.7033 & 0.241724 \tabularnewline
5 & -0.010645 & -0.108 & 0.457089 \tabularnewline
6 & -0.02865 & -0.2908 & 0.385909 \tabularnewline
7 & -0.028955 & -0.2939 & 0.384728 \tabularnewline
8 & -0.091077 & -0.9243 & 0.178736 \tabularnewline
9 & 0.046078 & 0.4676 & 0.320513 \tabularnewline
10 & 0.08104 & 0.8225 & 0.206356 \tabularnewline
11 & -0.07838 & -0.7955 & 0.214086 \tabularnewline
12 & -0.354827 & -3.6011 & 0.000245 \tabularnewline
13 & 0.148869 & 1.5109 & 0.066943 \tabularnewline
14 & -0.190874 & -1.9372 & 0.027733 \tabularnewline
15 & -0.099127 & -1.006 & 0.15838 \tabularnewline
16 & -0.094539 & -0.9595 & 0.169786 \tabularnewline
17 & 0.086292 & 0.8758 & 0.191598 \tabularnewline
18 & 0.021851 & 0.2218 & 0.412469 \tabularnewline
19 & 0.03025 & 0.307 & 0.379731 \tabularnewline
20 & 0.127418 & 1.2932 & 0.099425 \tabularnewline
21 & -0.034747 & -0.3526 & 0.362537 \tabularnewline
22 & 0.028808 & 0.2924 & 0.385296 \tabularnewline
23 & 0.034416 & 0.3493 & 0.363796 \tabularnewline
24 & -0.085135 & -0.864 & 0.19479 \tabularnewline
25 & -0.152245 & -1.5451 & 0.062693 \tabularnewline
26 & 0.088663 & 0.8998 & 0.185155 \tabularnewline
27 & -0.04418 & -0.4484 & 0.327413 \tabularnewline
28 & -0.059616 & -0.605 & 0.273243 \tabularnewline
29 & 0.037063 & 0.3761 & 0.353791 \tabularnewline
30 & 0.044311 & 0.4497 & 0.326933 \tabularnewline
31 & -0.05587 & -0.567 & 0.285966 \tabularnewline
32 & -0.043908 & -0.4456 & 0.328405 \tabularnewline
33 & -0.023534 & -0.2388 & 0.405853 \tabularnewline
34 & -0.039309 & -0.3989 & 0.34538 \tabularnewline
35 & 0.006807 & 0.0691 & 0.47253 \tabularnewline
36 & 0.03438 & 0.3489 & 0.363933 \tabularnewline
37 & -0.006962 & -0.0707 & 0.471902 \tabularnewline
38 & -0.038261 & -0.3883 & 0.349297 \tabularnewline
39 & 0.156872 & 1.5921 & 0.057216 \tabularnewline
40 & 0.085337 & 0.8661 & 0.19423 \tabularnewline
41 & -0.056805 & -0.5765 & 0.282767 \tabularnewline
42 & 0.033722 & 0.3422 & 0.366433 \tabularnewline
43 & -0.075696 & -0.7682 & 0.222054 \tabularnewline
44 & 0.060291 & 0.6119 & 0.270982 \tabularnewline
45 & -0.097415 & -0.9887 & 0.162575 \tabularnewline
46 & -0.01368 & -0.1388 & 0.444927 \tabularnewline
47 & -0.006106 & -0.062 & 0.475355 \tabularnewline
48 & -0.036253 & -0.3679 & 0.356843 \tabularnewline
\hline
\end{tabular}
%Source: https://freestatistics.org/blog/index.php?pk=298576&T=1

[TABLE]
[ROW][C]Autocorrelation Function[/C][/ROW]
[ROW][C]Time lag k[/C][C]ACF(k)[/C][C]T-STAT[/C][C]P-value[/C][/ROW]
[ROW][C]1[/C][C]-0.049852[/C][C]-0.5059[/C][C]0.306988[/C][/ROW]
[ROW][C]2[/C][C]0.054151[/C][C]0.5496[/C][C]0.291901[/C][/ROW]
[ROW][C]3[/C][C]0.122182[/C][C]1.24[/C][C]0.108894[/C][/ROW]
[ROW][C]4[/C][C]0.0693[/C][C]0.7033[/C][C]0.241724[/C][/ROW]
[ROW][C]5[/C][C]-0.010645[/C][C]-0.108[/C][C]0.457089[/C][/ROW]
[ROW][C]6[/C][C]-0.02865[/C][C]-0.2908[/C][C]0.385909[/C][/ROW]
[ROW][C]7[/C][C]-0.028955[/C][C]-0.2939[/C][C]0.384728[/C][/ROW]
[ROW][C]8[/C][C]-0.091077[/C][C]-0.9243[/C][C]0.178736[/C][/ROW]
[ROW][C]9[/C][C]0.046078[/C][C]0.4676[/C][C]0.320513[/C][/ROW]
[ROW][C]10[/C][C]0.08104[/C][C]0.8225[/C][C]0.206356[/C][/ROW]
[ROW][C]11[/C][C]-0.07838[/C][C]-0.7955[/C][C]0.214086[/C][/ROW]
[ROW][C]12[/C][C]-0.354827[/C][C]-3.6011[/C][C]0.000245[/C][/ROW]
[ROW][C]13[/C][C]0.148869[/C][C]1.5109[/C][C]0.066943[/C][/ROW]
[ROW][C]14[/C][C]-0.190874[/C][C]-1.9372[/C][C]0.027733[/C][/ROW]
[ROW][C]15[/C][C]-0.099127[/C][C]-1.006[/C][C]0.15838[/C][/ROW]
[ROW][C]16[/C][C]-0.094539[/C][C]-0.9595[/C][C]0.169786[/C][/ROW]
[ROW][C]17[/C][C]0.086292[/C][C]0.8758[/C][C]0.191598[/C][/ROW]
[ROW][C]18[/C][C]0.021851[/C][C]0.2218[/C][C]0.412469[/C][/ROW]
[ROW][C]19[/C][C]0.03025[/C][C]0.307[/C][C]0.379731[/C][/ROW]
[ROW][C]20[/C][C]0.127418[/C][C]1.2932[/C][C]0.099425[/C][/ROW]
[ROW][C]21[/C][C]-0.034747[/C][C]-0.3526[/C][C]0.362537[/C][/ROW]
[ROW][C]22[/C][C]0.028808[/C][C]0.2924[/C][C]0.385296[/C][/ROW]
[ROW][C]23[/C][C]0.034416[/C][C]0.3493[/C][C]0.363796[/C][/ROW]
[ROW][C]24[/C][C]-0.085135[/C][C]-0.864[/C][C]0.19479[/C][/ROW]
[ROW][C]25[/C][C]-0.152245[/C][C]-1.5451[/C][C]0.062693[/C][/ROW]
[ROW][C]26[/C][C]0.088663[/C][C]0.8998[/C][C]0.185155[/C][/ROW]
[ROW][C]27[/C][C]-0.04418[/C][C]-0.4484[/C][C]0.327413[/C][/ROW]
[ROW][C]28[/C][C]-0.059616[/C][C]-0.605[/C][C]0.273243[/C][/ROW]
[ROW][C]29[/C][C]0.037063[/C][C]0.3761[/C][C]0.353791[/C][/ROW]
[ROW][C]30[/C][C]0.044311[/C][C]0.4497[/C][C]0.326933[/C][/ROW]
[ROW][C]31[/C][C]-0.05587[/C][C]-0.567[/C][C]0.285966[/C][/ROW]
[ROW][C]32[/C][C]-0.043908[/C][C]-0.4456[/C][C]0.328405[/C][/ROW]
[ROW][C]33[/C][C]-0.023534[/C][C]-0.2388[/C][C]0.405853[/C][/ROW]
[ROW][C]34[/C][C]-0.039309[/C][C]-0.3989[/C][C]0.34538[/C][/ROW]
[ROW][C]35[/C][C]0.006807[/C][C]0.0691[/C][C]0.47253[/C][/ROW]
[ROW][C]36[/C][C]0.03438[/C][C]0.3489[/C][C]0.363933[/C][/ROW]
[ROW][C]37[/C][C]-0.006962[/C][C]-0.0707[/C][C]0.471902[/C][/ROW]
[ROW][C]38[/C][C]-0.038261[/C][C]-0.3883[/C][C]0.349297[/C][/ROW]
[ROW][C]39[/C][C]0.156872[/C][C]1.5921[/C][C]0.057216[/C][/ROW]
[ROW][C]40[/C][C]0.085337[/C][C]0.8661[/C][C]0.19423[/C][/ROW]
[ROW][C]41[/C][C]-0.056805[/C][C]-0.5765[/C][C]0.282767[/C][/ROW]
[ROW][C]42[/C][C]0.033722[/C][C]0.3422[/C][C]0.366433[/C][/ROW]
[ROW][C]43[/C][C]-0.075696[/C][C]-0.7682[/C][C]0.222054[/C][/ROW]
[ROW][C]44[/C][C]0.060291[/C][C]0.6119[/C][C]0.270982[/C][/ROW]
[ROW][C]45[/C][C]-0.097415[/C][C]-0.9887[/C][C]0.162575[/C][/ROW]
[ROW][C]46[/C][C]-0.01368[/C][C]-0.1388[/C][C]0.444927[/C][/ROW]
[ROW][C]47[/C][C]-0.006106[/C][C]-0.062[/C][C]0.475355[/C][/ROW]
[ROW][C]48[/C][C]-0.036253[/C][C]-0.3679[/C][C]0.356843[/C][/ROW]
[/TABLE]
Source: https://freestatistics.org/blog/index.php?pk=298576&T=1

Globally Unique Identifier (entire table): ba.freestatistics.org/blog/index.php?pk=298576&T=1

As an alternative you can also use a QR Code:  

The GUIDs for individual cells are displayed in the table below:

Autocorrelation Function
Time lag kACF(k)T-STATP-value
1-0.049852-0.50590.306988
20.0541510.54960.291901
30.1221821.240.108894
40.06930.70330.241724
5-0.010645-0.1080.457089
6-0.02865-0.29080.385909
7-0.028955-0.29390.384728
8-0.091077-0.92430.178736
90.0460780.46760.320513
100.081040.82250.206356
11-0.07838-0.79550.214086
12-0.354827-3.60110.000245
130.1488691.51090.066943
14-0.190874-1.93720.027733
15-0.099127-1.0060.15838
16-0.094539-0.95950.169786
170.0862920.87580.191598
180.0218510.22180.412469
190.030250.3070.379731
200.1274181.29320.099425
21-0.034747-0.35260.362537
220.0288080.29240.385296
230.0344160.34930.363796
24-0.085135-0.8640.19479
25-0.152245-1.54510.062693
260.0886630.89980.185155
27-0.04418-0.44840.327413
28-0.059616-0.6050.273243
290.0370630.37610.353791
300.0443110.44970.326933
31-0.05587-0.5670.285966
32-0.043908-0.44560.328405
33-0.023534-0.23880.405853
34-0.039309-0.39890.34538
350.0068070.06910.47253
360.034380.34890.363933
37-0.006962-0.07070.471902
38-0.038261-0.38830.349297
390.1568721.59210.057216
400.0853370.86610.19423
41-0.056805-0.57650.282767
420.0337220.34220.366433
43-0.075696-0.76820.222054
440.0602910.61190.270982
45-0.097415-0.98870.162575
46-0.01368-0.13880.444927
47-0.006106-0.0620.475355
48-0.036253-0.36790.356843


Partial Autocorrelation Function
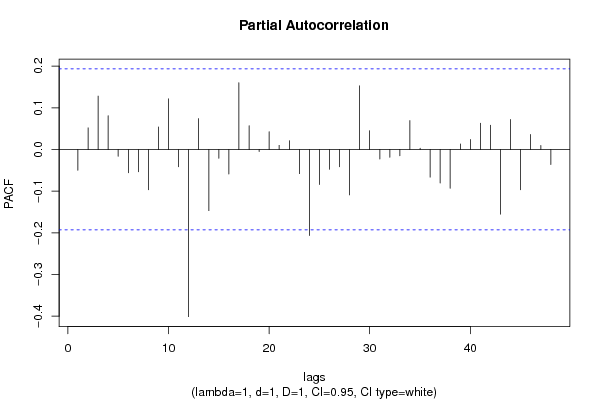
Time lag kPACF(k)T-STATP-value
1-0.049852-0.50590.306988
20.0517950.52570.300128
30.1279841.29890.098439
40.0808680.82070.20685
5-0.016277-0.16520.434557
6-0.056141-0.56980.285037
7-0.053421-0.54220.294439
8-0.096745-0.98190.164237
90.053710.54510.293432
100.1214321.23240.110303
11-0.041418-0.42040.337553
12-0.401099-4.07074.6e-05
130.0740380.75140.227061
14-0.146757-1.48940.069717
15-0.021031-0.21340.415703
16-0.059037-0.59920.275191
170.1601031.62490.053623
180.0569760.57820.282182
19-0.005079-0.05160.479493
200.0426580.43290.332986
210.0098350.09980.460343
220.0208430.21150.416446
23-0.057989-0.58850.278735
24-0.206346-2.09420.019349
25-0.084036-0.85290.197855
26-0.047608-0.48320.315001
27-0.041598-0.42220.336888
28-0.108987-1.10610.135631
290.1524811.54750.062403
300.0447440.45410.325354
31-0.023146-0.23490.407373
32-0.018647-0.18920.425138
33-0.014945-0.15170.439871
340.0691940.70220.242055
350.0028840.02930.488354
36-0.066431-0.67420.250845
37-0.080618-0.81820.207571
38-0.09291-0.94290.17396
390.012930.13120.447925
400.0238040.24160.404793
410.0627250.63660.262901
420.057980.58840.278766
43-0.15518-1.57490.059173
440.0720620.73140.233112
45-0.096557-0.97990.164704
460.0358310.36360.358436
470.0096160.09760.461222
48-0.036261-0.3680.356811

\begin{tabular}{lllllllll}
\hline
Partial Autocorrelation Function \tabularnewline
Time lag k & PACF(k) & T-STAT & P-value \tabularnewline
1 & -0.049852 & -0.5059 & 0.306988 \tabularnewline
2 & 0.051795 & 0.5257 & 0.300128 \tabularnewline
3 & 0.127984 & 1.2989 & 0.098439 \tabularnewline
4 & 0.080868 & 0.8207 & 0.20685 \tabularnewline
5 & -0.016277 & -0.1652 & 0.434557 \tabularnewline
6 & -0.056141 & -0.5698 & 0.285037 \tabularnewline
7 & -0.053421 & -0.5422 & 0.294439 \tabularnewline
8 & -0.096745 & -0.9819 & 0.164237 \tabularnewline
9 & 0.05371 & 0.5451 & 0.293432 \tabularnewline
10 & 0.121432 & 1.2324 & 0.110303 \tabularnewline
11 & -0.041418 & -0.4204 & 0.337553 \tabularnewline
12 & -0.401099 & -4.0707 & 4.6e-05 \tabularnewline
13 & 0.074038 & 0.7514 & 0.227061 \tabularnewline
14 & -0.146757 & -1.4894 & 0.069717 \tabularnewline
15 & -0.021031 & -0.2134 & 0.415703 \tabularnewline
16 & -0.059037 & -0.5992 & 0.275191 \tabularnewline
17 & 0.160103 & 1.6249 & 0.053623 \tabularnewline
18 & 0.056976 & 0.5782 & 0.282182 \tabularnewline
19 & -0.005079 & -0.0516 & 0.479493 \tabularnewline
20 & 0.042658 & 0.4329 & 0.332986 \tabularnewline
21 & 0.009835 & 0.0998 & 0.460343 \tabularnewline
22 & 0.020843 & 0.2115 & 0.416446 \tabularnewline
23 & -0.057989 & -0.5885 & 0.278735 \tabularnewline
24 & -0.206346 & -2.0942 & 0.019349 \tabularnewline
25 & -0.084036 & -0.8529 & 0.197855 \tabularnewline
26 & -0.047608 & -0.4832 & 0.315001 \tabularnewline
27 & -0.041598 & -0.4222 & 0.336888 \tabularnewline
28 & -0.108987 & -1.1061 & 0.135631 \tabularnewline
29 & 0.152481 & 1.5475 & 0.062403 \tabularnewline
30 & 0.044744 & 0.4541 & 0.325354 \tabularnewline
31 & -0.023146 & -0.2349 & 0.407373 \tabularnewline
32 & -0.018647 & -0.1892 & 0.425138 \tabularnewline
33 & -0.014945 & -0.1517 & 0.439871 \tabularnewline
34 & 0.069194 & 0.7022 & 0.242055 \tabularnewline
35 & 0.002884 & 0.0293 & 0.488354 \tabularnewline
36 & -0.066431 & -0.6742 & 0.250845 \tabularnewline
37 & -0.080618 & -0.8182 & 0.207571 \tabularnewline
38 & -0.09291 & -0.9429 & 0.17396 \tabularnewline
39 & 0.01293 & 0.1312 & 0.447925 \tabularnewline
40 & 0.023804 & 0.2416 & 0.404793 \tabularnewline
41 & 0.062725 & 0.6366 & 0.262901 \tabularnewline
42 & 0.05798 & 0.5884 & 0.278766 \tabularnewline
43 & -0.15518 & -1.5749 & 0.059173 \tabularnewline
44 & 0.072062 & 0.7314 & 0.233112 \tabularnewline
45 & -0.096557 & -0.9799 & 0.164704 \tabularnewline
46 & 0.035831 & 0.3636 & 0.358436 \tabularnewline
47 & 0.009616 & 0.0976 & 0.461222 \tabularnewline
48 & -0.036261 & -0.368 & 0.356811 \tabularnewline
\hline
\end{tabular}
%Source: https://freestatistics.org/blog/index.php?pk=298576&T=2

[TABLE]
[ROW][C]Partial Autocorrelation Function[/C][/ROW]
[ROW][C]Time lag k[/C][C]PACF(k)[/C][C]T-STAT[/C][C]P-value[/C][/ROW]
[ROW][C]1[/C][C]-0.049852[/C][C]-0.5059[/C][C]0.306988[/C][/ROW]
[ROW][C]2[/C][C]0.051795[/C][C]0.5257[/C][C]0.300128[/C][/ROW]
[ROW][C]3[/C][C]0.127984[/C][C]1.2989[/C][C]0.098439[/C][/ROW]
[ROW][C]4[/C][C]0.080868[/C][C]0.8207[/C][C]0.20685[/C][/ROW]
[ROW][C]5[/C][C]-0.016277[/C][C]-0.1652[/C][C]0.434557[/C][/ROW]
[ROW][C]6[/C][C]-0.056141[/C][C]-0.5698[/C][C]0.285037[/C][/ROW]
[ROW][C]7[/C][C]-0.053421[/C][C]-0.5422[/C][C]0.294439[/C][/ROW]
[ROW][C]8[/C][C]-0.096745[/C][C]-0.9819[/C][C]0.164237[/C][/ROW]
[ROW][C]9[/C][C]0.05371[/C][C]0.5451[/C][C]0.293432[/C][/ROW]
[ROW][C]10[/C][C]0.121432[/C][C]1.2324[/C][C]0.110303[/C][/ROW]
[ROW][C]11[/C][C]-0.041418[/C][C]-0.4204[/C][C]0.337553[/C][/ROW]
[ROW][C]12[/C][C]-0.401099[/C][C]-4.0707[/C][C]4.6e-05[/C][/ROW]
[ROW][C]13[/C][C]0.074038[/C][C]0.7514[/C][C]0.227061[/C][/ROW]
[ROW][C]14[/C][C]-0.146757[/C][C]-1.4894[/C][C]0.069717[/C][/ROW]
[ROW][C]15[/C][C]-0.021031[/C][C]-0.2134[/C][C]0.415703[/C][/ROW]
[ROW][C]16[/C][C]-0.059037[/C][C]-0.5992[/C][C]0.275191[/C][/ROW]
[ROW][C]17[/C][C]0.160103[/C][C]1.6249[/C][C]0.053623[/C][/ROW]
[ROW][C]18[/C][C]0.056976[/C][C]0.5782[/C][C]0.282182[/C][/ROW]
[ROW][C]19[/C][C]-0.005079[/C][C]-0.0516[/C][C]0.479493[/C][/ROW]
[ROW][C]20[/C][C]0.042658[/C][C]0.4329[/C][C]0.332986[/C][/ROW]
[ROW][C]21[/C][C]0.009835[/C][C]0.0998[/C][C]0.460343[/C][/ROW]
[ROW][C]22[/C][C]0.020843[/C][C]0.2115[/C][C]0.416446[/C][/ROW]
[ROW][C]23[/C][C]-0.057989[/C][C]-0.5885[/C][C]0.278735[/C][/ROW]
[ROW][C]24[/C][C]-0.206346[/C][C]-2.0942[/C][C]0.019349[/C][/ROW]
[ROW][C]25[/C][C]-0.084036[/C][C]-0.8529[/C][C]0.197855[/C][/ROW]
[ROW][C]26[/C][C]-0.047608[/C][C]-0.4832[/C][C]0.315001[/C][/ROW]
[ROW][C]27[/C][C]-0.041598[/C][C]-0.4222[/C][C]0.336888[/C][/ROW]
[ROW][C]28[/C][C]-0.108987[/C][C]-1.1061[/C][C]0.135631[/C][/ROW]
[ROW][C]29[/C][C]0.152481[/C][C]1.5475[/C][C]0.062403[/C][/ROW]
[ROW][C]30[/C][C]0.044744[/C][C]0.4541[/C][C]0.325354[/C][/ROW]
[ROW][C]31[/C][C]-0.023146[/C][C]-0.2349[/C][C]0.407373[/C][/ROW]
[ROW][C]32[/C][C]-0.018647[/C][C]-0.1892[/C][C]0.425138[/C][/ROW]
[ROW][C]33[/C][C]-0.014945[/C][C]-0.1517[/C][C]0.439871[/C][/ROW]
[ROW][C]34[/C][C]0.069194[/C][C]0.7022[/C][C]0.242055[/C][/ROW]
[ROW][C]35[/C][C]0.002884[/C][C]0.0293[/C][C]0.488354[/C][/ROW]
[ROW][C]36[/C][C]-0.066431[/C][C]-0.6742[/C][C]0.250845[/C][/ROW]
[ROW][C]37[/C][C]-0.080618[/C][C]-0.8182[/C][C]0.207571[/C][/ROW]
[ROW][C]38[/C][C]-0.09291[/C][C]-0.9429[/C][C]0.17396[/C][/ROW]
[ROW][C]39[/C][C]0.01293[/C][C]0.1312[/C][C]0.447925[/C][/ROW]
[ROW][C]40[/C][C]0.023804[/C][C]0.2416[/C][C]0.404793[/C][/ROW]
[ROW][C]41[/C][C]0.062725[/C][C]0.6366[/C][C]0.262901[/C][/ROW]
[ROW][C]42[/C][C]0.05798[/C][C]0.5884[/C][C]0.278766[/C][/ROW]
[ROW][C]43[/C][C]-0.15518[/C][C]-1.5749[/C][C]0.059173[/C][/ROW]
[ROW][C]44[/C][C]0.072062[/C][C]0.7314[/C][C]0.233112[/C][/ROW]
[ROW][C]45[/C][C]-0.096557[/C][C]-0.9799[/C][C]0.164704[/C][/ROW]
[ROW][C]46[/C][C]0.035831[/C][C]0.3636[/C][C]0.358436[/C][/ROW]
[ROW][C]47[/C][C]0.009616[/C][C]0.0976[/C][C]0.461222[/C][/ROW]
[ROW][C]48[/C][C]-0.036261[/C][C]-0.368[/C][C]0.356811[/C][/ROW]
[/TABLE]
Source: https://freestatistics.org/blog/index.php?pk=298576&T=2

Globally Unique Identifier (entire table): ba.freestatistics.org/blog/index.php?pk=298576&T=2

As an alternative you can also use a QR Code:  

The GUIDs for individual cells are displayed in the table below:

Partial Autocorrelation Function
Time lag kPACF(k)T-STATP-value
1-0.049852-0.50590.306988
20.0517950.52570.300128
30.1279841.29890.098439
40.0808680.82070.20685
5-0.016277-0.16520.434557
6-0.056141-0.56980.285037
7-0.053421-0.54220.294439
8-0.096745-0.98190.164237
90.053710.54510.293432
100.1214321.23240.110303
11-0.041418-0.42040.337553
12-0.401099-4.07074.6e-05
130.0740380.75140.227061
14-0.146757-1.48940.069717
15-0.021031-0.21340.415703
16-0.059037-0.59920.275191
170.1601031.62490.053623
180.0569760.57820.282182
19-0.005079-0.05160.479493
200.0426580.43290.332986
210.0098350.09980.460343
220.0208430.21150.416446
23-0.057989-0.58850.278735
24-0.206346-2.09420.019349
25-0.084036-0.85290.197855
26-0.047608-0.48320.315001
27-0.041598-0.42220.336888
28-0.108987-1.10610.135631
290.1524811.54750.062403
300.0447440.45410.325354
31-0.023146-0.23490.407373
32-0.018647-0.18920.425138
33-0.014945-0.15170.439871
340.0691940.70220.242055
350.0028840.02930.488354
36-0.066431-0.67420.250845
37-0.080618-0.81820.207571
38-0.09291-0.94290.17396
390.012930.13120.447925
400.0238040.24160.404793
410.0627250.63660.262901
420.057980.58840.278766
43-0.15518-1.57490.059173
440.0720620.73140.233112
45-0.096557-0.97990.164704
460.0358310.36360.358436
470.0096160.09760.461222
48-0.036261-0.3680.356811


Parameters (Session):
par1 = Default ; par2 = 1 ; par3 = 1 ; par4 = 1 ; par5 = 4 ; par6 = White Noise ; par7 = 0.95 ;
Parameters (R input):
par1 = 48 ; par2 = 1 ; par3 = 1 ; par4 = 1 ; par5 = 12 ; par6 = White Noise ; par7 = 0.95 ; par8 = ;
R code (references can be found in the software module):
if (par1 == 'Default') {
par1 = 10*log10(length(x))
} else {
par1 <- as.numeric(par1)
}
par2 <- as.numeric(par2)
par3 <- as.numeric(par3)
par4 <- as.numeric(par4)
par5 <- as.numeric(par5)
if (par6 == 'White Noise') par6 <- 'white' else par6 <- 'ma'
par7 <- as.numeric(par7)
if (par8 != '') par8 <- as.numeric(par8)
x <- na.omit(x)
ox <- x
if (par8 == '') {
if (par2 == 0) {
x <- log(x)
} else {
x <- (x ^ par2 - 1) / par2
}
} else {
x <- log(x,base=par8)
}
if (par3 > 0) x <- diff(x,lag=1,difference=par3)
if (par4 > 0) x <- diff(x,lag=par5,difference=par4)
bitmap(file='picts.png')
op <- par(mfrow=c(2,1))
plot(ox,type='l',main='Original Time Series',xlab='time',ylab='value')
if (par8=='') {
mytitle <- paste('Working Time Series (lambda=',par2,', d=',par3,', D=',par4,')',sep='')
mysub <- paste('(lambda=',par2,', d=',par3,', D=',par4,', CI=', par7, ', CI type=',par6,')',sep='')
} else {
mytitle <- paste('Working Time Series (base=',par8,', d=',par3,', D=',par4,')',sep='')
mysub <- paste('(base=',par8,', d=',par3,', D=',par4,', CI=', par7, ', CI type=',par6,')',sep='')
}
plot(x,type='l', main=mytitle,xlab='time',ylab='value')
par(op)
dev.off()
bitmap(file='pic1.png')
racf <- acf(x, par1, main='Autocorrelation', xlab='time lag', ylab='ACF', ci.type=par6, ci=par7, sub=mysub)
dev.off()
bitmap(file='pic2.png')
rpacf <- pacf(x,par1,main='Partial Autocorrelation',xlab='lags',ylab='PACF',sub=mysub)
dev.off()
(myacf <- c(racf$acf))
(mypacf <- c(rpacf$acf))
lengthx <- length(x)
sqrtn <- sqrt(lengthx)
load(file='createtable')
a<-table.start()
a<-table.row.start(a)
a<-table.element(a,'Autocorrelation Function',4,TRUE)
a<-table.row.end(a)
a<-table.row.start(a)
a<-table.element(a,'Time lag k',header=TRUE)
a<-table.element(a,'ACF(k)',header=TRUE)
a<-table.element(a,'T-STAT',header=TRUE)
a<-table.element(a,'P-value',header=TRUE)
a<-table.row.end(a)
for (i in 2:(par1+1)) {
a<-table.row.start(a)
a<-table.element(a,i-1,header=TRUE)
a<-table.element(a,round(myacf[i],6))
mytstat <- myacf[i]*sqrtn
a<-table.element(a,round(mytstat,4))
a<-table.element(a,round(1-pt(abs(mytstat),lengthx),6))
a<-table.row.end(a)
}
a<-table.end(a)
table.save(a,file='mytable.tab')
a<-table.start()
a<-table.row.start(a)
a<-table.element(a,'Partial Autocorrelation Function',4,TRUE)
a<-table.row.end(a)
a<-table.row.start(a)
a<-table.element(a,'Time lag k',header=TRUE)
a<-table.element(a,'PACF(k)',header=TRUE)
a<-table.element(a,'T-STAT',header=TRUE)
a<-table.element(a,'P-value',header=TRUE)
a<-table.row.end(a)
for (i in 1:par1) {
a<-table.row.start(a)
a<-table.element(a,i,header=TRUE)
a<-table.element(a,round(mypacf[i],6))
mytstat <- mypacf[i]*sqrtn
a<-table.element(a,round(mytstat,4))
a<-table.element(a,round(1-pt(abs(mytstat),lengthx),6))
a<-table.row.end(a)
}
a<-table.end(a)
table.save(a,file='mytable1.tab')