Free Statistics

of Irreproducible Research!

Author's title

Author*The author of this computation has been verified*
R Software Modulerwasp_structuraltimeseries.wasp
Title produced by softwareStructural Time Series Models
Date of computationFri, 09 Dec 2016 14:01:39 +0100
Cite this page as followsStatistical Computations at FreeStatistics.org, Office for Research Development and Education, URL https://freestatistics.org/blog/index.php?v=date/2016/Dec/09/t1481288613zur0oc91fpg77vk.htm/, Retrieved Fri, 17 May 2024 17:58:51 +0000
Statistical Computations at FreeStatistics.org, Office for Research Development and Education, URL https://freestatistics.org/blog/index.php?pk=298521, Retrieved Fri, 17 May 2024 17:58:51 +0000
QR Codes:

Original text written by user:
IsPrivate?No (this computation is public)
User-defined keywords
Estimated Impact80
Family? (F = Feedback message, R = changed R code, M = changed R Module, P = changed Parameters, D = changed Data)
-       [Structural Time Series Models] [N776 Structural t...] [2016-12-09 13:01:39] [40b26b3aac7c05a245868a452a1f2cfc] [Current]
Feedback Forum

Post a new message
Dataseries X:
1575.17
1184.88
1227.35
1524.42
2040.63
1556.98
1684.28
1813.09
2265
1705.56
1794.49
1887.58
2609.02
1961.94
1967.67
2069.48
2653.73
2039.95
2662.62
3110.71
3661.27
2740.05
2766.81
2877.17
3568.61
2680.25
2757.06
2926.84
3855.35
3009.72
2962.93
3076.82
3905.86
2955.93
2926.8
3104.93


Summary of computational transaction
Raw Input view raw input (R code)
Raw Outputview raw output of R engine
Computing time2 seconds
R ServerBig Analytics Cloud Computing Center

\begin{tabular}{lllllllll}
\hline
Summary of computational transaction \tabularnewline
Raw Input view raw input (R code)  \tabularnewline
Raw Outputview raw output of R engine  \tabularnewline
Computing time2 seconds \tabularnewline
R ServerBig Analytics Cloud Computing Center \tabularnewline
\hline
\end{tabular}
%Source: https://freestatistics.org/blog/index.php?pk=298521&T=0

[TABLE]
[ROW]
Summary of computational transaction[/C][/ROW] [ROW]Raw Input[/C] view raw input (R code) [/C][/ROW] [ROW]Raw Output[/C]view raw output of R engine [/C][/ROW] [ROW]Computing time[/C]2 seconds[/C][/ROW] [ROW]R Server[/C]Big Analytics Cloud Computing Center[/C][/ROW] [/TABLE] Source: https://freestatistics.org/blog/index.php?pk=298521&T=0

Globally Unique Identifier (entire table): ba.freestatistics.org/blog/index.php?pk=298521&T=0

As an alternative you can also use a QR Code:  

The GUIDs for individual cells are displayed in the table below:

Summary of computational transaction
Raw Input view raw input (R code)
Raw Outputview raw output of R engine
Computing time2 seconds
R ServerBig Analytics Cloud Computing Center


Structural Time Series Model -- Interpolation
tObservedLevelSlopeSeasonalStand. Residuals
11575.171575.17000
21184.881258.33094545974-78.2935945500412-73.4509454597414-0.571856549699508
31227.351278.72414161851-54.124745353178-51.37414161850910.660330871114799
41524.421547.2685633393833.8675907465948-22.84856333937822.03471238109795
52040.631768.184551700381.2873685371246272.4454482997051.2122272328182
61556.981681.6930400484629.7095598192077-124.713040048461-0.908552301898873
71684.281784.2015317100552.1700829654969-99.92153171005090.435590582108057
81813.091880.3461299089965.7311649749252-67.256129908990.257469276187161
922651949.6285893555666.8113391170437315.3714106444380.0211347990626389
101705.561874.5360407294222.9013433710588-168.976040729419-0.815533449738336
111794.491901.8729228939424.2711443976867-107.3829228939390.0260824681071093
121887.581951.4358807069932.0916252299654-63.8558807069920.147472343296964
132609.022207.64860000175101.097948842233401.3713999982551.31451996214375
141961.942167.1584333082257.3557887409531-205.218433308215-0.823745614442159
151967.672109.8058848263921.9659904739614-142.135884826391-0.671061829455501
162069.482171.0322103591234.0907674793121-101.5522103591240.229077554836794
172653.732217.8226931552438.0073321062789435.9073068447580.0742238410275785
182039.952227.4600795303329.2493422358989-187.510079530331-0.165498392528069
192662.622706.89191969953168.136957467437-44.27191969952742.62948382383582
203110.713154.20606272161254.306939012082-43.49606272160861.62956873160193
213661.273261.26598726245208.879980978182400.004012737549-0.85980901434317
222740.053109.6871787663297.6375244129875-369.637178766316-2.10398582142103
232766.812931.0624744627612.4004668631441-164.252474462756-1.61292030182984
242877.172894.60322044112-2.67729775927681-17.43322044112-0.28522499324359
253568.613050.5947498213846.2785991338607518.0152501786180.926296970453296
262680.253011.4277115046919.9119529706392-331.177711504688-0.498797998769249
272757.062934.19855978014-10.0608938401699-177.138559780141-0.567084333532392
282926.842966.807780192463.10582972241648-39.96778019246440.249095531160761
293855.353252.2042806658390.2072766320908603.1457193341671.64791236632442
303009.723326.7536571638485.3757961298893-317.033657163836-0.0914057634167241
312962.933201.1749114147820.2847273221498-238.244911414781-1.23147091195248
323076.823184.223768388368.79514597127803-107.403768388358-0.217370942043147
333905.863277.2897378232234.7974239594745628.5702621767780.491939364082023
342955.933243.9272991727613.7659872146899-287.997299172762-0.397893860653319
352926.83176.21793086221-11.3738021272869-249.417930862209-0.475620554149511
363104.933216.893784345884.6866102664544-111.9637843458830.303847469412562

\begin{tabular}{lllllllll}
\hline
Structural Time Series Model -- Interpolation \tabularnewline
t & Observed & Level & Slope & Seasonal & Stand. Residuals \tabularnewline
1 & 1575.17 & 1575.17 & 0 & 0 & 0 \tabularnewline
2 & 1184.88 & 1258.33094545974 & -78.2935945500412 & -73.4509454597414 & -0.571856549699508 \tabularnewline
3 & 1227.35 & 1278.72414161851 & -54.124745353178 & -51.3741416185091 & 0.660330871114799 \tabularnewline
4 & 1524.42 & 1547.26856333938 & 33.8675907465948 & -22.8485633393782 & 2.03471238109795 \tabularnewline
5 & 2040.63 & 1768.1845517003 & 81.2873685371246 & 272.445448299705 & 1.2122272328182 \tabularnewline
6 & 1556.98 & 1681.69304004846 & 29.7095598192077 & -124.713040048461 & -0.908552301898873 \tabularnewline
7 & 1684.28 & 1784.20153171005 & 52.1700829654969 & -99.9215317100509 & 0.435590582108057 \tabularnewline
8 & 1813.09 & 1880.34612990899 & 65.7311649749252 & -67.25612990899 & 0.257469276187161 \tabularnewline
9 & 2265 & 1949.62858935556 & 66.8113391170437 & 315.371410644438 & 0.0211347990626389 \tabularnewline
10 & 1705.56 & 1874.53604072942 & 22.9013433710588 & -168.976040729419 & -0.815533449738336 \tabularnewline
11 & 1794.49 & 1901.87292289394 & 24.2711443976867 & -107.382922893939 & 0.0260824681071093 \tabularnewline
12 & 1887.58 & 1951.43588070699 & 32.0916252299654 & -63.855880706992 & 0.147472343296964 \tabularnewline
13 & 2609.02 & 2207.64860000175 & 101.097948842233 & 401.371399998255 & 1.31451996214375 \tabularnewline
14 & 1961.94 & 2167.15843330822 & 57.3557887409531 & -205.218433308215 & -0.823745614442159 \tabularnewline
15 & 1967.67 & 2109.80588482639 & 21.9659904739614 & -142.135884826391 & -0.671061829455501 \tabularnewline
16 & 2069.48 & 2171.03221035912 & 34.0907674793121 & -101.552210359124 & 0.229077554836794 \tabularnewline
17 & 2653.73 & 2217.82269315524 & 38.0073321062789 & 435.907306844758 & 0.0742238410275785 \tabularnewline
18 & 2039.95 & 2227.46007953033 & 29.2493422358989 & -187.510079530331 & -0.165498392528069 \tabularnewline
19 & 2662.62 & 2706.89191969953 & 168.136957467437 & -44.2719196995274 & 2.62948382383582 \tabularnewline
20 & 3110.71 & 3154.20606272161 & 254.306939012082 & -43.4960627216086 & 1.62956873160193 \tabularnewline
21 & 3661.27 & 3261.26598726245 & 208.879980978182 & 400.004012737549 & -0.85980901434317 \tabularnewline
22 & 2740.05 & 3109.68717876632 & 97.6375244129875 & -369.637178766316 & -2.10398582142103 \tabularnewline
23 & 2766.81 & 2931.06247446276 & 12.4004668631441 & -164.252474462756 & -1.61292030182984 \tabularnewline
24 & 2877.17 & 2894.60322044112 & -2.67729775927681 & -17.43322044112 & -0.28522499324359 \tabularnewline
25 & 3568.61 & 3050.59474982138 & 46.2785991338607 & 518.015250178618 & 0.926296970453296 \tabularnewline
26 & 2680.25 & 3011.42771150469 & 19.9119529706392 & -331.177711504688 & -0.498797998769249 \tabularnewline
27 & 2757.06 & 2934.19855978014 & -10.0608938401699 & -177.138559780141 & -0.567084333532392 \tabularnewline
28 & 2926.84 & 2966.80778019246 & 3.10582972241648 & -39.9677801924644 & 0.249095531160761 \tabularnewline
29 & 3855.35 & 3252.20428066583 & 90.2072766320908 & 603.145719334167 & 1.64791236632442 \tabularnewline
30 & 3009.72 & 3326.75365716384 & 85.3757961298893 & -317.033657163836 & -0.0914057634167241 \tabularnewline
31 & 2962.93 & 3201.17491141478 & 20.2847273221498 & -238.244911414781 & -1.23147091195248 \tabularnewline
32 & 3076.82 & 3184.22376838836 & 8.79514597127803 & -107.403768388358 & -0.217370942043147 \tabularnewline
33 & 3905.86 & 3277.28973782322 & 34.7974239594745 & 628.570262176778 & 0.491939364082023 \tabularnewline
34 & 2955.93 & 3243.92729917276 & 13.7659872146899 & -287.997299172762 & -0.397893860653319 \tabularnewline
35 & 2926.8 & 3176.21793086221 & -11.3738021272869 & -249.417930862209 & -0.475620554149511 \tabularnewline
36 & 3104.93 & 3216.89378434588 & 4.6866102664544 & -111.963784345883 & 0.303847469412562 \tabularnewline
\hline
\end{tabular}
%Source: https://freestatistics.org/blog/index.php?pk=298521&T=1

[TABLE]
[ROW][C]Structural Time Series Model -- Interpolation[/C][/ROW]
[ROW][C]t[/C][C]Observed[/C][C]Level[/C][C]Slope[/C][C]Seasonal[/C][C]Stand. Residuals[/C][/ROW]
[ROW][C]1[/C][C]1575.17[/C][C]1575.17[/C][C]0[/C][C]0[/C][C]0[/C][/ROW]
[ROW][C]2[/C][C]1184.88[/C][C]1258.33094545974[/C][C]-78.2935945500412[/C][C]-73.4509454597414[/C][C]-0.571856549699508[/C][/ROW]
[ROW][C]3[/C][C]1227.35[/C][C]1278.72414161851[/C][C]-54.124745353178[/C][C]-51.3741416185091[/C][C]0.660330871114799[/C][/ROW]
[ROW][C]4[/C][C]1524.42[/C][C]1547.26856333938[/C][C]33.8675907465948[/C][C]-22.8485633393782[/C][C]2.03471238109795[/C][/ROW]
[ROW][C]5[/C][C]2040.63[/C][C]1768.1845517003[/C][C]81.2873685371246[/C][C]272.445448299705[/C][C]1.2122272328182[/C][/ROW]
[ROW][C]6[/C][C]1556.98[/C][C]1681.69304004846[/C][C]29.7095598192077[/C][C]-124.713040048461[/C][C]-0.908552301898873[/C][/ROW]
[ROW][C]7[/C][C]1684.28[/C][C]1784.20153171005[/C][C]52.1700829654969[/C][C]-99.9215317100509[/C][C]0.435590582108057[/C][/ROW]
[ROW][C]8[/C][C]1813.09[/C][C]1880.34612990899[/C][C]65.7311649749252[/C][C]-67.25612990899[/C][C]0.257469276187161[/C][/ROW]
[ROW][C]9[/C][C]2265[/C][C]1949.62858935556[/C][C]66.8113391170437[/C][C]315.371410644438[/C][C]0.0211347990626389[/C][/ROW]
[ROW][C]10[/C][C]1705.56[/C][C]1874.53604072942[/C][C]22.9013433710588[/C][C]-168.976040729419[/C][C]-0.815533449738336[/C][/ROW]
[ROW][C]11[/C][C]1794.49[/C][C]1901.87292289394[/C][C]24.2711443976867[/C][C]-107.382922893939[/C][C]0.0260824681071093[/C][/ROW]
[ROW][C]12[/C][C]1887.58[/C][C]1951.43588070699[/C][C]32.0916252299654[/C][C]-63.855880706992[/C][C]0.147472343296964[/C][/ROW]
[ROW][C]13[/C][C]2609.02[/C][C]2207.64860000175[/C][C]101.097948842233[/C][C]401.371399998255[/C][C]1.31451996214375[/C][/ROW]
[ROW][C]14[/C][C]1961.94[/C][C]2167.15843330822[/C][C]57.3557887409531[/C][C]-205.218433308215[/C][C]-0.823745614442159[/C][/ROW]
[ROW][C]15[/C][C]1967.67[/C][C]2109.80588482639[/C][C]21.9659904739614[/C][C]-142.135884826391[/C][C]-0.671061829455501[/C][/ROW]
[ROW][C]16[/C][C]2069.48[/C][C]2171.03221035912[/C][C]34.0907674793121[/C][C]-101.552210359124[/C][C]0.229077554836794[/C][/ROW]
[ROW][C]17[/C][C]2653.73[/C][C]2217.82269315524[/C][C]38.0073321062789[/C][C]435.907306844758[/C][C]0.0742238410275785[/C][/ROW]
[ROW][C]18[/C][C]2039.95[/C][C]2227.46007953033[/C][C]29.2493422358989[/C][C]-187.510079530331[/C][C]-0.165498392528069[/C][/ROW]
[ROW][C]19[/C][C]2662.62[/C][C]2706.89191969953[/C][C]168.136957467437[/C][C]-44.2719196995274[/C][C]2.62948382383582[/C][/ROW]
[ROW][C]20[/C][C]3110.71[/C][C]3154.20606272161[/C][C]254.306939012082[/C][C]-43.4960627216086[/C][C]1.62956873160193[/C][/ROW]
[ROW][C]21[/C][C]3661.27[/C][C]3261.26598726245[/C][C]208.879980978182[/C][C]400.004012737549[/C][C]-0.85980901434317[/C][/ROW]
[ROW][C]22[/C][C]2740.05[/C][C]3109.68717876632[/C][C]97.6375244129875[/C][C]-369.637178766316[/C][C]-2.10398582142103[/C][/ROW]
[ROW][C]23[/C][C]2766.81[/C][C]2931.06247446276[/C][C]12.4004668631441[/C][C]-164.252474462756[/C][C]-1.61292030182984[/C][/ROW]
[ROW][C]24[/C][C]2877.17[/C][C]2894.60322044112[/C][C]-2.67729775927681[/C][C]-17.43322044112[/C][C]-0.28522499324359[/C][/ROW]
[ROW][C]25[/C][C]3568.61[/C][C]3050.59474982138[/C][C]46.2785991338607[/C][C]518.015250178618[/C][C]0.926296970453296[/C][/ROW]
[ROW][C]26[/C][C]2680.25[/C][C]3011.42771150469[/C][C]19.9119529706392[/C][C]-331.177711504688[/C][C]-0.498797998769249[/C][/ROW]
[ROW][C]27[/C][C]2757.06[/C][C]2934.19855978014[/C][C]-10.0608938401699[/C][C]-177.138559780141[/C][C]-0.567084333532392[/C][/ROW]
[ROW][C]28[/C][C]2926.84[/C][C]2966.80778019246[/C][C]3.10582972241648[/C][C]-39.9677801924644[/C][C]0.249095531160761[/C][/ROW]
[ROW][C]29[/C][C]3855.35[/C][C]3252.20428066583[/C][C]90.2072766320908[/C][C]603.145719334167[/C][C]1.64791236632442[/C][/ROW]
[ROW][C]30[/C][C]3009.72[/C][C]3326.75365716384[/C][C]85.3757961298893[/C][C]-317.033657163836[/C][C]-0.0914057634167241[/C][/ROW]
[ROW][C]31[/C][C]2962.93[/C][C]3201.17491141478[/C][C]20.2847273221498[/C][C]-238.244911414781[/C][C]-1.23147091195248[/C][/ROW]
[ROW][C]32[/C][C]3076.82[/C][C]3184.22376838836[/C][C]8.79514597127803[/C][C]-107.403768388358[/C][C]-0.217370942043147[/C][/ROW]
[ROW][C]33[/C][C]3905.86[/C][C]3277.28973782322[/C][C]34.7974239594745[/C][C]628.570262176778[/C][C]0.491939364082023[/C][/ROW]
[ROW][C]34[/C][C]2955.93[/C][C]3243.92729917276[/C][C]13.7659872146899[/C][C]-287.997299172762[/C][C]-0.397893860653319[/C][/ROW]
[ROW][C]35[/C][C]2926.8[/C][C]3176.21793086221[/C][C]-11.3738021272869[/C][C]-249.417930862209[/C][C]-0.475620554149511[/C][/ROW]
[ROW][C]36[/C][C]3104.93[/C][C]3216.89378434588[/C][C]4.6866102664544[/C][C]-111.963784345883[/C][C]0.303847469412562[/C][/ROW]
[/TABLE]
Source: https://freestatistics.org/blog/index.php?pk=298521&T=1

Globally Unique Identifier (entire table): ba.freestatistics.org/blog/index.php?pk=298521&T=1

As an alternative you can also use a QR Code:  

The GUIDs for individual cells are displayed in the table below:

Structural Time Series Model -- Interpolation
tObservedLevelSlopeSeasonalStand. Residuals
11575.171575.17000
21184.881258.33094545974-78.2935945500412-73.4509454597414-0.571856549699508
31227.351278.72414161851-54.124745353178-51.37414161850910.660330871114799
41524.421547.2685633393833.8675907465948-22.84856333937822.03471238109795
52040.631768.184551700381.2873685371246272.4454482997051.2122272328182
61556.981681.6930400484629.7095598192077-124.713040048461-0.908552301898873
71684.281784.2015317100552.1700829654969-99.92153171005090.435590582108057
81813.091880.3461299089965.7311649749252-67.256129908990.257469276187161
922651949.6285893555666.8113391170437315.3714106444380.0211347990626389
101705.561874.5360407294222.9013433710588-168.976040729419-0.815533449738336
111794.491901.8729228939424.2711443976867-107.3829228939390.0260824681071093
121887.581951.4358807069932.0916252299654-63.8558807069920.147472343296964
132609.022207.64860000175101.097948842233401.3713999982551.31451996214375
141961.942167.1584333082257.3557887409531-205.218433308215-0.823745614442159
151967.672109.8058848263921.9659904739614-142.135884826391-0.671061829455501
162069.482171.0322103591234.0907674793121-101.5522103591240.229077554836794
172653.732217.8226931552438.0073321062789435.9073068447580.0742238410275785
182039.952227.4600795303329.2493422358989-187.510079530331-0.165498392528069
192662.622706.89191969953168.136957467437-44.27191969952742.62948382383582
203110.713154.20606272161254.306939012082-43.49606272160861.62956873160193
213661.273261.26598726245208.879980978182400.004012737549-0.85980901434317
222740.053109.6871787663297.6375244129875-369.637178766316-2.10398582142103
232766.812931.0624744627612.4004668631441-164.252474462756-1.61292030182984
242877.172894.60322044112-2.67729775927681-17.43322044112-0.28522499324359
253568.613050.5947498213846.2785991338607518.0152501786180.926296970453296
262680.253011.4277115046919.9119529706392-331.177711504688-0.498797998769249
272757.062934.19855978014-10.0608938401699-177.138559780141-0.567084333532392
282926.842966.807780192463.10582972241648-39.96778019246440.249095531160761
293855.353252.2042806658390.2072766320908603.1457193341671.64791236632442
303009.723326.7536571638485.3757961298893-317.033657163836-0.0914057634167241
312962.933201.1749114147820.2847273221498-238.244911414781-1.23147091195248
323076.823184.223768388368.79514597127803-107.403768388358-0.217370942043147
333905.863277.2897378232234.7974239594745628.5702621767780.491939364082023
342955.933243.9272991727613.7659872146899-287.997299172762-0.397893860653319
352926.83176.21793086221-11.3738021272869-249.417930862209-0.475620554149511
363104.933216.893784345884.6866102664544-111.9637843458830.303847469412562


Structural Time Series Model -- Extrapolation
tObservedLevelSeasonal
13858.058426487833241.27404645327616.784380034558
22997.522408924683270.47706218549-272.954653260809
33062.991381865013299.6800779177-236.688696052686
43221.742062928843328.88309364991-107.141030721063
53974.870489416683358.08610938212616.784380034558
63114.334471853523387.28912511433-272.954653260809
73179.803444793853416.49214084654-236.688696052686
83338.554125857693445.69515657875-107.141030721063
94091.682552345523474.89817231096616.784380034558
103231.146534782363504.10118804317-272.954653260809
113296.61550772273533.30420377538-236.688696052686
123455.366188786533562.5072195076-107.141030721063

\begin{tabular}{lllllllll}
\hline
Structural Time Series Model -- Extrapolation \tabularnewline
t & Observed & Level & Seasonal \tabularnewline
1 & 3858.05842648783 & 3241.27404645327 & 616.784380034558 \tabularnewline
2 & 2997.52240892468 & 3270.47706218549 & -272.954653260809 \tabularnewline
3 & 3062.99138186501 & 3299.6800779177 & -236.688696052686 \tabularnewline
4 & 3221.74206292884 & 3328.88309364991 & -107.141030721063 \tabularnewline
5 & 3974.87048941668 & 3358.08610938212 & 616.784380034558 \tabularnewline
6 & 3114.33447185352 & 3387.28912511433 & -272.954653260809 \tabularnewline
7 & 3179.80344479385 & 3416.49214084654 & -236.688696052686 \tabularnewline
8 & 3338.55412585769 & 3445.69515657875 & -107.141030721063 \tabularnewline
9 & 4091.68255234552 & 3474.89817231096 & 616.784380034558 \tabularnewline
10 & 3231.14653478236 & 3504.10118804317 & -272.954653260809 \tabularnewline
11 & 3296.6155077227 & 3533.30420377538 & -236.688696052686 \tabularnewline
12 & 3455.36618878653 & 3562.5072195076 & -107.141030721063 \tabularnewline
\hline
\end{tabular}
%Source: https://freestatistics.org/blog/index.php?pk=298521&T=2

[TABLE]
[ROW][C]Structural Time Series Model -- Extrapolation[/C][/ROW]
[ROW][C]t[/C][C]Observed[/C][C]Level[/C][C]Seasonal[/C][/ROW]
[ROW][C]1[/C][C]3858.05842648783[/C][C]3241.27404645327[/C][C]616.784380034558[/C][/ROW]
[ROW][C]2[/C][C]2997.52240892468[/C][C]3270.47706218549[/C][C]-272.954653260809[/C][/ROW]
[ROW][C]3[/C][C]3062.99138186501[/C][C]3299.6800779177[/C][C]-236.688696052686[/C][/ROW]
[ROW][C]4[/C][C]3221.74206292884[/C][C]3328.88309364991[/C][C]-107.141030721063[/C][/ROW]
[ROW][C]5[/C][C]3974.87048941668[/C][C]3358.08610938212[/C][C]616.784380034558[/C][/ROW]
[ROW][C]6[/C][C]3114.33447185352[/C][C]3387.28912511433[/C][C]-272.954653260809[/C][/ROW]
[ROW][C]7[/C][C]3179.80344479385[/C][C]3416.49214084654[/C][C]-236.688696052686[/C][/ROW]
[ROW][C]8[/C][C]3338.55412585769[/C][C]3445.69515657875[/C][C]-107.141030721063[/C][/ROW]
[ROW][C]9[/C][C]4091.68255234552[/C][C]3474.89817231096[/C][C]616.784380034558[/C][/ROW]
[ROW][C]10[/C][C]3231.14653478236[/C][C]3504.10118804317[/C][C]-272.954653260809[/C][/ROW]
[ROW][C]11[/C][C]3296.6155077227[/C][C]3533.30420377538[/C][C]-236.688696052686[/C][/ROW]
[ROW][C]12[/C][C]3455.36618878653[/C][C]3562.5072195076[/C][C]-107.141030721063[/C][/ROW]
[/TABLE]
Source: https://freestatistics.org/blog/index.php?pk=298521&T=2

Globally Unique Identifier (entire table): ba.freestatistics.org/blog/index.php?pk=298521&T=2

As an alternative you can also use a QR Code:  

The GUIDs for individual cells are displayed in the table below:

Structural Time Series Model -- Extrapolation
tObservedLevelSeasonal
13858.058426487833241.27404645327616.784380034558
22997.522408924683270.47706218549-272.954653260809
33062.991381865013299.6800779177-236.688696052686
43221.742062928843328.88309364991-107.141030721063
53974.870489416683358.08610938212616.784380034558
63114.334471853523387.28912511433-272.954653260809
73179.803444793853416.49214084654-236.688696052686
83338.554125857693445.69515657875-107.141030721063
94091.682552345523474.89817231096616.784380034558
103231.146534782363504.10118804317-272.954653260809
113296.61550772273533.30420377538-236.688696052686
123455.366188786533562.5072195076-107.141030721063


Parameters (Session):
par1 = 4 ; par2 = 12 ; par3 = BFGS ;
Parameters (R input):
par1 = 4 ; par2 = 12 ; par3 = BFGS ;
R code (references can be found in the software module):
require('stsm')
require('stsm.class')
require('KFKSDS')
par1 <- as.numeric(par1)
par2 <- as.numeric(par2)
nx <- length(x)
x <- ts(x,frequency=par1)
m <- StructTS(x,type='BSM')
print(m$coef)
print(m$fitted)
print(m$resid)
mylevel <- as.numeric(m$fitted[,'level'])
myslope <- as.numeric(m$fitted[,'slope'])
myseas <- as.numeric(m$fitted[,'sea'])
myresid <- as.numeric(m$resid)
myfit <- mylevel+myseas
mm <- stsm.model(model = 'BSM', y = x, transPars = 'StructTS')
fit2 <- stsmFit(mm, stsm.method = 'maxlik.td.optim', method = par3, KF.args = list(P0cov = TRUE))
(fit2.comps <- tsSmooth(fit2, P0cov = FALSE)$states)
m2 <- set.pars(mm, pmax(fit2$par, .Machine$double.eps))
(ss <- char2numeric(m2))
(pred <- predict(ss, x, n.ahead = par2))
mylagmax <- nx/2
bitmap(file='test2.png')
op <- par(mfrow = c(2,2))
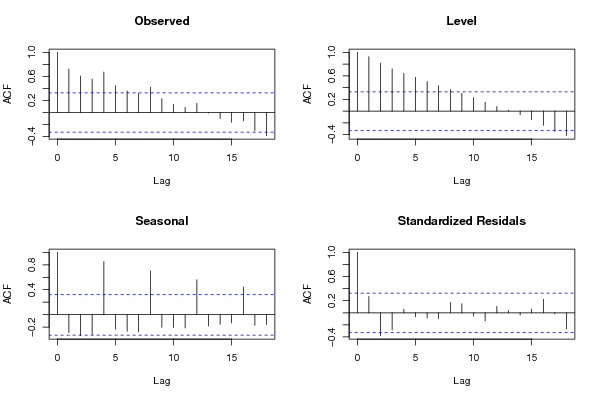
acf(as.numeric(x),lag.max = mylagmax,main='Observed')
acf(mylevel,na.action=na.pass,lag.max = mylagmax,main='Level')
acf(myseas,na.action=na.pass,lag.max = mylagmax,main='Seasonal')
acf(myresid,na.action=na.pass,lag.max = mylagmax,main='Standardized Residals')
par(op)
dev.off()
bitmap(file='test3.png')
op <- par(mfrow = c(2,2))
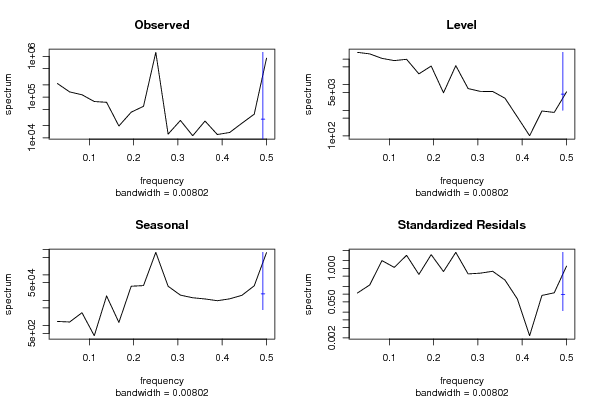
spectrum(as.numeric(x),main='Observed')
spectrum(mylevel,main='Level')
spectrum(myseas,main='Seasonal')
spectrum(myresid,main='Standardized Residals')
par(op)
dev.off()
bitmap(file='test4.png')
op <- par(mfrow = c(2,2))
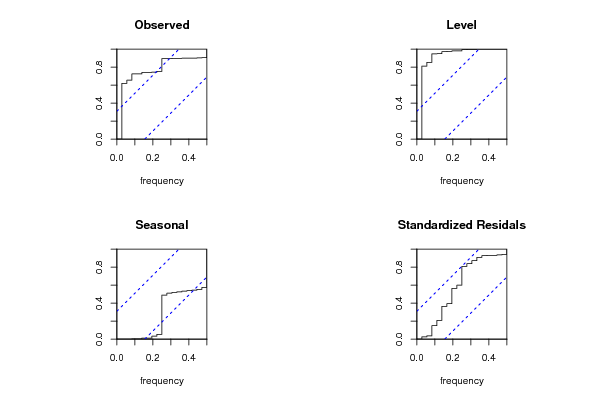
cpgram(as.numeric(x),main='Observed')
cpgram(mylevel,main='Level')
cpgram(myseas,main='Seasonal')
cpgram(myresid,main='Standardized Residals')
par(op)
dev.off()
bitmap(file='test1.png')
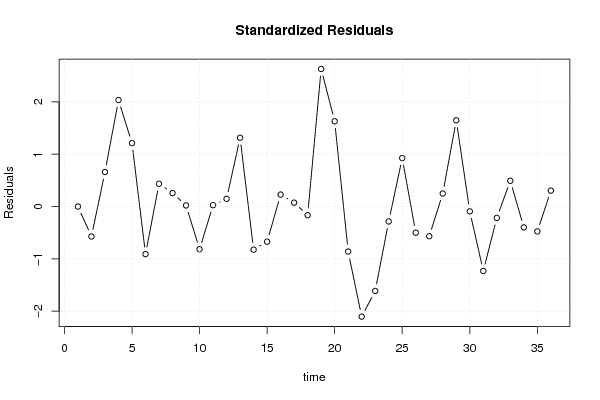
plot(as.numeric(m$resid),main='Standardized Residuals',ylab='Residuals',xlab='time',type='b')
grid()
dev.off()
bitmap(file='test5.png')
op <- par(mfrow = c(2,2))
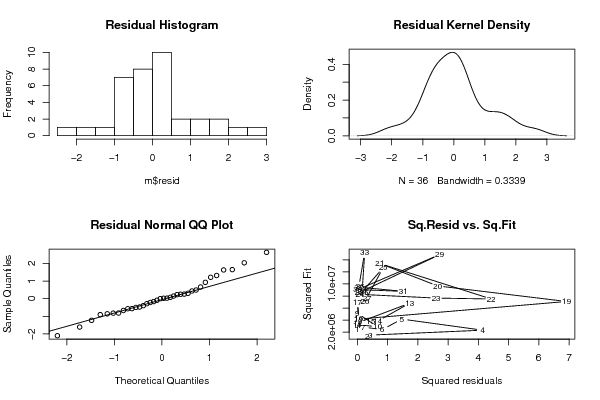
hist(m$resid,main='Residual Histogram')
plot(density(m$resid),main='Residual Kernel Density')
qqnorm(m$resid,main='Residual Normal QQ Plot')
qqline(m$resid)
plot(m$resid^2, myfit^2,main='Sq.Resid vs. Sq.Fit',xlab='Squared residuals',ylab='Squared Fit')
par(op)
dev.off()
bitmap(file='test6.png')
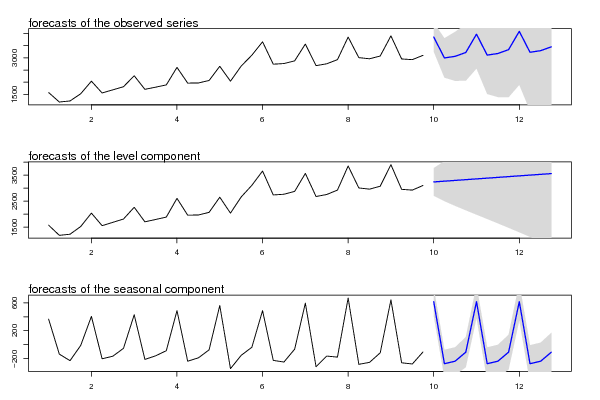
par(mfrow = c(3,1), mar = c(3,3,3,3))
plot(cbind(x, pred$pred), type = 'n', plot.type = 'single', ylab = '')
lines(x)
polygon(c(time(pred$pred), rev(time(pred$pred))), c(pred$pred + 2 * pred$se, rev(pred$pred)), col = 'gray85', border = NA)
polygon(c(time(pred$pred), rev(time(pred$pred))), c(pred$pred - 2 * pred$se, rev(pred$pred)), col = ' gray85', border = NA)
lines(pred$pred, col = 'blue', lwd = 1.5)
mtext(text = 'forecasts of the observed series', side = 3, adj = 0)
plot(cbind(x, pred$a[,1]), type = 'n', plot.type = 'single', ylab = '')
lines(x)
polygon(c(time(pred$a[,1]), rev(time(pred$a[,1]))), c(pred$a[,1] + 2 * sqrt(pred$P[,1]), rev(pred$a[,1])), col = 'gray85', border = NA)
polygon(c(time(pred$a[,1]), rev(time(pred$a[,1]))), c(pred$a[,1] - 2 * sqrt(pred$P[,1]), rev(pred$a[,1])), col = ' gray85', border = NA)
lines(pred$a[,1], col = 'blue', lwd = 1.5)
mtext(text = 'forecasts of the level component', side = 3, adj = 0)
plot(cbind(fit2.comps[,3], pred$a[,3]), type = 'n', plot.type = 'single', ylab = '')
lines(fit2.comps[,3])
polygon(c(time(pred$a[,3]), rev(time(pred$a[,3]))), c(pred$a[,3] + 2 * sqrt(pred$P[,3]), rev(pred$a[,3])), col = 'gray85', border = NA)
polygon(c(time(pred$a[,3]), rev(time(pred$a[,3]))), c(pred$a[,3] - 2 * sqrt(pred$P[,3]), rev(pred$a[,3])), col = ' gray85', border = NA)
lines(pred$a[,3], col = 'blue', lwd = 1.5)
mtext(text = 'forecasts of the seasonal component', side = 3, adj = 0)
dev.off()
load(file='createtable')
a<-table.start()
a<-table.row.start(a)
a<-table.element(a,'Structural Time Series Model -- Interpolation',6,TRUE)
a<-table.row.end(a)
a<-table.row.start(a)
a<-table.element(a,'t',header=TRUE)
a<-table.element(a,'Observed',header=TRUE)
a<-table.element(a,'Level',header=TRUE)
a<-table.element(a,'Slope',header=TRUE)
a<-table.element(a,'Seasonal',header=TRUE)
a<-table.element(a,'Stand. Residuals',header=TRUE)
a<-table.row.end(a)
for (i in 1:nx) {
a<-table.row.start(a)
a<-table.element(a,i,header=TRUE)
a<-table.element(a,x[i])
a<-table.element(a,mylevel[i])
a<-table.element(a,myslope[i])
a<-table.element(a,myseas[i])
a<-table.element(a,myresid[i])
a<-table.row.end(a)
}
a<-table.end(a)
table.save(a,file='mytable.tab')
a<-table.start()
a<-table.row.start(a)
a<-table.element(a,'Structural Time Series Model -- Extrapolation',4,TRUE)
a<-table.row.end(a)
a<-table.row.start(a)
a<-table.element(a,'t',header=TRUE)
a<-table.element(a,'Observed',header=TRUE)
a<-table.element(a,'Level',header=TRUE)
a<-table.element(a,'Seasonal',header=TRUE)
a<-table.row.end(a)
for (i in 1:par2) {
a<-table.row.start(a)
a<-table.element(a,i,header=TRUE)
a<-table.element(a,pred$pred[i])
a<-table.element(a,pred$a[i,1])
a<-table.element(a,pred$a[i,3])
a<-table.row.end(a)
}
a<-table.end(a)
table.save(a,file='mytable1.tab')