Free Statistics

of Irreproducible Research!

Author's title

Author*The author of this computation has been verified*
R Software Modulerwasp_smp.wasp
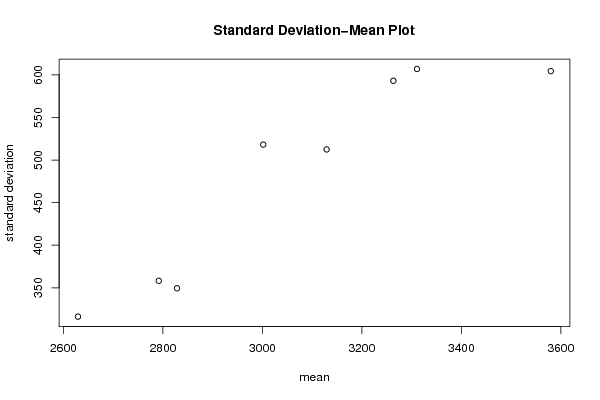
Title produced by softwareStandard Deviation-Mean Plot
Date of computationFri, 09 Dec 2016 12:54:16 +0100
Cite this page as followsStatistical Computations at FreeStatistics.org, Office for Research Development and Education, URL https://freestatistics.org/blog/index.php?v=date/2016/Dec/09/t1481286184ls2479nchj9enrb.htm/, Retrieved Fri, 17 May 2024 17:31:24 +0000
Statistical Computations at FreeStatistics.org, Office for Research Development and Education, URL https://freestatistics.org/blog/index.php?pk=298491, Retrieved Fri, 17 May 2024 17:31:24 +0000
QR Codes:

Original text written by user:
IsPrivate?No (this computation is public)
User-defined keywords
Estimated Impact68
Family? (F = Feedback message, R = changed R code, M = changed R Module, P = changed Parameters, D = changed Data)
-       [Standard Deviation-Mean Plot] [Standard Deviatio...] [2016-12-09 11:54:16] [9fb47d69755d1f4b66b6f2591280f9e0] [Current]
Feedback Forum

Post a new message
Dataseries X:
2370
4040
3310
2500
2810
3240
2770
3390
3180
3740
3480
4330
3150
3560
3340
3200
2880
3500
2830
3290
4270
4830
4050
4060
3110
2830
3390
3180
2540
2750
4720
3300
3630
3330
4070
2880
3510
2560
2820
2710
2710
3560
2840
2790
2810
3270
4020
3950
2940
2210
2500
2660
2420
2690
2450
3210
3020
3360
2900
3140
2730
3000
2500
2630
2310
4020
2640
2750
3720
3490
3120
3110
2850
3350
2710
2550
2700
2670
2470
3520
3060
3060
2440
2560
2730
2580
2550
2380
2160
2280
2430
2610
2600
3200
3090
2940


Summary of computational transaction
Raw Input view raw input (R code)
Raw Outputview raw output of R engine
Computing time1 seconds
R ServerBig Analytics Cloud Computing Center

\begin{tabular}{lllllllll}
\hline
Summary of computational transaction \tabularnewline
Raw Input view raw input (R code)  \tabularnewline
Raw Outputview raw output of R engine  \tabularnewline
Computing time1 seconds \tabularnewline
R ServerBig Analytics Cloud Computing Center \tabularnewline
\hline
\end{tabular}
%Source: https://freestatistics.org/blog/index.php?pk=298491&T=0

[TABLE]
[ROW]
Summary of computational transaction[/C][/ROW] [ROW]Raw Input[/C] view raw input (R code) [/C][/ROW] [ROW]Raw Output[/C]view raw output of R engine [/C][/ROW] [ROW]Computing time[/C]1 seconds[/C][/ROW] [ROW]R Server[/C]Big Analytics Cloud Computing Center[/C][/ROW] [/TABLE] Source: https://freestatistics.org/blog/index.php?pk=298491&T=0

Globally Unique Identifier (entire table): ba.freestatistics.org/blog/index.php?pk=298491&T=0

As an alternative you can also use a QR Code:  

The GUIDs for individual cells are displayed in the table below:

Summary of computational transaction
Raw Input view raw input (R code)
Raw Outputview raw output of R engine
Computing time1 seconds
R ServerBig Analytics Cloud Computing Center


Standard Deviation-Mean Plot
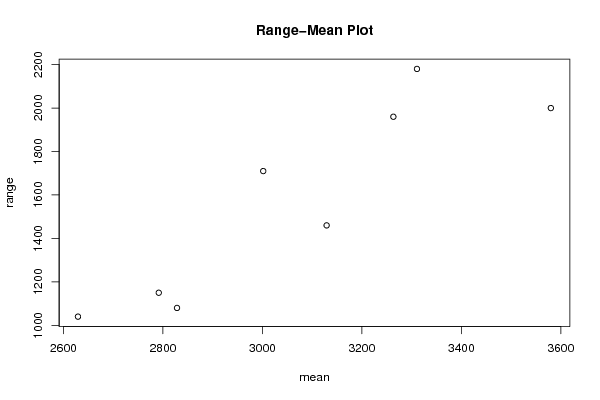
SectionMeanStandard DeviationRange
13263.33333333333593.1783931167811960
23580604.5434039609792000
33310.83333333333607.0563600213942180
43129.16666666667512.5064670693231460
52791.66666666667358.1729732795021150
63001.66666666667518.1581600128271710
72828.33333333333349.3587198733061080
82629.16666666667316.0396503701091040

\begin{tabular}{lllllllll}
\hline
Standard Deviation-Mean Plot \tabularnewline
Section & Mean & Standard Deviation & Range \tabularnewline
1 & 3263.33333333333 & 593.178393116781 & 1960 \tabularnewline
2 & 3580 & 604.543403960979 & 2000 \tabularnewline
3 & 3310.83333333333 & 607.056360021394 & 2180 \tabularnewline
4 & 3129.16666666667 & 512.506467069323 & 1460 \tabularnewline
5 & 2791.66666666667 & 358.172973279502 & 1150 \tabularnewline
6 & 3001.66666666667 & 518.158160012827 & 1710 \tabularnewline
7 & 2828.33333333333 & 349.358719873306 & 1080 \tabularnewline
8 & 2629.16666666667 & 316.039650370109 & 1040 \tabularnewline
\hline
\end{tabular}
%Source: https://freestatistics.org/blog/index.php?pk=298491&T=1

[TABLE]
[ROW][C]Standard Deviation-Mean Plot[/C][/ROW]
[ROW][C]Section[/C][C]Mean[/C][C]Standard Deviation[/C][C]Range[/C][/ROW]
[ROW][C]1[/C][C]3263.33333333333[/C][C]593.178393116781[/C][C]1960[/C][/ROW]
[ROW][C]2[/C][C]3580[/C][C]604.543403960979[/C][C]2000[/C][/ROW]
[ROW][C]3[/C][C]3310.83333333333[/C][C]607.056360021394[/C][C]2180[/C][/ROW]
[ROW][C]4[/C][C]3129.16666666667[/C][C]512.506467069323[/C][C]1460[/C][/ROW]
[ROW][C]5[/C][C]2791.66666666667[/C][C]358.172973279502[/C][C]1150[/C][/ROW]
[ROW][C]6[/C][C]3001.66666666667[/C][C]518.158160012827[/C][C]1710[/C][/ROW]
[ROW][C]7[/C][C]2828.33333333333[/C][C]349.358719873306[/C][C]1080[/C][/ROW]
[ROW][C]8[/C][C]2629.16666666667[/C][C]316.039650370109[/C][C]1040[/C][/ROW]
[/TABLE]
Source: https://freestatistics.org/blog/index.php?pk=298491&T=1

Globally Unique Identifier (entire table): ba.freestatistics.org/blog/index.php?pk=298491&T=1

As an alternative you can also use a QR Code:  

The GUIDs for individual cells are displayed in the table below:

Standard Deviation-Mean Plot
SectionMeanStandard DeviationRange
13263.33333333333593.1783931167811960
23580604.5434039609792000
33310.83333333333607.0563600213942180
43129.16666666667512.5064670693231460
52791.66666666667358.1729732795021150
63001.66666666667518.1581600128271710
72828.33333333333349.3587198733061080
82629.16666666667316.0396503701091040


Regression: S.E.(k) = alpha + beta * Mean(k)
alpha-636.586582992917
beta0.364866959341635
S.D.0.0566586498786961
T-STAT6.43973974181877
p-value0.000663411550338863

\begin{tabular}{lllllllll}
\hline
Regression: S.E.(k) = alpha + beta * Mean(k) \tabularnewline
alpha & -636.586582992917 \tabularnewline
beta & 0.364866959341635 \tabularnewline
S.D. & 0.0566586498786961 \tabularnewline
T-STAT & 6.43973974181877 \tabularnewline
p-value & 0.000663411550338863 \tabularnewline
\hline
\end{tabular}
%Source: https://freestatistics.org/blog/index.php?pk=298491&T=2

[TABLE]
[ROW][C]Regression: S.E.(k) = alpha + beta * Mean(k)[/C][/ROW]
[ROW][C]alpha[/C][C]-636.586582992917[/C][/ROW]
[ROW][C]beta[/C][C]0.364866959341635[/C][/ROW]
[ROW][C]S.D.[/C][C]0.0566586498786961[/C][/ROW]
[ROW][C]T-STAT[/C][C]6.43973974181877[/C][/ROW]
[ROW][C]p-value[/C][C]0.000663411550338863[/C][/ROW]
[/TABLE]
Source: https://freestatistics.org/blog/index.php?pk=298491&T=2

Globally Unique Identifier (entire table): ba.freestatistics.org/blog/index.php?pk=298491&T=2

As an alternative you can also use a QR Code:  

The GUIDs for individual cells are displayed in the table below:

Regression: S.E.(k) = alpha + beta * Mean(k)
alpha-636.586582992917
beta0.364866959341635
S.D.0.0566586498786961
T-STAT6.43973974181877
p-value0.000663411550338863


Regression: ln S.E.(k) = alpha + beta * ln Mean(k)
alpha-13.8561831600817
beta2.49306636001586
S.D.0.376977980473532
T-STAT6.61329438097223
p-value0.000575438786370517
Lambda-1.49306636001586

\begin{tabular}{lllllllll}
\hline
Regression: ln S.E.(k) = alpha + beta * ln Mean(k) \tabularnewline
alpha & -13.8561831600817 \tabularnewline
beta & 2.49306636001586 \tabularnewline
S.D. & 0.376977980473532 \tabularnewline
T-STAT & 6.61329438097223 \tabularnewline
p-value & 0.000575438786370517 \tabularnewline
Lambda & -1.49306636001586 \tabularnewline
\hline
\end{tabular}
%Source: https://freestatistics.org/blog/index.php?pk=298491&T=3

[TABLE]
[ROW][C]Regression: ln S.E.(k) = alpha + beta * ln Mean(k)[/C][/ROW]
[ROW][C]alpha[/C][C]-13.8561831600817[/C][/ROW]
[ROW][C]beta[/C][C]2.49306636001586[/C][/ROW]
[ROW][C]S.D.[/C][C]0.376977980473532[/C][/ROW]
[ROW][C]T-STAT[/C][C]6.61329438097223[/C][/ROW]
[ROW][C]p-value[/C][C]0.000575438786370517[/C][/ROW]
[ROW][C]Lambda[/C][C]-1.49306636001586[/C][/ROW]
[/TABLE]
Source: https://freestatistics.org/blog/index.php?pk=298491&T=3

Globally Unique Identifier (entire table): ba.freestatistics.org/blog/index.php?pk=298491&T=3

As an alternative you can also use a QR Code:  

The GUIDs for individual cells are displayed in the table below:

Regression: ln S.E.(k) = alpha + beta * ln Mean(k)
alpha-13.8561831600817
beta2.49306636001586
S.D.0.376977980473532
T-STAT6.61329438097223
p-value0.000575438786370517
Lambda-1.49306636001586


Parameters (Session):
par1 = 12 ;
Parameters (R input):
par1 = 12 ;
R code (references can be found in the software module):
par1 <- as.numeric(par1)
(n <- length(x))
(np <- floor(n / par1))
arr <- array(NA,dim=c(par1,np))
j <- 0
k <- 1
for (i in 1:(np*par1))
{
j = j + 1
arr[j,k] <- x[i]
if (j == par1) {
j = 0
k=k+1
}
}
arr
arr.mean <- array(NA,dim=np)
arr.sd <- array(NA,dim=np)
arr.range <- array(NA,dim=np)
for (j in 1:np)
{
arr.mean[j] <- mean(arr[,j],na.rm=TRUE)
arr.sd[j] <- sd(arr[,j],na.rm=TRUE)
arr.range[j] <- max(arr[,j],na.rm=TRUE) - min(arr[,j],na.rm=TRUE)
}
arr.mean
arr.sd
arr.range
(lm1 <- lm(arr.sd~arr.mean))
(lnlm1 <- lm(log(arr.sd)~log(arr.mean)))
(lm2 <- lm(arr.range~arr.mean))
bitmap(file='test1.png')
plot(arr.mean,arr.sd,main='Standard Deviation-Mean Plot',xlab='mean',ylab='standard deviation')
dev.off()
bitmap(file='test2.png')
plot(arr.mean,arr.range,main='Range-Mean Plot',xlab='mean',ylab='range')
dev.off()
load(file='createtable')
a<-table.start()
a<-table.row.start(a)
a<-table.element(a,'Standard Deviation-Mean Plot',4,TRUE)
a<-table.row.end(a)
a<-table.row.start(a)
a<-table.element(a,'Section',header=TRUE)
a<-table.element(a,'Mean',header=TRUE)
a<-table.element(a,'Standard Deviation',header=TRUE)
a<-table.element(a,'Range',header=TRUE)
a<-table.row.end(a)
for (j in 1:np) {
a<-table.row.start(a)
a<-table.element(a,j,header=TRUE)
a<-table.element(a,arr.mean[j])
a<-table.element(a,arr.sd[j] )
a<-table.element(a,arr.range[j] )
a<-table.row.end(a)
}
a<-table.end(a)
table.save(a,file='mytable.tab')
a<-table.start()
a<-table.row.start(a)
a<-table.element(a,'Regression: S.E.(k) = alpha + beta * Mean(k)',2,TRUE)
a<-table.row.end(a)
a<-table.row.start(a)
a<-table.element(a,'alpha',header=TRUE)
a<-table.element(a,lm1$coefficients[[1]])
a<-table.row.end(a)
a<-table.row.start(a)
a<-table.element(a,'beta',header=TRUE)
a<-table.element(a,lm1$coefficients[[2]])
a<-table.row.end(a)
a<-table.row.start(a)
a<-table.element(a,'S.D.',header=TRUE)
a<-table.element(a,summary(lm1)$coefficients[2,2])
a<-table.row.end(a)
a<-table.row.start(a)
a<-table.element(a,'T-STAT',header=TRUE)
a<-table.element(a,summary(lm1)$coefficients[2,3])
a<-table.row.end(a)
a<-table.row.start(a)
a<-table.element(a,'p-value',header=TRUE)
a<-table.element(a,summary(lm1)$coefficients[2,4])
a<-table.row.end(a)
a<-table.end(a)
table.save(a,file='mytable1.tab')
a<-table.start()
a<-table.row.start(a)
a<-table.element(a,'Regression: ln S.E.(k) = alpha + beta * ln Mean(k)',2,TRUE)
a<-table.row.end(a)
a<-table.row.start(a)
a<-table.element(a,'alpha',header=TRUE)
a<-table.element(a,lnlm1$coefficients[[1]])
a<-table.row.end(a)
a<-table.row.start(a)
a<-table.element(a,'beta',header=TRUE)
a<-table.element(a,lnlm1$coefficients[[2]])
a<-table.row.end(a)
a<-table.row.start(a)
a<-table.element(a,'S.D.',header=TRUE)
a<-table.element(a,summary(lnlm1)$coefficients[2,2])
a<-table.row.end(a)
a<-table.row.start(a)
a<-table.element(a,'T-STAT',header=TRUE)
a<-table.element(a,summary(lnlm1)$coefficients[2,3])
a<-table.row.end(a)
a<-table.row.start(a)
a<-table.element(a,'p-value',header=TRUE)
a<-table.element(a,summary(lnlm1)$coefficients[2,4])
a<-table.row.end(a)
a<-table.row.start(a)
a<-table.element(a,'Lambda',header=TRUE)
a<-table.element(a,1-lnlm1$coefficients[[2]])
a<-table.row.end(a)
a<-table.end(a)
table.save(a,file='mytable2.tab')