Free Statistics

of Irreproducible Research!

Author's title

Author*The author of this computation has been verified*
R Software Modulerwasp_autocorrelation.wasp
Title produced by software(Partial) Autocorrelation Function
Date of computationFri, 09 Dec 2016 12:19:02 +0100
Cite this page as followsStatistical Computations at FreeStatistics.org, Office for Research Development and Education, URL https://freestatistics.org/blog/index.php?v=date/2016/Dec/09/t1481282416j9tf8vm6yvu2fvv.htm/, Retrieved Fri, 17 May 2024 12:34:57 +0000
Statistical Computations at FreeStatistics.org, Office for Research Development and Education, URL https://freestatistics.org/blog/index.php?pk=298466, Retrieved Fri, 17 May 2024 12:34:57 +0000
QR Codes:

Original text written by user:
IsPrivate?No (this computation is public)
User-defined keywords
Estimated Impact96
Family? (F = Feedback message, R = changed R code, M = changed R Module, P = changed Parameters, D = changed Data)
-       [(Partial) Autocorrelation Function] [autocorrelatie D=...] [2016-12-09 11:19:02] [1440fd85db505f66df8a556f9c91a076] [Current]
Feedback Forum

Post a new message
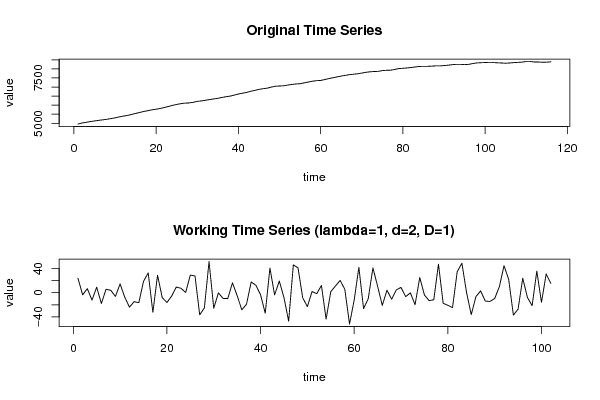
Dataseries X:
4956
5014.8
5053
5092.2
5126
5160
5188.8
5219.4
5255.6
5297
5349.8
5392.4
5429.8
5483.2
5540
5594.4
5650.2
5694
5741.8
5773.6
5816.8
5869.2
5927
5989.2
6038.8
6080.6
6111
6122.6
6154.4
6207
6231.2
6268.4
6309
6342.6
6376
6423.2
6465.2
6499.8
6552.2
6613.6
6658.6
6699.4
6763.4
6814.8
6869.4
6907.6
6936
6994.6
7043.2
7056.2
7068
7106.6
7141.2
7168.2
7184.6
7229.2
7273.4
7320.6
7350
7362.6
7411.2
7465.4
7510.2
7558.8
7605.4
7642.8
7681.6
7705
7729.8
7768.8
7810.4
7840.8
7855.4
7863.6
7904.4
7922.8
7929.4
7968
8018.6
8032.8
8052.6
8075.8
8106.4
8134.6
8140.6
8140
8152.2
8167.2
8166.6
8185
8203.8
8233.6
8251.6
8252.2
8235.6
8251.4
8293.8
8329.8
8342.4
8351.4
8347.8
8349.4
8337
8326
8313
8327.4
8346.4
8360.8
8374.6
8406
8406.2
8381.4
8379.8
8367.4
8372
8393.4


Summary of computational transaction
Raw Input view raw input (R code)
Raw Outputview raw output of R engine
Computing time1 seconds
R ServerBig Analytics Cloud Computing Center

\begin{tabular}{lllllllll}
\hline
Summary of computational transaction \tabularnewline
Raw Input view raw input (R code)  \tabularnewline
Raw Outputview raw output of R engine  \tabularnewline
Computing time1 seconds \tabularnewline
R ServerBig Analytics Cloud Computing Center \tabularnewline
\hline
\end{tabular}
%Source: https://freestatistics.org/blog/index.php?pk=298466&T=0

[TABLE]
[ROW]
Summary of computational transaction[/C][/ROW] [ROW]Raw Input[/C] view raw input (R code) [/C][/ROW] [ROW]Raw Output[/C]view raw output of R engine [/C][/ROW] [ROW]Computing time[/C]1 seconds[/C][/ROW] [ROW]R Server[/C]Big Analytics Cloud Computing Center[/C][/ROW] [/TABLE] Source: https://freestatistics.org/blog/index.php?pk=298466&T=0

Globally Unique Identifier (entire table): ba.freestatistics.org/blog/index.php?pk=298466&T=0

As an alternative you can also use a QR Code:  

The GUIDs for individual cells are displayed in the table below:

Summary of computational transaction
Raw Input view raw input (R code)
Raw Outputview raw output of R engine
Computing time1 seconds
R ServerBig Analytics Cloud Computing Center


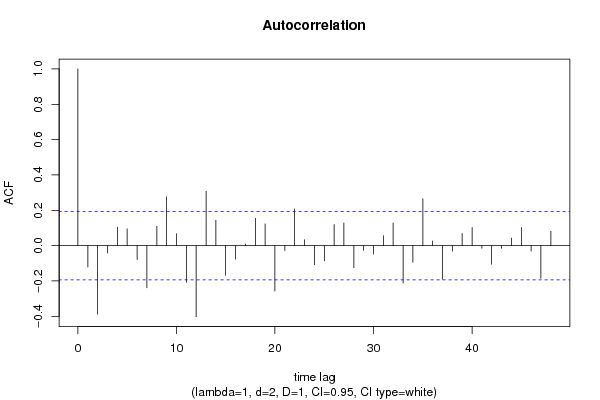
Autocorrelation Function
Time lag kACF(k)T-STATP-value
1-0.121172-1.22380.111928
2-0.387438-3.91298.2e-05
3-0.042313-0.42730.335017
40.1039541.04990.148127
50.0948270.95770.170239
6-0.078613-0.7940.214534
7-0.23905-2.41430.008774
80.1097481.10840.135148
90.2757042.78450.003196
100.0669480.67610.250242
11-0.207399-2.09460.019341
12-0.402265-4.06274.8e-05
130.3081783.11240.001204
140.1434561.44880.075226
15-0.167769-1.69440.046622
16-0.076669-0.77430.220267
170.0086090.08690.465444
180.1544711.56010.060919
190.122811.24030.108852
20-0.25675-2.5930.005455
21-0.027765-0.28040.389863
220.2070632.09120.019496
230.0332710.3360.368773
24-0.108921-1.10.136951
25-0.086035-0.86890.193467
260.1186031.19780.11688
270.1275061.28770.100374
28-0.125748-1.270.103488
29-0.027216-0.27490.391985
30-0.048344-0.48830.313209
310.0553350.55890.288742
320.128211.29490.099147
33-0.212133-2.14240.017269
34-0.094384-0.95320.171362
350.2652592.6790.004305
360.0262580.26520.395699
37-0.190196-1.92090.028769
38-0.031224-0.31530.376572
390.0686620.69340.244802
400.1020671.03080.152531
41-0.014812-0.14960.440692
42-0.105592-1.06640.144375
43-0.015226-0.15380.439044
440.0423710.42790.334804
450.102761.03780.150902
46-0.031019-0.31330.377357
47-0.185008-1.86850.032281
480.0814550.82270.206313

\begin{tabular}{lllllllll}
\hline
Autocorrelation Function \tabularnewline
Time lag k & ACF(k) & T-STAT & P-value \tabularnewline
1 & -0.121172 & -1.2238 & 0.111928 \tabularnewline
2 & -0.387438 & -3.9129 & 8.2e-05 \tabularnewline
3 & -0.042313 & -0.4273 & 0.335017 \tabularnewline
4 & 0.103954 & 1.0499 & 0.148127 \tabularnewline
5 & 0.094827 & 0.9577 & 0.170239 \tabularnewline
6 & -0.078613 & -0.794 & 0.214534 \tabularnewline
7 & -0.23905 & -2.4143 & 0.008774 \tabularnewline
8 & 0.109748 & 1.1084 & 0.135148 \tabularnewline
9 & 0.275704 & 2.7845 & 0.003196 \tabularnewline
10 & 0.066948 & 0.6761 & 0.250242 \tabularnewline
11 & -0.207399 & -2.0946 & 0.019341 \tabularnewline
12 & -0.402265 & -4.0627 & 4.8e-05 \tabularnewline
13 & 0.308178 & 3.1124 & 0.001204 \tabularnewline
14 & 0.143456 & 1.4488 & 0.075226 \tabularnewline
15 & -0.167769 & -1.6944 & 0.046622 \tabularnewline
16 & -0.076669 & -0.7743 & 0.220267 \tabularnewline
17 & 0.008609 & 0.0869 & 0.465444 \tabularnewline
18 & 0.154471 & 1.5601 & 0.060919 \tabularnewline
19 & 0.12281 & 1.2403 & 0.108852 \tabularnewline
20 & -0.25675 & -2.593 & 0.005455 \tabularnewline
21 & -0.027765 & -0.2804 & 0.389863 \tabularnewline
22 & 0.207063 & 2.0912 & 0.019496 \tabularnewline
23 & 0.033271 & 0.336 & 0.368773 \tabularnewline
24 & -0.108921 & -1.1 & 0.136951 \tabularnewline
25 & -0.086035 & -0.8689 & 0.193467 \tabularnewline
26 & 0.118603 & 1.1978 & 0.11688 \tabularnewline
27 & 0.127506 & 1.2877 & 0.100374 \tabularnewline
28 & -0.125748 & -1.27 & 0.103488 \tabularnewline
29 & -0.027216 & -0.2749 & 0.391985 \tabularnewline
30 & -0.048344 & -0.4883 & 0.313209 \tabularnewline
31 & 0.055335 & 0.5589 & 0.288742 \tabularnewline
32 & 0.12821 & 1.2949 & 0.099147 \tabularnewline
33 & -0.212133 & -2.1424 & 0.017269 \tabularnewline
34 & -0.094384 & -0.9532 & 0.171362 \tabularnewline
35 & 0.265259 & 2.679 & 0.004305 \tabularnewline
36 & 0.026258 & 0.2652 & 0.395699 \tabularnewline
37 & -0.190196 & -1.9209 & 0.028769 \tabularnewline
38 & -0.031224 & -0.3153 & 0.376572 \tabularnewline
39 & 0.068662 & 0.6934 & 0.244802 \tabularnewline
40 & 0.102067 & 1.0308 & 0.152531 \tabularnewline
41 & -0.014812 & -0.1496 & 0.440692 \tabularnewline
42 & -0.105592 & -1.0664 & 0.144375 \tabularnewline
43 & -0.015226 & -0.1538 & 0.439044 \tabularnewline
44 & 0.042371 & 0.4279 & 0.334804 \tabularnewline
45 & 0.10276 & 1.0378 & 0.150902 \tabularnewline
46 & -0.031019 & -0.3133 & 0.377357 \tabularnewline
47 & -0.185008 & -1.8685 & 0.032281 \tabularnewline
48 & 0.081455 & 0.8227 & 0.206313 \tabularnewline
\hline
\end{tabular}
%Source: https://freestatistics.org/blog/index.php?pk=298466&T=1

[TABLE]
[ROW][C]Autocorrelation Function[/C][/ROW]
[ROW][C]Time lag k[/C][C]ACF(k)[/C][C]T-STAT[/C][C]P-value[/C][/ROW]
[ROW][C]1[/C][C]-0.121172[/C][C]-1.2238[/C][C]0.111928[/C][/ROW]
[ROW][C]2[/C][C]-0.387438[/C][C]-3.9129[/C][C]8.2e-05[/C][/ROW]
[ROW][C]3[/C][C]-0.042313[/C][C]-0.4273[/C][C]0.335017[/C][/ROW]
[ROW][C]4[/C][C]0.103954[/C][C]1.0499[/C][C]0.148127[/C][/ROW]
[ROW][C]5[/C][C]0.094827[/C][C]0.9577[/C][C]0.170239[/C][/ROW]
[ROW][C]6[/C][C]-0.078613[/C][C]-0.794[/C][C]0.214534[/C][/ROW]
[ROW][C]7[/C][C]-0.23905[/C][C]-2.4143[/C][C]0.008774[/C][/ROW]
[ROW][C]8[/C][C]0.109748[/C][C]1.1084[/C][C]0.135148[/C][/ROW]
[ROW][C]9[/C][C]0.275704[/C][C]2.7845[/C][C]0.003196[/C][/ROW]
[ROW][C]10[/C][C]0.066948[/C][C]0.6761[/C][C]0.250242[/C][/ROW]
[ROW][C]11[/C][C]-0.207399[/C][C]-2.0946[/C][C]0.019341[/C][/ROW]
[ROW][C]12[/C][C]-0.402265[/C][C]-4.0627[/C][C]4.8e-05[/C][/ROW]
[ROW][C]13[/C][C]0.308178[/C][C]3.1124[/C][C]0.001204[/C][/ROW]
[ROW][C]14[/C][C]0.143456[/C][C]1.4488[/C][C]0.075226[/C][/ROW]
[ROW][C]15[/C][C]-0.167769[/C][C]-1.6944[/C][C]0.046622[/C][/ROW]
[ROW][C]16[/C][C]-0.076669[/C][C]-0.7743[/C][C]0.220267[/C][/ROW]
[ROW][C]17[/C][C]0.008609[/C][C]0.0869[/C][C]0.465444[/C][/ROW]
[ROW][C]18[/C][C]0.154471[/C][C]1.5601[/C][C]0.060919[/C][/ROW]
[ROW][C]19[/C][C]0.12281[/C][C]1.2403[/C][C]0.108852[/C][/ROW]
[ROW][C]20[/C][C]-0.25675[/C][C]-2.593[/C][C]0.005455[/C][/ROW]
[ROW][C]21[/C][C]-0.027765[/C][C]-0.2804[/C][C]0.389863[/C][/ROW]
[ROW][C]22[/C][C]0.207063[/C][C]2.0912[/C][C]0.019496[/C][/ROW]
[ROW][C]23[/C][C]0.033271[/C][C]0.336[/C][C]0.368773[/C][/ROW]
[ROW][C]24[/C][C]-0.108921[/C][C]-1.1[/C][C]0.136951[/C][/ROW]
[ROW][C]25[/C][C]-0.086035[/C][C]-0.8689[/C][C]0.193467[/C][/ROW]
[ROW][C]26[/C][C]0.118603[/C][C]1.1978[/C][C]0.11688[/C][/ROW]
[ROW][C]27[/C][C]0.127506[/C][C]1.2877[/C][C]0.100374[/C][/ROW]
[ROW][C]28[/C][C]-0.125748[/C][C]-1.27[/C][C]0.103488[/C][/ROW]
[ROW][C]29[/C][C]-0.027216[/C][C]-0.2749[/C][C]0.391985[/C][/ROW]
[ROW][C]30[/C][C]-0.048344[/C][C]-0.4883[/C][C]0.313209[/C][/ROW]
[ROW][C]31[/C][C]0.055335[/C][C]0.5589[/C][C]0.288742[/C][/ROW]
[ROW][C]32[/C][C]0.12821[/C][C]1.2949[/C][C]0.099147[/C][/ROW]
[ROW][C]33[/C][C]-0.212133[/C][C]-2.1424[/C][C]0.017269[/C][/ROW]
[ROW][C]34[/C][C]-0.094384[/C][C]-0.9532[/C][C]0.171362[/C][/ROW]
[ROW][C]35[/C][C]0.265259[/C][C]2.679[/C][C]0.004305[/C][/ROW]
[ROW][C]36[/C][C]0.026258[/C][C]0.2652[/C][C]0.395699[/C][/ROW]
[ROW][C]37[/C][C]-0.190196[/C][C]-1.9209[/C][C]0.028769[/C][/ROW]
[ROW][C]38[/C][C]-0.031224[/C][C]-0.3153[/C][C]0.376572[/C][/ROW]
[ROW][C]39[/C][C]0.068662[/C][C]0.6934[/C][C]0.244802[/C][/ROW]
[ROW][C]40[/C][C]0.102067[/C][C]1.0308[/C][C]0.152531[/C][/ROW]
[ROW][C]41[/C][C]-0.014812[/C][C]-0.1496[/C][C]0.440692[/C][/ROW]
[ROW][C]42[/C][C]-0.105592[/C][C]-1.0664[/C][C]0.144375[/C][/ROW]
[ROW][C]43[/C][C]-0.015226[/C][C]-0.1538[/C][C]0.439044[/C][/ROW]
[ROW][C]44[/C][C]0.042371[/C][C]0.4279[/C][C]0.334804[/C][/ROW]
[ROW][C]45[/C][C]0.10276[/C][C]1.0378[/C][C]0.150902[/C][/ROW]
[ROW][C]46[/C][C]-0.031019[/C][C]-0.3133[/C][C]0.377357[/C][/ROW]
[ROW][C]47[/C][C]-0.185008[/C][C]-1.8685[/C][C]0.032281[/C][/ROW]
[ROW][C]48[/C][C]0.081455[/C][C]0.8227[/C][C]0.206313[/C][/ROW]
[/TABLE]
Source: https://freestatistics.org/blog/index.php?pk=298466&T=1

Globally Unique Identifier (entire table): ba.freestatistics.org/blog/index.php?pk=298466&T=1

As an alternative you can also use a QR Code:  

The GUIDs for individual cells are displayed in the table below:

Autocorrelation Function
Time lag kACF(k)T-STATP-value
1-0.121172-1.22380.111928
2-0.387438-3.91298.2e-05
3-0.042313-0.42730.335017
40.1039541.04990.148127
50.0948270.95770.170239
6-0.078613-0.7940.214534
7-0.23905-2.41430.008774
80.1097481.10840.135148
90.2757042.78450.003196
100.0669480.67610.250242
11-0.207399-2.09460.019341
12-0.402265-4.06274.8e-05
130.3081783.11240.001204
140.1434561.44880.075226
15-0.167769-1.69440.046622
16-0.076669-0.77430.220267
170.0086090.08690.465444
180.1544711.56010.060919
190.122811.24030.108852
20-0.25675-2.5930.005455
21-0.027765-0.28040.389863
220.2070632.09120.019496
230.0332710.3360.368773
24-0.108921-1.10.136951
25-0.086035-0.86890.193467
260.1186031.19780.11688
270.1275061.28770.100374
28-0.125748-1.270.103488
29-0.027216-0.27490.391985
30-0.048344-0.48830.313209
310.0553350.55890.288742
320.128211.29490.099147
33-0.212133-2.14240.017269
34-0.094384-0.95320.171362
350.2652592.6790.004305
360.0262580.26520.395699
37-0.190196-1.92090.028769
38-0.031224-0.31530.376572
390.0686620.69340.244802
400.1020671.03080.152531
41-0.014812-0.14960.440692
42-0.105592-1.06640.144375
43-0.015226-0.15380.439044
440.0423710.42790.334804
450.102761.03780.150902
46-0.031019-0.31330.377357
47-0.185008-1.86850.032281
480.0814550.82270.206313


Partial Autocorrelation Function
Time lag kPACF(k)T-STATP-value
1-0.121172-1.22380.111928
2-0.408113-4.12173.8e-05
3-0.192242-1.94150.027475
4-0.127338-1.28610.100668
54.1e-054e-040.499834
6-0.076866-0.77630.219682
7-0.273937-2.76660.003363
8-0.067796-0.68470.247542
90.1036511.04680.148829
100.1993642.01350.023349
110.0544980.55040.291622
12-0.419373-4.23552.5e-05
130.0465890.47050.319491
14-0.174072-1.7580.04087
15-0.06631-0.66970.252283
16-0.054535-0.55080.291496
17-0.182432-1.84250.034155
18-0.071621-0.72330.235563
19-0.08586-0.86710.193949
20-0.100323-1.01320.156678
210.1468621.48320.070548
220.1499051.5140.066563
230.0597640.60360.27373
24-0.205234-2.07280.020358
250.0704290.71130.23926
260.1065171.07580.142285
270.1258791.27130.103254
28-0.049364-0.49860.309584
29-0.007387-0.07460.470336
30-0.122865-1.24090.108749
31-0.006221-0.06280.475013
320.074030.74770.228191
330.0217820.220.413161
34-0.016868-0.17040.432531
350.0849510.8580.196463
36-0.060433-0.61030.271494
37-0.005635-0.05690.477365
380.0959340.96890.167447
390.1502851.51780.066079
40-0.04586-0.46320.322116
410.0561280.56690.286025
42-0.066112-0.66770.252918
430.050030.50530.307227
44-0.119292-1.20480.115535
45-0.066023-0.66680.253201
460.0836160.84450.200189
47-0.045465-0.45920.323544
48-0.171482-1.73190.043158

\begin{tabular}{lllllllll}
\hline
Partial Autocorrelation Function \tabularnewline
Time lag k & PACF(k) & T-STAT & P-value \tabularnewline
1 & -0.121172 & -1.2238 & 0.111928 \tabularnewline
2 & -0.408113 & -4.1217 & 3.8e-05 \tabularnewline
3 & -0.192242 & -1.9415 & 0.027475 \tabularnewline
4 & -0.127338 & -1.2861 & 0.100668 \tabularnewline
5 & 4.1e-05 & 4e-04 & 0.499834 \tabularnewline
6 & -0.076866 & -0.7763 & 0.219682 \tabularnewline
7 & -0.273937 & -2.7666 & 0.003363 \tabularnewline
8 & -0.067796 & -0.6847 & 0.247542 \tabularnewline
9 & 0.103651 & 1.0468 & 0.148829 \tabularnewline
10 & 0.199364 & 2.0135 & 0.023349 \tabularnewline
11 & 0.054498 & 0.5504 & 0.291622 \tabularnewline
12 & -0.419373 & -4.2355 & 2.5e-05 \tabularnewline
13 & 0.046589 & 0.4705 & 0.319491 \tabularnewline
14 & -0.174072 & -1.758 & 0.04087 \tabularnewline
15 & -0.06631 & -0.6697 & 0.252283 \tabularnewline
16 & -0.054535 & -0.5508 & 0.291496 \tabularnewline
17 & -0.182432 & -1.8425 & 0.034155 \tabularnewline
18 & -0.071621 & -0.7233 & 0.235563 \tabularnewline
19 & -0.08586 & -0.8671 & 0.193949 \tabularnewline
20 & -0.100323 & -1.0132 & 0.156678 \tabularnewline
21 & 0.146862 & 1.4832 & 0.070548 \tabularnewline
22 & 0.149905 & 1.514 & 0.066563 \tabularnewline
23 & 0.059764 & 0.6036 & 0.27373 \tabularnewline
24 & -0.205234 & -2.0728 & 0.020358 \tabularnewline
25 & 0.070429 & 0.7113 & 0.23926 \tabularnewline
26 & 0.106517 & 1.0758 & 0.142285 \tabularnewline
27 & 0.125879 & 1.2713 & 0.103254 \tabularnewline
28 & -0.049364 & -0.4986 & 0.309584 \tabularnewline
29 & -0.007387 & -0.0746 & 0.470336 \tabularnewline
30 & -0.122865 & -1.2409 & 0.108749 \tabularnewline
31 & -0.006221 & -0.0628 & 0.475013 \tabularnewline
32 & 0.07403 & 0.7477 & 0.228191 \tabularnewline
33 & 0.021782 & 0.22 & 0.413161 \tabularnewline
34 & -0.016868 & -0.1704 & 0.432531 \tabularnewline
35 & 0.084951 & 0.858 & 0.196463 \tabularnewline
36 & -0.060433 & -0.6103 & 0.271494 \tabularnewline
37 & -0.005635 & -0.0569 & 0.477365 \tabularnewline
38 & 0.095934 & 0.9689 & 0.167447 \tabularnewline
39 & 0.150285 & 1.5178 & 0.066079 \tabularnewline
40 & -0.04586 & -0.4632 & 0.322116 \tabularnewline
41 & 0.056128 & 0.5669 & 0.286025 \tabularnewline
42 & -0.066112 & -0.6677 & 0.252918 \tabularnewline
43 & 0.05003 & 0.5053 & 0.307227 \tabularnewline
44 & -0.119292 & -1.2048 & 0.115535 \tabularnewline
45 & -0.066023 & -0.6668 & 0.253201 \tabularnewline
46 & 0.083616 & 0.8445 & 0.200189 \tabularnewline
47 & -0.045465 & -0.4592 & 0.323544 \tabularnewline
48 & -0.171482 & -1.7319 & 0.043158 \tabularnewline
\hline
\end{tabular}
%Source: https://freestatistics.org/blog/index.php?pk=298466&T=2

[TABLE]
[ROW][C]Partial Autocorrelation Function[/C][/ROW]
[ROW][C]Time lag k[/C][C]PACF(k)[/C][C]T-STAT[/C][C]P-value[/C][/ROW]
[ROW][C]1[/C][C]-0.121172[/C][C]-1.2238[/C][C]0.111928[/C][/ROW]
[ROW][C]2[/C][C]-0.408113[/C][C]-4.1217[/C][C]3.8e-05[/C][/ROW]
[ROW][C]3[/C][C]-0.192242[/C][C]-1.9415[/C][C]0.027475[/C][/ROW]
[ROW][C]4[/C][C]-0.127338[/C][C]-1.2861[/C][C]0.100668[/C][/ROW]
[ROW][C]5[/C][C]4.1e-05[/C][C]4e-04[/C][C]0.499834[/C][/ROW]
[ROW][C]6[/C][C]-0.076866[/C][C]-0.7763[/C][C]0.219682[/C][/ROW]
[ROW][C]7[/C][C]-0.273937[/C][C]-2.7666[/C][C]0.003363[/C][/ROW]
[ROW][C]8[/C][C]-0.067796[/C][C]-0.6847[/C][C]0.247542[/C][/ROW]
[ROW][C]9[/C][C]0.103651[/C][C]1.0468[/C][C]0.148829[/C][/ROW]
[ROW][C]10[/C][C]0.199364[/C][C]2.0135[/C][C]0.023349[/C][/ROW]
[ROW][C]11[/C][C]0.054498[/C][C]0.5504[/C][C]0.291622[/C][/ROW]
[ROW][C]12[/C][C]-0.419373[/C][C]-4.2355[/C][C]2.5e-05[/C][/ROW]
[ROW][C]13[/C][C]0.046589[/C][C]0.4705[/C][C]0.319491[/C][/ROW]
[ROW][C]14[/C][C]-0.174072[/C][C]-1.758[/C][C]0.04087[/C][/ROW]
[ROW][C]15[/C][C]-0.06631[/C][C]-0.6697[/C][C]0.252283[/C][/ROW]
[ROW][C]16[/C][C]-0.054535[/C][C]-0.5508[/C][C]0.291496[/C][/ROW]
[ROW][C]17[/C][C]-0.182432[/C][C]-1.8425[/C][C]0.034155[/C][/ROW]
[ROW][C]18[/C][C]-0.071621[/C][C]-0.7233[/C][C]0.235563[/C][/ROW]
[ROW][C]19[/C][C]-0.08586[/C][C]-0.8671[/C][C]0.193949[/C][/ROW]
[ROW][C]20[/C][C]-0.100323[/C][C]-1.0132[/C][C]0.156678[/C][/ROW]
[ROW][C]21[/C][C]0.146862[/C][C]1.4832[/C][C]0.070548[/C][/ROW]
[ROW][C]22[/C][C]0.149905[/C][C]1.514[/C][C]0.066563[/C][/ROW]
[ROW][C]23[/C][C]0.059764[/C][C]0.6036[/C][C]0.27373[/C][/ROW]
[ROW][C]24[/C][C]-0.205234[/C][C]-2.0728[/C][C]0.020358[/C][/ROW]
[ROW][C]25[/C][C]0.070429[/C][C]0.7113[/C][C]0.23926[/C][/ROW]
[ROW][C]26[/C][C]0.106517[/C][C]1.0758[/C][C]0.142285[/C][/ROW]
[ROW][C]27[/C][C]0.125879[/C][C]1.2713[/C][C]0.103254[/C][/ROW]
[ROW][C]28[/C][C]-0.049364[/C][C]-0.4986[/C][C]0.309584[/C][/ROW]
[ROW][C]29[/C][C]-0.007387[/C][C]-0.0746[/C][C]0.470336[/C][/ROW]
[ROW][C]30[/C][C]-0.122865[/C][C]-1.2409[/C][C]0.108749[/C][/ROW]
[ROW][C]31[/C][C]-0.006221[/C][C]-0.0628[/C][C]0.475013[/C][/ROW]
[ROW][C]32[/C][C]0.07403[/C][C]0.7477[/C][C]0.228191[/C][/ROW]
[ROW][C]33[/C][C]0.021782[/C][C]0.22[/C][C]0.413161[/C][/ROW]
[ROW][C]34[/C][C]-0.016868[/C][C]-0.1704[/C][C]0.432531[/C][/ROW]
[ROW][C]35[/C][C]0.084951[/C][C]0.858[/C][C]0.196463[/C][/ROW]
[ROW][C]36[/C][C]-0.060433[/C][C]-0.6103[/C][C]0.271494[/C][/ROW]
[ROW][C]37[/C][C]-0.005635[/C][C]-0.0569[/C][C]0.477365[/C][/ROW]
[ROW][C]38[/C][C]0.095934[/C][C]0.9689[/C][C]0.167447[/C][/ROW]
[ROW][C]39[/C][C]0.150285[/C][C]1.5178[/C][C]0.066079[/C][/ROW]
[ROW][C]40[/C][C]-0.04586[/C][C]-0.4632[/C][C]0.322116[/C][/ROW]
[ROW][C]41[/C][C]0.056128[/C][C]0.5669[/C][C]0.286025[/C][/ROW]
[ROW][C]42[/C][C]-0.066112[/C][C]-0.6677[/C][C]0.252918[/C][/ROW]
[ROW][C]43[/C][C]0.05003[/C][C]0.5053[/C][C]0.307227[/C][/ROW]
[ROW][C]44[/C][C]-0.119292[/C][C]-1.2048[/C][C]0.115535[/C][/ROW]
[ROW][C]45[/C][C]-0.066023[/C][C]-0.6668[/C][C]0.253201[/C][/ROW]
[ROW][C]46[/C][C]0.083616[/C][C]0.8445[/C][C]0.200189[/C][/ROW]
[ROW][C]47[/C][C]-0.045465[/C][C]-0.4592[/C][C]0.323544[/C][/ROW]
[ROW][C]48[/C][C]-0.171482[/C][C]-1.7319[/C][C]0.043158[/C][/ROW]
[/TABLE]
Source: https://freestatistics.org/blog/index.php?pk=298466&T=2

Globally Unique Identifier (entire table): ba.freestatistics.org/blog/index.php?pk=298466&T=2

As an alternative you can also use a QR Code:  

The GUIDs for individual cells are displayed in the table below:

Partial Autocorrelation Function
Time lag kPACF(k)T-STATP-value
1-0.121172-1.22380.111928
2-0.408113-4.12173.8e-05
3-0.192242-1.94150.027475
4-0.127338-1.28610.100668
54.1e-054e-040.499834
6-0.076866-0.77630.219682
7-0.273937-2.76660.003363
8-0.067796-0.68470.247542
90.1036511.04680.148829
100.1993642.01350.023349
110.0544980.55040.291622
12-0.419373-4.23552.5e-05
130.0465890.47050.319491
14-0.174072-1.7580.04087
15-0.06631-0.66970.252283
16-0.054535-0.55080.291496
17-0.182432-1.84250.034155
18-0.071621-0.72330.235563
19-0.08586-0.86710.193949
20-0.100323-1.01320.156678
210.1468621.48320.070548
220.1499051.5140.066563
230.0597640.60360.27373
24-0.205234-2.07280.020358
250.0704290.71130.23926
260.1065171.07580.142285
270.1258791.27130.103254
28-0.049364-0.49860.309584
29-0.007387-0.07460.470336
30-0.122865-1.24090.108749
31-0.006221-0.06280.475013
320.074030.74770.228191
330.0217820.220.413161
34-0.016868-0.17040.432531
350.0849510.8580.196463
36-0.060433-0.61030.271494
37-0.005635-0.05690.477365
380.0959340.96890.167447
390.1502851.51780.066079
40-0.04586-0.46320.322116
410.0561280.56690.286025
42-0.066112-0.66770.252918
430.050030.50530.307227
44-0.119292-1.20480.115535
45-0.066023-0.66680.253201
460.0836160.84450.200189
47-0.045465-0.45920.323544
48-0.171482-1.73190.043158


Parameters (Session):
par1 = 48 ; par2 = 1 ; par3 = 2 ; par4 = 1 ; par5 = 12 ; par6 = White Noise ; par7 = 0.95 ;
Parameters (R input):
par1 = 48 ; par2 = 1 ; par3 = 2 ; par4 = 1 ; par5 = 12 ; par6 = White Noise ; par7 = 0.95 ; par8 = ;
R code (references can be found in the software module):
par8 <- ''
par7 <- '0.95'
par6 <- 'White Noise'
par5 <- '12'
par4 <- '1'
par3 <- '2'
par2 <- '1'
par1 <- '48'
if (par1 == 'Default') {
par1 = 10*log10(length(x))
} else {
par1 <- as.numeric(par1)
}
par2 <- as.numeric(par2)
par3 <- as.numeric(par3)
par4 <- as.numeric(par4)
par5 <- as.numeric(par5)
if (par6 == 'White Noise') par6 <- 'white' else par6 <- 'ma'
par7 <- as.numeric(par7)
if (par8 != '') par8 <- as.numeric(par8)
x <- na.omit(x)
ox <- x
if (par8 == '') {
if (par2 == 0) {
x <- log(x)
} else {
x <- (x ^ par2 - 1) / par2
}
} else {
x <- log(x,base=par8)
}
if (par3 > 0) x <- diff(x,lag=1,difference=par3)
if (par4 > 0) x <- diff(x,lag=par5,difference=par4)
bitmap(file='picts.png')
op <- par(mfrow=c(2,1))
plot(ox,type='l',main='Original Time Series',xlab='time',ylab='value')
if (par8=='') {
mytitle <- paste('Working Time Series (lambda=',par2,', d=',par3,', D=',par4,')',sep='')
mysub <- paste('(lambda=',par2,', d=',par3,', D=',par4,', CI=', par7, ', CI type=',par6,')',sep='')
} else {
mytitle <- paste('Working Time Series (base=',par8,', d=',par3,', D=',par4,')',sep='')
mysub <- paste('(base=',par8,', d=',par3,', D=',par4,', CI=', par7, ', CI type=',par6,')',sep='')
}
plot(x,type='l', main=mytitle,xlab='time',ylab='value')
par(op)
dev.off()
bitmap(file='pic1.png')
racf <- acf(x, par1, main='Autocorrelation', xlab='time lag', ylab='ACF', ci.type=par6, ci=par7, sub=mysub)
dev.off()
bitmap(file='pic2.png')
rpacf <- pacf(x,par1,main='Partial Autocorrelation',xlab='lags',ylab='PACF',sub=mysub)
dev.off()
(myacf <- c(racf$acf))
(mypacf <- c(rpacf$acf))
lengthx <- length(x)
sqrtn <- sqrt(lengthx)
load(file='createtable')
a<-table.start()
a<-table.row.start(a)
a<-table.element(a,'Autocorrelation Function',4,TRUE)
a<-table.row.end(a)
a<-table.row.start(a)
a<-table.element(a,'Time lag k',header=TRUE)
a<-table.element(a,'ACF(k)',header=TRUE)
a<-table.element(a,'T-STAT',header=TRUE)
a<-table.element(a,'P-value',header=TRUE)
a<-table.row.end(a)
for (i in 2:(par1+1)) {
a<-table.row.start(a)
a<-table.element(a,i-1,header=TRUE)
a<-table.element(a,round(myacf[i],6))
mytstat <- myacf[i]*sqrtn
a<-table.element(a,round(mytstat,4))
a<-table.element(a,round(1-pt(abs(mytstat),lengthx),6))
a<-table.row.end(a)
}
a<-table.end(a)
table.save(a,file='mytable.tab')
a<-table.start()
a<-table.row.start(a)
a<-table.element(a,'Partial Autocorrelation Function',4,TRUE)
a<-table.row.end(a)
a<-table.row.start(a)
a<-table.element(a,'Time lag k',header=TRUE)
a<-table.element(a,'PACF(k)',header=TRUE)
a<-table.element(a,'T-STAT',header=TRUE)
a<-table.element(a,'P-value',header=TRUE)
a<-table.row.end(a)
for (i in 1:par1) {
a<-table.row.start(a)
a<-table.element(a,i,header=TRUE)
a<-table.element(a,round(mypacf[i],6))
mytstat <- mypacf[i]*sqrtn
a<-table.element(a,round(mytstat,4))
a<-table.element(a,round(1-pt(abs(mytstat),lengthx),6))
a<-table.row.end(a)
}
a<-table.end(a)
table.save(a,file='mytable1.tab')