Free Statistics

of Irreproducible Research!

Author's title

Author*The author of this computation has been verified*
R Software Modulerwasp_autocorrelation.wasp
Title produced by software(Partial) Autocorrelation Function
Date of computationFri, 09 Dec 2016 12:16:49 +0100
Cite this page as followsStatistical Computations at FreeStatistics.org, Office for Research Development and Education, URL https://freestatistics.org/blog/index.php?v=date/2016/Dec/09/t1481282251qmz4uwrcfzxmfwe.htm/, Retrieved Fri, 17 May 2024 18:22:34 +0000
Statistical Computations at FreeStatistics.org, Office for Research Development and Education, URL https://freestatistics.org/blog/index.php?pk=298465, Retrieved Fri, 17 May 2024 18:22:34 +0000
QR Codes:

Original text written by user:
IsPrivate?No (this computation is public)
User-defined keywords
Estimated Impact88
Family? (F = Feedback message, R = changed R code, M = changed R Module, P = changed Parameters, D = changed Data)
-       [(Partial) Autocorrelation Function] [autocorrelatie d=2] [2016-12-09 11:16:49] [1440fd85db505f66df8a556f9c91a076] [Current]
Feedback Forum

Post a new message
Dataseries X:
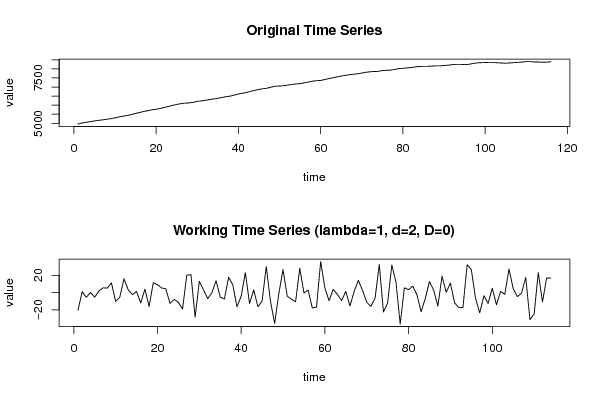
4956
5014.8
5053
5092.2
5126
5160
5188.8
5219.4
5255.6
5297
5349.8
5392.4
5429.8
5483.2
5540
5594.4
5650.2
5694
5741.8
5773.6
5816.8
5869.2
5927
5989.2
6038.8
6080.6
6111
6122.6
6154.4
6207
6231.2
6268.4
6309
6342.6
6376
6423.2
6465.2
6499.8
6552.2
6613.6
6658.6
6699.4
6763.4
6814.8
6869.4
6907.6
6936
6994.6
7043.2
7056.2
7068
7106.6
7141.2
7168.2
7184.6
7229.2
7273.4
7320.6
7350
7362.6
7411.2
7465.4
7510.2
7558.8
7605.4
7642.8
7681.6
7705
7729.8
7768.8
7810.4
7840.8
7855.4
7863.6
7904.4
7922.8
7929.4
7968
8018.6
8032.8
8052.6
8075.8
8106.4
8134.6
8140.6
8140
8152.2
8167.2
8166.6
8185
8203.8
8233.6
8251.6
8252.2
8235.6
8251.4
8293.8
8329.8
8342.4
8351.4
8347.8
8349.4
8337
8326
8313
8327.4
8346.4
8360.8
8374.6
8406
8406.2
8381.4
8379.8
8367.4
8372
8393.4


Summary of computational transaction
Raw Input view raw input (R code)
Raw Outputview raw output of R engine
Computing time2 seconds
R ServerBig Analytics Cloud Computing Center

\begin{tabular}{lllllllll}
\hline
Summary of computational transaction \tabularnewline
Raw Input view raw input (R code)  \tabularnewline
Raw Outputview raw output of R engine  \tabularnewline
Computing time2 seconds \tabularnewline
R ServerBig Analytics Cloud Computing Center \tabularnewline
\hline
\end{tabular}
%Source: https://freestatistics.org/blog/index.php?pk=298465&T=0

[TABLE]
[ROW]
Summary of computational transaction[/C][/ROW] [ROW]Raw Input[/C] view raw input (R code) [/C][/ROW] [ROW]Raw Output[/C]view raw output of R engine [/C][/ROW] [ROW]Computing time[/C]2 seconds[/C][/ROW] [ROW]R Server[/C]Big Analytics Cloud Computing Center[/C][/ROW] [/TABLE] Source: https://freestatistics.org/blog/index.php?pk=298465&T=0

Globally Unique Identifier (entire table): ba.freestatistics.org/blog/index.php?pk=298465&T=0

As an alternative you can also use a QR Code:  

The GUIDs for individual cells are displayed in the table below:

Summary of computational transaction
Raw Input view raw input (R code)
Raw Outputview raw output of R engine
Computing time2 seconds
R ServerBig Analytics Cloud Computing Center


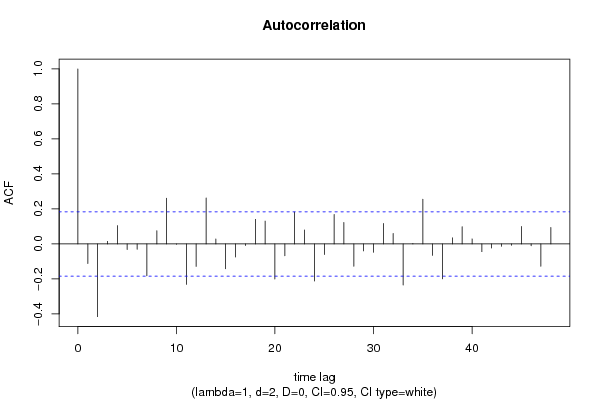
Autocorrelation Function
Time lag kACF(k)T-STATP-value
1-0.111719-1.19280.117707
2-0.415767-4.43921e-05
30.0146310.15620.438069
40.1044081.11480.133645
5-0.032223-0.34410.365721
6-0.030837-0.32920.371286
7-0.181627-1.93930.027471
80.0749470.80020.212624
90.2611912.78880.003101
10-0.001313-0.0140.494418
11-0.231476-2.47150.007467
12-0.12836-1.37050.08661
130.2625232.8030.002976
140.0282570.30170.381712
15-0.142502-1.52150.065451
16-0.074962-0.80040.212581
17-0.009516-0.10160.459623
180.1404721.49980.068211
190.1302381.39060.083534
20-0.200253-2.13810.017321
21-0.067616-0.72190.235905
220.1819181.94230.027281
230.079770.85170.19808
24-0.212144-2.26510.012699
25-0.060186-0.64260.260883
260.168251.79640.037538
270.1221131.30380.097463
28-0.127848-1.3650.087463
29-0.040049-0.42760.334873
30-0.047305-0.50510.30724
310.1163781.24260.108288
320.0590760.63080.26473
33-0.234584-2.50470.006835
340.0017390.01860.492611
350.2549132.72170.003757
36-0.065409-0.69840.243181
37-0.199735-2.13260.017552
380.0347540.37110.355638
390.098061.0470.148659
400.028640.30580.380159
41-0.044221-0.47210.318862
42-0.023036-0.2460.403079
43-0.013902-0.14840.441134
44-0.007888-0.08420.466516
450.0999851.06750.14399
46-0.011038-0.11790.453196
47-0.127798-1.36450.087547
480.0938551.00210.159209

\begin{tabular}{lllllllll}
\hline
Autocorrelation Function \tabularnewline
Time lag k & ACF(k) & T-STAT & P-value \tabularnewline
1 & -0.111719 & -1.1928 & 0.117707 \tabularnewline
2 & -0.415767 & -4.4392 & 1e-05 \tabularnewline
3 & 0.014631 & 0.1562 & 0.438069 \tabularnewline
4 & 0.104408 & 1.1148 & 0.133645 \tabularnewline
5 & -0.032223 & -0.3441 & 0.365721 \tabularnewline
6 & -0.030837 & -0.3292 & 0.371286 \tabularnewline
7 & -0.181627 & -1.9393 & 0.027471 \tabularnewline
8 & 0.074947 & 0.8002 & 0.212624 \tabularnewline
9 & 0.261191 & 2.7888 & 0.003101 \tabularnewline
10 & -0.001313 & -0.014 & 0.494418 \tabularnewline
11 & -0.231476 & -2.4715 & 0.007467 \tabularnewline
12 & -0.12836 & -1.3705 & 0.08661 \tabularnewline
13 & 0.262523 & 2.803 & 0.002976 \tabularnewline
14 & 0.028257 & 0.3017 & 0.381712 \tabularnewline
15 & -0.142502 & -1.5215 & 0.065451 \tabularnewline
16 & -0.074962 & -0.8004 & 0.212581 \tabularnewline
17 & -0.009516 & -0.1016 & 0.459623 \tabularnewline
18 & 0.140472 & 1.4998 & 0.068211 \tabularnewline
19 & 0.130238 & 1.3906 & 0.083534 \tabularnewline
20 & -0.200253 & -2.1381 & 0.017321 \tabularnewline
21 & -0.067616 & -0.7219 & 0.235905 \tabularnewline
22 & 0.181918 & 1.9423 & 0.027281 \tabularnewline
23 & 0.07977 & 0.8517 & 0.19808 \tabularnewline
24 & -0.212144 & -2.2651 & 0.012699 \tabularnewline
25 & -0.060186 & -0.6426 & 0.260883 \tabularnewline
26 & 0.16825 & 1.7964 & 0.037538 \tabularnewline
27 & 0.122113 & 1.3038 & 0.097463 \tabularnewline
28 & -0.127848 & -1.365 & 0.087463 \tabularnewline
29 & -0.040049 & -0.4276 & 0.334873 \tabularnewline
30 & -0.047305 & -0.5051 & 0.30724 \tabularnewline
31 & 0.116378 & 1.2426 & 0.108288 \tabularnewline
32 & 0.059076 & 0.6308 & 0.26473 \tabularnewline
33 & -0.234584 & -2.5047 & 0.006835 \tabularnewline
34 & 0.001739 & 0.0186 & 0.492611 \tabularnewline
35 & 0.254913 & 2.7217 & 0.003757 \tabularnewline
36 & -0.065409 & -0.6984 & 0.243181 \tabularnewline
37 & -0.199735 & -2.1326 & 0.017552 \tabularnewline
38 & 0.034754 & 0.3711 & 0.355638 \tabularnewline
39 & 0.09806 & 1.047 & 0.148659 \tabularnewline
40 & 0.02864 & 0.3058 & 0.380159 \tabularnewline
41 & -0.044221 & -0.4721 & 0.318862 \tabularnewline
42 & -0.023036 & -0.246 & 0.403079 \tabularnewline
43 & -0.013902 & -0.1484 & 0.441134 \tabularnewline
44 & -0.007888 & -0.0842 & 0.466516 \tabularnewline
45 & 0.099985 & 1.0675 & 0.14399 \tabularnewline
46 & -0.011038 & -0.1179 & 0.453196 \tabularnewline
47 & -0.127798 & -1.3645 & 0.087547 \tabularnewline
48 & 0.093855 & 1.0021 & 0.159209 \tabularnewline
\hline
\end{tabular}
%Source: https://freestatistics.org/blog/index.php?pk=298465&T=1

[TABLE]
[ROW][C]Autocorrelation Function[/C][/ROW]
[ROW][C]Time lag k[/C][C]ACF(k)[/C][C]T-STAT[/C][C]P-value[/C][/ROW]
[ROW][C]1[/C][C]-0.111719[/C][C]-1.1928[/C][C]0.117707[/C][/ROW]
[ROW][C]2[/C][C]-0.415767[/C][C]-4.4392[/C][C]1e-05[/C][/ROW]
[ROW][C]3[/C][C]0.014631[/C][C]0.1562[/C][C]0.438069[/C][/ROW]
[ROW][C]4[/C][C]0.104408[/C][C]1.1148[/C][C]0.133645[/C][/ROW]
[ROW][C]5[/C][C]-0.032223[/C][C]-0.3441[/C][C]0.365721[/C][/ROW]
[ROW][C]6[/C][C]-0.030837[/C][C]-0.3292[/C][C]0.371286[/C][/ROW]
[ROW][C]7[/C][C]-0.181627[/C][C]-1.9393[/C][C]0.027471[/C][/ROW]
[ROW][C]8[/C][C]0.074947[/C][C]0.8002[/C][C]0.212624[/C][/ROW]
[ROW][C]9[/C][C]0.261191[/C][C]2.7888[/C][C]0.003101[/C][/ROW]
[ROW][C]10[/C][C]-0.001313[/C][C]-0.014[/C][C]0.494418[/C][/ROW]
[ROW][C]11[/C][C]-0.231476[/C][C]-2.4715[/C][C]0.007467[/C][/ROW]
[ROW][C]12[/C][C]-0.12836[/C][C]-1.3705[/C][C]0.08661[/C][/ROW]
[ROW][C]13[/C][C]0.262523[/C][C]2.803[/C][C]0.002976[/C][/ROW]
[ROW][C]14[/C][C]0.028257[/C][C]0.3017[/C][C]0.381712[/C][/ROW]
[ROW][C]15[/C][C]-0.142502[/C][C]-1.5215[/C][C]0.065451[/C][/ROW]
[ROW][C]16[/C][C]-0.074962[/C][C]-0.8004[/C][C]0.212581[/C][/ROW]
[ROW][C]17[/C][C]-0.009516[/C][C]-0.1016[/C][C]0.459623[/C][/ROW]
[ROW][C]18[/C][C]0.140472[/C][C]1.4998[/C][C]0.068211[/C][/ROW]
[ROW][C]19[/C][C]0.130238[/C][C]1.3906[/C][C]0.083534[/C][/ROW]
[ROW][C]20[/C][C]-0.200253[/C][C]-2.1381[/C][C]0.017321[/C][/ROW]
[ROW][C]21[/C][C]-0.067616[/C][C]-0.7219[/C][C]0.235905[/C][/ROW]
[ROW][C]22[/C][C]0.181918[/C][C]1.9423[/C][C]0.027281[/C][/ROW]
[ROW][C]23[/C][C]0.07977[/C][C]0.8517[/C][C]0.19808[/C][/ROW]
[ROW][C]24[/C][C]-0.212144[/C][C]-2.2651[/C][C]0.012699[/C][/ROW]
[ROW][C]25[/C][C]-0.060186[/C][C]-0.6426[/C][C]0.260883[/C][/ROW]
[ROW][C]26[/C][C]0.16825[/C][C]1.7964[/C][C]0.037538[/C][/ROW]
[ROW][C]27[/C][C]0.122113[/C][C]1.3038[/C][C]0.097463[/C][/ROW]
[ROW][C]28[/C][C]-0.127848[/C][C]-1.365[/C][C]0.087463[/C][/ROW]
[ROW][C]29[/C][C]-0.040049[/C][C]-0.4276[/C][C]0.334873[/C][/ROW]
[ROW][C]30[/C][C]-0.047305[/C][C]-0.5051[/C][C]0.30724[/C][/ROW]
[ROW][C]31[/C][C]0.116378[/C][C]1.2426[/C][C]0.108288[/C][/ROW]
[ROW][C]32[/C][C]0.059076[/C][C]0.6308[/C][C]0.26473[/C][/ROW]
[ROW][C]33[/C][C]-0.234584[/C][C]-2.5047[/C][C]0.006835[/C][/ROW]
[ROW][C]34[/C][C]0.001739[/C][C]0.0186[/C][C]0.492611[/C][/ROW]
[ROW][C]35[/C][C]0.254913[/C][C]2.7217[/C][C]0.003757[/C][/ROW]
[ROW][C]36[/C][C]-0.065409[/C][C]-0.6984[/C][C]0.243181[/C][/ROW]
[ROW][C]37[/C][C]-0.199735[/C][C]-2.1326[/C][C]0.017552[/C][/ROW]
[ROW][C]38[/C][C]0.034754[/C][C]0.3711[/C][C]0.355638[/C][/ROW]
[ROW][C]39[/C][C]0.09806[/C][C]1.047[/C][C]0.148659[/C][/ROW]
[ROW][C]40[/C][C]0.02864[/C][C]0.3058[/C][C]0.380159[/C][/ROW]
[ROW][C]41[/C][C]-0.044221[/C][C]-0.4721[/C][C]0.318862[/C][/ROW]
[ROW][C]42[/C][C]-0.023036[/C][C]-0.246[/C][C]0.403079[/C][/ROW]
[ROW][C]43[/C][C]-0.013902[/C][C]-0.1484[/C][C]0.441134[/C][/ROW]
[ROW][C]44[/C][C]-0.007888[/C][C]-0.0842[/C][C]0.466516[/C][/ROW]
[ROW][C]45[/C][C]0.099985[/C][C]1.0675[/C][C]0.14399[/C][/ROW]
[ROW][C]46[/C][C]-0.011038[/C][C]-0.1179[/C][C]0.453196[/C][/ROW]
[ROW][C]47[/C][C]-0.127798[/C][C]-1.3645[/C][C]0.087547[/C][/ROW]
[ROW][C]48[/C][C]0.093855[/C][C]1.0021[/C][C]0.159209[/C][/ROW]
[/TABLE]
Source: https://freestatistics.org/blog/index.php?pk=298465&T=1

Globally Unique Identifier (entire table): ba.freestatistics.org/blog/index.php?pk=298465&T=1

As an alternative you can also use a QR Code:  

The GUIDs for individual cells are displayed in the table below:

Autocorrelation Function
Time lag kACF(k)T-STATP-value
1-0.111719-1.19280.117707
2-0.415767-4.43921e-05
30.0146310.15620.438069
40.1044081.11480.133645
5-0.032223-0.34410.365721
6-0.030837-0.32920.371286
7-0.181627-1.93930.027471
80.0749470.80020.212624
90.2611912.78880.003101
10-0.001313-0.0140.494418
11-0.231476-2.47150.007467
12-0.12836-1.37050.08661
130.2625232.8030.002976
140.0282570.30170.381712
15-0.142502-1.52150.065451
16-0.074962-0.80040.212581
17-0.009516-0.10160.459623
180.1404721.49980.068211
190.1302381.39060.083534
20-0.200253-2.13810.017321
21-0.067616-0.72190.235905
220.1819181.94230.027281
230.079770.85170.19808
24-0.212144-2.26510.012699
25-0.060186-0.64260.260883
260.168251.79640.037538
270.1221131.30380.097463
28-0.127848-1.3650.087463
29-0.040049-0.42760.334873
30-0.047305-0.50510.30724
310.1163781.24260.108288
320.0590760.63080.26473
33-0.234584-2.50470.006835
340.0017390.01860.492611
350.2549132.72170.003757
36-0.065409-0.69840.243181
37-0.199735-2.13260.017552
380.0347540.37110.355638
390.098061.0470.148659
400.028640.30580.380159
41-0.044221-0.47210.318862
42-0.023036-0.2460.403079
43-0.013902-0.14840.441134
44-0.007888-0.08420.466516
450.0999851.06750.14399
46-0.011038-0.11790.453196
47-0.127798-1.36450.087547
480.0938551.00210.159209


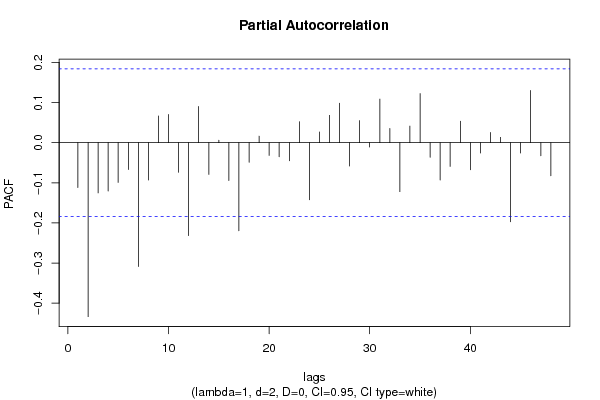
Partial Autocorrelation Function
Time lag kPACF(k)T-STATP-value
1-0.111719-1.19280.117707
2-0.433661-4.63025e-06
3-0.125229-1.33710.091929
4-0.120479-1.28640.100462
5-0.099111-1.05820.146097
6-0.067069-0.71610.237697
7-0.308913-3.29830.000649
8-0.093353-0.99670.160502
90.0661560.70630.240707
100.0702220.74980.227471
11-0.073753-0.78750.216322
12-0.231708-2.4740.007418
130.0898770.95960.169639
14-0.079096-0.84450.200077
150.0059110.06310.474893
16-0.094398-1.00790.157819
17-0.219802-2.34680.01033
18-0.04877-0.52070.301784
190.0161180.17210.431834
20-0.031852-0.34010.367209
21-0.035317-0.37710.353407
22-0.04536-0.48430.314547
230.0518430.55350.290492
24-0.142574-1.52230.065354
250.0266190.28420.388381
260.0679590.72560.234783
270.0982641.04920.14816
28-0.058138-0.62070.268003
290.0548080.58520.279787
30-0.011038-0.11780.453197
310.1084071.15750.124749
320.0350510.37420.354459
33-0.122089-1.30360.097506
340.0411510.43940.330613
350.1221381.30410.097417
36-0.036356-0.38820.349306
37-0.093227-0.99540.160826
38-0.059323-0.63340.263873
390.0532630.56870.285342
40-0.067561-0.72140.236083
41-0.025843-0.27590.391553
420.0252720.26980.393887
430.0130330.13920.444786
44-0.19725-2.1060.018697
45-0.025709-0.27450.392101
460.1298561.38650.084153
47-0.032628-0.34840.364103
48-0.082599-0.88190.189838

\begin{tabular}{lllllllll}
\hline
Partial Autocorrelation Function \tabularnewline
Time lag k & PACF(k) & T-STAT & P-value \tabularnewline
1 & -0.111719 & -1.1928 & 0.117707 \tabularnewline
2 & -0.433661 & -4.6302 & 5e-06 \tabularnewline
3 & -0.125229 & -1.3371 & 0.091929 \tabularnewline
4 & -0.120479 & -1.2864 & 0.100462 \tabularnewline
5 & -0.099111 & -1.0582 & 0.146097 \tabularnewline
6 & -0.067069 & -0.7161 & 0.237697 \tabularnewline
7 & -0.308913 & -3.2983 & 0.000649 \tabularnewline
8 & -0.093353 & -0.9967 & 0.160502 \tabularnewline
9 & 0.066156 & 0.7063 & 0.240707 \tabularnewline
10 & 0.070222 & 0.7498 & 0.227471 \tabularnewline
11 & -0.073753 & -0.7875 & 0.216322 \tabularnewline
12 & -0.231708 & -2.474 & 0.007418 \tabularnewline
13 & 0.089877 & 0.9596 & 0.169639 \tabularnewline
14 & -0.079096 & -0.8445 & 0.200077 \tabularnewline
15 & 0.005911 & 0.0631 & 0.474893 \tabularnewline
16 & -0.094398 & -1.0079 & 0.157819 \tabularnewline
17 & -0.219802 & -2.3468 & 0.01033 \tabularnewline
18 & -0.04877 & -0.5207 & 0.301784 \tabularnewline
19 & 0.016118 & 0.1721 & 0.431834 \tabularnewline
20 & -0.031852 & -0.3401 & 0.367209 \tabularnewline
21 & -0.035317 & -0.3771 & 0.353407 \tabularnewline
22 & -0.04536 & -0.4843 & 0.314547 \tabularnewline
23 & 0.051843 & 0.5535 & 0.290492 \tabularnewline
24 & -0.142574 & -1.5223 & 0.065354 \tabularnewline
25 & 0.026619 & 0.2842 & 0.388381 \tabularnewline
26 & 0.067959 & 0.7256 & 0.234783 \tabularnewline
27 & 0.098264 & 1.0492 & 0.14816 \tabularnewline
28 & -0.058138 & -0.6207 & 0.268003 \tabularnewline
29 & 0.054808 & 0.5852 & 0.279787 \tabularnewline
30 & -0.011038 & -0.1178 & 0.453197 \tabularnewline
31 & 0.108407 & 1.1575 & 0.124749 \tabularnewline
32 & 0.035051 & 0.3742 & 0.354459 \tabularnewline
33 & -0.122089 & -1.3036 & 0.097506 \tabularnewline
34 & 0.041151 & 0.4394 & 0.330613 \tabularnewline
35 & 0.122138 & 1.3041 & 0.097417 \tabularnewline
36 & -0.036356 & -0.3882 & 0.349306 \tabularnewline
37 & -0.093227 & -0.9954 & 0.160826 \tabularnewline
38 & -0.059323 & -0.6334 & 0.263873 \tabularnewline
39 & 0.053263 & 0.5687 & 0.285342 \tabularnewline
40 & -0.067561 & -0.7214 & 0.236083 \tabularnewline
41 & -0.025843 & -0.2759 & 0.391553 \tabularnewline
42 & 0.025272 & 0.2698 & 0.393887 \tabularnewline
43 & 0.013033 & 0.1392 & 0.444786 \tabularnewline
44 & -0.19725 & -2.106 & 0.018697 \tabularnewline
45 & -0.025709 & -0.2745 & 0.392101 \tabularnewline
46 & 0.129856 & 1.3865 & 0.084153 \tabularnewline
47 & -0.032628 & -0.3484 & 0.364103 \tabularnewline
48 & -0.082599 & -0.8819 & 0.189838 \tabularnewline
\hline
\end{tabular}
%Source: https://freestatistics.org/blog/index.php?pk=298465&T=2

[TABLE]
[ROW][C]Partial Autocorrelation Function[/C][/ROW]
[ROW][C]Time lag k[/C][C]PACF(k)[/C][C]T-STAT[/C][C]P-value[/C][/ROW]
[ROW][C]1[/C][C]-0.111719[/C][C]-1.1928[/C][C]0.117707[/C][/ROW]
[ROW][C]2[/C][C]-0.433661[/C][C]-4.6302[/C][C]5e-06[/C][/ROW]
[ROW][C]3[/C][C]-0.125229[/C][C]-1.3371[/C][C]0.091929[/C][/ROW]
[ROW][C]4[/C][C]-0.120479[/C][C]-1.2864[/C][C]0.100462[/C][/ROW]
[ROW][C]5[/C][C]-0.099111[/C][C]-1.0582[/C][C]0.146097[/C][/ROW]
[ROW][C]6[/C][C]-0.067069[/C][C]-0.7161[/C][C]0.237697[/C][/ROW]
[ROW][C]7[/C][C]-0.308913[/C][C]-3.2983[/C][C]0.000649[/C][/ROW]
[ROW][C]8[/C][C]-0.093353[/C][C]-0.9967[/C][C]0.160502[/C][/ROW]
[ROW][C]9[/C][C]0.066156[/C][C]0.7063[/C][C]0.240707[/C][/ROW]
[ROW][C]10[/C][C]0.070222[/C][C]0.7498[/C][C]0.227471[/C][/ROW]
[ROW][C]11[/C][C]-0.073753[/C][C]-0.7875[/C][C]0.216322[/C][/ROW]
[ROW][C]12[/C][C]-0.231708[/C][C]-2.474[/C][C]0.007418[/C][/ROW]
[ROW][C]13[/C][C]0.089877[/C][C]0.9596[/C][C]0.169639[/C][/ROW]
[ROW][C]14[/C][C]-0.079096[/C][C]-0.8445[/C][C]0.200077[/C][/ROW]
[ROW][C]15[/C][C]0.005911[/C][C]0.0631[/C][C]0.474893[/C][/ROW]
[ROW][C]16[/C][C]-0.094398[/C][C]-1.0079[/C][C]0.157819[/C][/ROW]
[ROW][C]17[/C][C]-0.219802[/C][C]-2.3468[/C][C]0.01033[/C][/ROW]
[ROW][C]18[/C][C]-0.04877[/C][C]-0.5207[/C][C]0.301784[/C][/ROW]
[ROW][C]19[/C][C]0.016118[/C][C]0.1721[/C][C]0.431834[/C][/ROW]
[ROW][C]20[/C][C]-0.031852[/C][C]-0.3401[/C][C]0.367209[/C][/ROW]
[ROW][C]21[/C][C]-0.035317[/C][C]-0.3771[/C][C]0.353407[/C][/ROW]
[ROW][C]22[/C][C]-0.04536[/C][C]-0.4843[/C][C]0.314547[/C][/ROW]
[ROW][C]23[/C][C]0.051843[/C][C]0.5535[/C][C]0.290492[/C][/ROW]
[ROW][C]24[/C][C]-0.142574[/C][C]-1.5223[/C][C]0.065354[/C][/ROW]
[ROW][C]25[/C][C]0.026619[/C][C]0.2842[/C][C]0.388381[/C][/ROW]
[ROW][C]26[/C][C]0.067959[/C][C]0.7256[/C][C]0.234783[/C][/ROW]
[ROW][C]27[/C][C]0.098264[/C][C]1.0492[/C][C]0.14816[/C][/ROW]
[ROW][C]28[/C][C]-0.058138[/C][C]-0.6207[/C][C]0.268003[/C][/ROW]
[ROW][C]29[/C][C]0.054808[/C][C]0.5852[/C][C]0.279787[/C][/ROW]
[ROW][C]30[/C][C]-0.011038[/C][C]-0.1178[/C][C]0.453197[/C][/ROW]
[ROW][C]31[/C][C]0.108407[/C][C]1.1575[/C][C]0.124749[/C][/ROW]
[ROW][C]32[/C][C]0.035051[/C][C]0.3742[/C][C]0.354459[/C][/ROW]
[ROW][C]33[/C][C]-0.122089[/C][C]-1.3036[/C][C]0.097506[/C][/ROW]
[ROW][C]34[/C][C]0.041151[/C][C]0.4394[/C][C]0.330613[/C][/ROW]
[ROW][C]35[/C][C]0.122138[/C][C]1.3041[/C][C]0.097417[/C][/ROW]
[ROW][C]36[/C][C]-0.036356[/C][C]-0.3882[/C][C]0.349306[/C][/ROW]
[ROW][C]37[/C][C]-0.093227[/C][C]-0.9954[/C][C]0.160826[/C][/ROW]
[ROW][C]38[/C][C]-0.059323[/C][C]-0.6334[/C][C]0.263873[/C][/ROW]
[ROW][C]39[/C][C]0.053263[/C][C]0.5687[/C][C]0.285342[/C][/ROW]
[ROW][C]40[/C][C]-0.067561[/C][C]-0.7214[/C][C]0.236083[/C][/ROW]
[ROW][C]41[/C][C]-0.025843[/C][C]-0.2759[/C][C]0.391553[/C][/ROW]
[ROW][C]42[/C][C]0.025272[/C][C]0.2698[/C][C]0.393887[/C][/ROW]
[ROW][C]43[/C][C]0.013033[/C][C]0.1392[/C][C]0.444786[/C][/ROW]
[ROW][C]44[/C][C]-0.19725[/C][C]-2.106[/C][C]0.018697[/C][/ROW]
[ROW][C]45[/C][C]-0.025709[/C][C]-0.2745[/C][C]0.392101[/C][/ROW]
[ROW][C]46[/C][C]0.129856[/C][C]1.3865[/C][C]0.084153[/C][/ROW]
[ROW][C]47[/C][C]-0.032628[/C][C]-0.3484[/C][C]0.364103[/C][/ROW]
[ROW][C]48[/C][C]-0.082599[/C][C]-0.8819[/C][C]0.189838[/C][/ROW]
[/TABLE]
Source: https://freestatistics.org/blog/index.php?pk=298465&T=2

Globally Unique Identifier (entire table): ba.freestatistics.org/blog/index.php?pk=298465&T=2

As an alternative you can also use a QR Code:  

The GUIDs for individual cells are displayed in the table below:

Partial Autocorrelation Function
Time lag kPACF(k)T-STATP-value
1-0.111719-1.19280.117707
2-0.433661-4.63025e-06
3-0.125229-1.33710.091929
4-0.120479-1.28640.100462
5-0.099111-1.05820.146097
6-0.067069-0.71610.237697
7-0.308913-3.29830.000649
8-0.093353-0.99670.160502
90.0661560.70630.240707
100.0702220.74980.227471
11-0.073753-0.78750.216322
12-0.231708-2.4740.007418
130.0898770.95960.169639
14-0.079096-0.84450.200077
150.0059110.06310.474893
16-0.094398-1.00790.157819
17-0.219802-2.34680.01033
18-0.04877-0.52070.301784
190.0161180.17210.431834
20-0.031852-0.34010.367209
21-0.035317-0.37710.353407
22-0.04536-0.48430.314547
230.0518430.55350.290492
24-0.142574-1.52230.065354
250.0266190.28420.388381
260.0679590.72560.234783
270.0982641.04920.14816
28-0.058138-0.62070.268003
290.0548080.58520.279787
30-0.011038-0.11780.453197
310.1084071.15750.124749
320.0350510.37420.354459
33-0.122089-1.30360.097506
340.0411510.43940.330613
350.1221381.30410.097417
36-0.036356-0.38820.349306
37-0.093227-0.99540.160826
38-0.059323-0.63340.263873
390.0532630.56870.285342
40-0.067561-0.72140.236083
41-0.025843-0.27590.391553
420.0252720.26980.393887
430.0130330.13920.444786
44-0.19725-2.1060.018697
45-0.025709-0.27450.392101
460.1298561.38650.084153
47-0.032628-0.34840.364103
48-0.082599-0.88190.189838


Parameters (Session):
par1 = 48 ; par2 = 1 ; par3 = 2 ; par4 = 0 ; par5 = 12 ; par6 = White Noise ; par7 = 0.95 ;
Parameters (R input):
par1 = 48 ; par2 = 1 ; par3 = 2 ; par4 = 0 ; par5 = 12 ; par6 = White Noise ; par7 = 0.95 ; par8 = ;
R code (references can be found in the software module):
par8 <- ''
par7 <- '0.95'
par6 <- 'White Noise'
par5 <- '12'
par4 <- '2'
par3 <- '0'
par2 <- '1'
par1 <- '48'
if (par1 == 'Default') {
par1 = 10*log10(length(x))
} else {
par1 <- as.numeric(par1)
}
par2 <- as.numeric(par2)
par3 <- as.numeric(par3)
par4 <- as.numeric(par4)
par5 <- as.numeric(par5)
if (par6 == 'White Noise') par6 <- 'white' else par6 <- 'ma'
par7 <- as.numeric(par7)
if (par8 != '') par8 <- as.numeric(par8)
x <- na.omit(x)
ox <- x
if (par8 == '') {
if (par2 == 0) {
x <- log(x)
} else {
x <- (x ^ par2 - 1) / par2
}
} else {
x <- log(x,base=par8)
}
if (par3 > 0) x <- diff(x,lag=1,difference=par3)
if (par4 > 0) x <- diff(x,lag=par5,difference=par4)
bitmap(file='picts.png')
op <- par(mfrow=c(2,1))
plot(ox,type='l',main='Original Time Series',xlab='time',ylab='value')
if (par8=='') {
mytitle <- paste('Working Time Series (lambda=',par2,', d=',par3,', D=',par4,')',sep='')
mysub <- paste('(lambda=',par2,', d=',par3,', D=',par4,', CI=', par7, ', CI type=',par6,')',sep='')
} else {
mytitle <- paste('Working Time Series (base=',par8,', d=',par3,', D=',par4,')',sep='')
mysub <- paste('(base=',par8,', d=',par3,', D=',par4,', CI=', par7, ', CI type=',par6,')',sep='')
}
plot(x,type='l', main=mytitle,xlab='time',ylab='value')
par(op)
dev.off()
bitmap(file='pic1.png')
racf <- acf(x, par1, main='Autocorrelation', xlab='time lag', ylab='ACF', ci.type=par6, ci=par7, sub=mysub)
dev.off()
bitmap(file='pic2.png')
rpacf <- pacf(x,par1,main='Partial Autocorrelation',xlab='lags',ylab='PACF',sub=mysub)
dev.off()
(myacf <- c(racf$acf))
(mypacf <- c(rpacf$acf))
lengthx <- length(x)
sqrtn <- sqrt(lengthx)
load(file='createtable')
a<-table.start()
a<-table.row.start(a)
a<-table.element(a,'Autocorrelation Function',4,TRUE)
a<-table.row.end(a)
a<-table.row.start(a)
a<-table.element(a,'Time lag k',header=TRUE)
a<-table.element(a,'ACF(k)',header=TRUE)
a<-table.element(a,'T-STAT',header=TRUE)
a<-table.element(a,'P-value',header=TRUE)
a<-table.row.end(a)
for (i in 2:(par1+1)) {
a<-table.row.start(a)
a<-table.element(a,i-1,header=TRUE)
a<-table.element(a,round(myacf[i],6))
mytstat <- myacf[i]*sqrtn
a<-table.element(a,round(mytstat,4))
a<-table.element(a,round(1-pt(abs(mytstat),lengthx),6))
a<-table.row.end(a)
}
a<-table.end(a)
table.save(a,file='mytable.tab')
a<-table.start()
a<-table.row.start(a)
a<-table.element(a,'Partial Autocorrelation Function',4,TRUE)
a<-table.row.end(a)
a<-table.row.start(a)
a<-table.element(a,'Time lag k',header=TRUE)
a<-table.element(a,'PACF(k)',header=TRUE)
a<-table.element(a,'T-STAT',header=TRUE)
a<-table.element(a,'P-value',header=TRUE)
a<-table.row.end(a)
for (i in 1:par1) {
a<-table.row.start(a)
a<-table.element(a,i,header=TRUE)
a<-table.element(a,round(mypacf[i],6))
mytstat <- mypacf[i]*sqrtn
a<-table.element(a,round(mytstat,4))
a<-table.element(a,round(1-pt(abs(mytstat),lengthx),6))
a<-table.row.end(a)
}
a<-table.end(a)
table.save(a,file='mytable1.tab')