Free Statistics

of Irreproducible Research!

Author's title

Author*The author of this computation has been verified*
R Software Modulerwasp_arimabackwardselection.wasp
Title produced by softwareARIMA Backward Selection
Date of computationFri, 09 Dec 2016 09:54:02 +0100
Cite this page as followsStatistical Computations at FreeStatistics.org, Office for Research Development and Education, URL https://freestatistics.org/blog/index.php?v=date/2016/Dec/09/t1481274412ocjtdmj3b6oj5xz.htm/, Retrieved Fri, 17 May 2024 17:13:52 +0000
Statistical Computations at FreeStatistics.org, Office for Research Development and Education, URL https://freestatistics.org/blog/index.php?pk=298452, Retrieved Fri, 17 May 2024 17:13:52 +0000
QR Codes:

Original text written by user:
IsPrivate?No (this computation is public)
User-defined keywords
Estimated Impact121
Family? (F = Feedback message, R = changed R code, M = changed R Module, P = changed Parameters, D = changed Data)
-       [ARIMA Backward Selection] [ARIMA Backward se...] [2016-12-09 08:54:02] [c0b73e623858a81821526bb2f691ccd9] [Current]
- RMP     [ARIMA Forecasting] [Arima forecasting...] [2016-12-09 09:09:19] [5ad8e5538a25411d3c3b0ec85050bd51]
Feedback Forum

Post a new message
Dataseries X:
3300
4100
3550
3650
3400
4050
2950
3300
3950
3950
3900
3700
3850
4350
4350
3550
3800
4150
3500
3850
4250
4150
4200
4100
4200
4350
4150
4200
3850
4100
3800
4250
4400
4400
4450
4050
4100
4450
4600
4100
4300
4850
3800
4450
4800
4900
4900
4350
4500
5050
5150
4450
4900
5450
4100
5050
5550
5450
5500
4950
5400
5750
5950
5950
5750
6450
5000
5950
6250
6300
6400
5700
5750
6450
6500
5950
6200
6750
5300
6450
6900
6800
6750
6050
6100
7400
7300
6200
6550
7500
5400
6750
7400
7450
7200
6500
7150
8000
7000
7600
7100
8050
5700
7550
7800
7800
8250
7150
7350
7800
8250
7500
8150
8550


Summary of computational transaction
Raw Input view raw input (R code)
Raw Outputview raw output of R engine
Computing time9 seconds
R ServerBig Analytics Cloud Computing Center

\begin{tabular}{lllllllll}
\hline
Summary of computational transaction \tabularnewline
Raw Input view raw input (R code)  \tabularnewline
Raw Outputview raw output of R engine  \tabularnewline
Computing time9 seconds \tabularnewline
R ServerBig Analytics Cloud Computing Center \tabularnewline
\hline
\end{tabular}
%Source: https://freestatistics.org/blog/index.php?pk=298452&T=0

[TABLE]
[ROW]
Summary of computational transaction[/C][/ROW] [ROW]Raw Input[/C] view raw input (R code) [/C][/ROW] [ROW]Raw Output[/C]view raw output of R engine [/C][/ROW] [ROW]Computing time[/C]9 seconds[/C][/ROW] [ROW]R Server[/C]Big Analytics Cloud Computing Center[/C][/ROW] [/TABLE] Source: https://freestatistics.org/blog/index.php?pk=298452&T=0

Globally Unique Identifier (entire table): ba.freestatistics.org/blog/index.php?pk=298452&T=0

As an alternative you can also use a QR Code:  

The GUIDs for individual cells are displayed in the table below:

Summary of computational transaction
Raw Input view raw input (R code)
Raw Outputview raw output of R engine
Computing time9 seconds
R ServerBig Analytics Cloud Computing Center


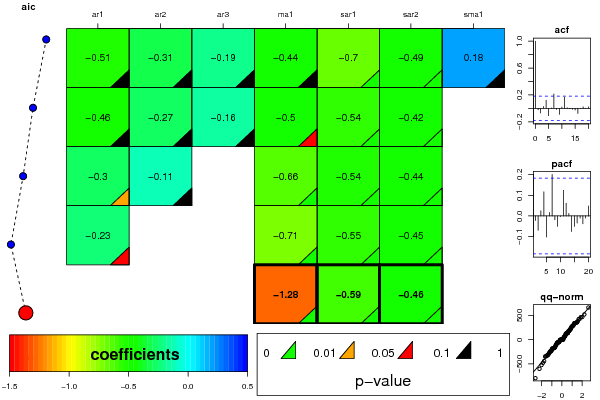
ARIMA Parameter Estimation and Backward Selection
Iterationar1ar2ar3ma1sar1sar2sma1
Estimates ( 1 )-0.507-0.3085-0.1867-0.4364-0.697-0.4880.1829
(p-val)(0.2333 )(0.3979 )(0.4242 )(0.3267 )(0.0013 )(2e-04 )(0.4267 )
Estimates ( 2 )-0.4631-0.2717-0.1596-0.4969-0.5423-0.42180
(p-val)(0.1195 )(0.3046 )(0.3779 )(0.093 )(0 )(3e-04 )(NA )
Estimates ( 3 )-0.2973-0.11040-0.6587-0.5374-0.43570
(p-val)(0.0431 )(0.405 )(NA )(0 )(0 )(1e-04 )(NA )
Estimates ( 4 )-0.226200-0.7116-0.5508-0.45420
(p-val)(0.0519 )(NA )(NA )(0 )(0 )(0 )(NA )
Estimates ( 5 )000-1.2822-0.5853-0.45550
(p-val)(NA )(NA )(NA )(0 )(0 )(0 )(NA )
Estimates ( 6 )NANANANANANANA
(p-val)(NA )(NA )(NA )(NA )(NA )(NA )(NA )
Estimates ( 7 )NANANANANANANA
(p-val)(NA )(NA )(NA )(NA )(NA )(NA )(NA )
Estimates ( 8 )NANANANANANANA
(p-val)(NA )(NA )(NA )(NA )(NA )(NA )(NA )
Estimates ( 9 )NANANANANANANA
(p-val)(NA )(NA )(NA )(NA )(NA )(NA )(NA )
Estimates ( 10 )NANANANANANANA
(p-val)(NA )(NA )(NA )(NA )(NA )(NA )(NA )
Estimates ( 11 )NANANANANANANA
(p-val)(NA )(NA )(NA )(NA )(NA )(NA )(NA )
Estimates ( 12 )NANANANANANANA
(p-val)(NA )(NA )(NA )(NA )(NA )(NA )(NA )
Estimates ( 13 )NANANANANANANA
(p-val)(NA )(NA )(NA )(NA )(NA )(NA )(NA )

\begin{tabular}{lllllllll}
\hline
ARIMA Parameter Estimation and Backward Selection \tabularnewline
Iteration & ar1 & ar2 & ar3 & ma1 & sar1 & sar2 & sma1 \tabularnewline
Estimates ( 1 ) & -0.507 & -0.3085 & -0.1867 & -0.4364 & -0.697 & -0.488 & 0.1829 \tabularnewline
(p-val) & (0.2333 ) & (0.3979 ) & (0.4242 ) & (0.3267 ) & (0.0013 ) & (2e-04 ) & (0.4267 ) \tabularnewline
Estimates ( 2 ) & -0.4631 & -0.2717 & -0.1596 & -0.4969 & -0.5423 & -0.4218 & 0 \tabularnewline
(p-val) & (0.1195 ) & (0.3046 ) & (0.3779 ) & (0.093 ) & (0 ) & (3e-04 ) & (NA ) \tabularnewline
Estimates ( 3 ) & -0.2973 & -0.1104 & 0 & -0.6587 & -0.5374 & -0.4357 & 0 \tabularnewline
(p-val) & (0.0431 ) & (0.405 ) & (NA ) & (0 ) & (0 ) & (1e-04 ) & (NA ) \tabularnewline
Estimates ( 4 ) & -0.2262 & 0 & 0 & -0.7116 & -0.5508 & -0.4542 & 0 \tabularnewline
(p-val) & (0.0519 ) & (NA ) & (NA ) & (0 ) & (0 ) & (0 ) & (NA ) \tabularnewline
Estimates ( 5 ) & 0 & 0 & 0 & -1.2822 & -0.5853 & -0.4555 & 0 \tabularnewline
(p-val) & (NA ) & (NA ) & (NA ) & (0 ) & (0 ) & (0 ) & (NA ) \tabularnewline
Estimates ( 6 ) & NA & NA & NA & NA & NA & NA & NA \tabularnewline
(p-val) & (NA ) & (NA ) & (NA ) & (NA ) & (NA ) & (NA ) & (NA ) \tabularnewline
Estimates ( 7 ) & NA & NA & NA & NA & NA & NA & NA \tabularnewline
(p-val) & (NA ) & (NA ) & (NA ) & (NA ) & (NA ) & (NA ) & (NA ) \tabularnewline
Estimates ( 8 ) & NA & NA & NA & NA & NA & NA & NA \tabularnewline
(p-val) & (NA ) & (NA ) & (NA ) & (NA ) & (NA ) & (NA ) & (NA ) \tabularnewline
Estimates ( 9 ) & NA & NA & NA & NA & NA & NA & NA \tabularnewline
(p-val) & (NA ) & (NA ) & (NA ) & (NA ) & (NA ) & (NA ) & (NA ) \tabularnewline
Estimates ( 10 ) & NA & NA & NA & NA & NA & NA & NA \tabularnewline
(p-val) & (NA ) & (NA ) & (NA ) & (NA ) & (NA ) & (NA ) & (NA ) \tabularnewline
Estimates ( 11 ) & NA & NA & NA & NA & NA & NA & NA \tabularnewline
(p-val) & (NA ) & (NA ) & (NA ) & (NA ) & (NA ) & (NA ) & (NA ) \tabularnewline
Estimates ( 12 ) & NA & NA & NA & NA & NA & NA & NA \tabularnewline
(p-val) & (NA ) & (NA ) & (NA ) & (NA ) & (NA ) & (NA ) & (NA ) \tabularnewline
Estimates ( 13 ) & NA & NA & NA & NA & NA & NA & NA \tabularnewline
(p-val) & (NA ) & (NA ) & (NA ) & (NA ) & (NA ) & (NA ) & (NA ) \tabularnewline
\hline
\end{tabular}
%Source: https://freestatistics.org/blog/index.php?pk=298452&T=1

[TABLE]
[ROW][C]ARIMA Parameter Estimation and Backward Selection[/C][/ROW]
[ROW][C]Iteration[/C][C]ar1[/C][C]ar2[/C][C]ar3[/C][C]ma1[/C][C]sar1[/C][C]sar2[/C][C]sma1[/C][/ROW]
[ROW][C]Estimates ( 1 )[/C][C]-0.507[/C][C]-0.3085[/C][C]-0.1867[/C][C]-0.4364[/C][C]-0.697[/C][C]-0.488[/C][C]0.1829[/C][/ROW]
[ROW][C](p-val)[/C][C](0.2333 )[/C][C](0.3979 )[/C][C](0.4242 )[/C][C](0.3267 )[/C][C](0.0013 )[/C][C](2e-04 )[/C][C](0.4267 )[/C][/ROW]
[ROW][C]Estimates ( 2 )[/C][C]-0.4631[/C][C]-0.2717[/C][C]-0.1596[/C][C]-0.4969[/C][C]-0.5423[/C][C]-0.4218[/C][C]0[/C][/ROW]
[ROW][C](p-val)[/C][C](0.1195 )[/C][C](0.3046 )[/C][C](0.3779 )[/C][C](0.093 )[/C][C](0 )[/C][C](3e-04 )[/C][C](NA )[/C][/ROW]
[ROW][C]Estimates ( 3 )[/C][C]-0.2973[/C][C]-0.1104[/C][C]0[/C][C]-0.6587[/C][C]-0.5374[/C][C]-0.4357[/C][C]0[/C][/ROW]
[ROW][C](p-val)[/C][C](0.0431 )[/C][C](0.405 )[/C][C](NA )[/C][C](0 )[/C][C](0 )[/C][C](1e-04 )[/C][C](NA )[/C][/ROW]
[ROW][C]Estimates ( 4 )[/C][C]-0.2262[/C][C]0[/C][C]0[/C][C]-0.7116[/C][C]-0.5508[/C][C]-0.4542[/C][C]0[/C][/ROW]
[ROW][C](p-val)[/C][C](0.0519 )[/C][C](NA )[/C][C](NA )[/C][C](0 )[/C][C](0 )[/C][C](0 )[/C][C](NA )[/C][/ROW]
[ROW][C]Estimates ( 5 )[/C][C]0[/C][C]0[/C][C]0[/C][C]-1.2822[/C][C]-0.5853[/C][C]-0.4555[/C][C]0[/C][/ROW]
[ROW][C](p-val)[/C][C](NA )[/C][C](NA )[/C][C](NA )[/C][C](0 )[/C][C](0 )[/C][C](0 )[/C][C](NA )[/C][/ROW]
[ROW][C]Estimates ( 6 )[/C][C]NA[/C][C]NA[/C][C]NA[/C][C]NA[/C][C]NA[/C][C]NA[/C][C]NA[/C][/ROW]
[ROW][C](p-val)[/C][C](NA )[/C][C](NA )[/C][C](NA )[/C][C](NA )[/C][C](NA )[/C][C](NA )[/C][C](NA )[/C][/ROW]
[ROW][C]Estimates ( 7 )[/C][C]NA[/C][C]NA[/C][C]NA[/C][C]NA[/C][C]NA[/C][C]NA[/C][C]NA[/C][/ROW]
[ROW][C](p-val)[/C][C](NA )[/C][C](NA )[/C][C](NA )[/C][C](NA )[/C][C](NA )[/C][C](NA )[/C][C](NA )[/C][/ROW]
[ROW][C]Estimates ( 8 )[/C][C]NA[/C][C]NA[/C][C]NA[/C][C]NA[/C][C]NA[/C][C]NA[/C][C]NA[/C][/ROW]
[ROW][C](p-val)[/C][C](NA )[/C][C](NA )[/C][C](NA )[/C][C](NA )[/C][C](NA )[/C][C](NA )[/C][C](NA )[/C][/ROW]
[ROW][C]Estimates ( 9 )[/C][C]NA[/C][C]NA[/C][C]NA[/C][C]NA[/C][C]NA[/C][C]NA[/C][C]NA[/C][/ROW]
[ROW][C](p-val)[/C][C](NA )[/C][C](NA )[/C][C](NA )[/C][C](NA )[/C][C](NA )[/C][C](NA )[/C][C](NA )[/C][/ROW]
[ROW][C]Estimates ( 10 )[/C][C]NA[/C][C]NA[/C][C]NA[/C][C]NA[/C][C]NA[/C][C]NA[/C][C]NA[/C][/ROW]
[ROW][C](p-val)[/C][C](NA )[/C][C](NA )[/C][C](NA )[/C][C](NA )[/C][C](NA )[/C][C](NA )[/C][C](NA )[/C][/ROW]
[ROW][C]Estimates ( 11 )[/C][C]NA[/C][C]NA[/C][C]NA[/C][C]NA[/C][C]NA[/C][C]NA[/C][C]NA[/C][/ROW]
[ROW][C](p-val)[/C][C](NA )[/C][C](NA )[/C][C](NA )[/C][C](NA )[/C][C](NA )[/C][C](NA )[/C][C](NA )[/C][/ROW]
[ROW][C]Estimates ( 12 )[/C][C]NA[/C][C]NA[/C][C]NA[/C][C]NA[/C][C]NA[/C][C]NA[/C][C]NA[/C][/ROW]
[ROW][C](p-val)[/C][C](NA )[/C][C](NA )[/C][C](NA )[/C][C](NA )[/C][C](NA )[/C][C](NA )[/C][C](NA )[/C][/ROW]
[ROW][C]Estimates ( 13 )[/C][C]NA[/C][C]NA[/C][C]NA[/C][C]NA[/C][C]NA[/C][C]NA[/C][C]NA[/C][/ROW]
[ROW][C](p-val)[/C][C](NA )[/C][C](NA )[/C][C](NA )[/C][C](NA )[/C][C](NA )[/C][C](NA )[/C][C](NA )[/C][/ROW]
[/TABLE]
Source: https://freestatistics.org/blog/index.php?pk=298452&T=1

Globally Unique Identifier (entire table): ba.freestatistics.org/blog/index.php?pk=298452&T=1

As an alternative you can also use a QR Code:  

The GUIDs for individual cells are displayed in the table below:

ARIMA Parameter Estimation and Backward Selection
Iterationar1ar2ar3ma1sar1sar2sma1
Estimates ( 1 )-0.507-0.3085-0.1867-0.4364-0.697-0.4880.1829
(p-val)(0.2333 )(0.3979 )(0.4242 )(0.3267 )(0.0013 )(2e-04 )(0.4267 )
Estimates ( 2 )-0.4631-0.2717-0.1596-0.4969-0.5423-0.42180
(p-val)(0.1195 )(0.3046 )(0.3779 )(0.093 )(0 )(3e-04 )(NA )
Estimates ( 3 )-0.2973-0.11040-0.6587-0.5374-0.43570
(p-val)(0.0431 )(0.405 )(NA )(0 )(0 )(1e-04 )(NA )
Estimates ( 4 )-0.226200-0.7116-0.5508-0.45420
(p-val)(0.0519 )(NA )(NA )(0 )(0 )(0 )(NA )
Estimates ( 5 )000-1.2822-0.5853-0.45550
(p-val)(NA )(NA )(NA )(0 )(0 )(0 )(NA )
Estimates ( 6 )NANANANANANANA
(p-val)(NA )(NA )(NA )(NA )(NA )(NA )(NA )
Estimates ( 7 )NANANANANANANA
(p-val)(NA )(NA )(NA )(NA )(NA )(NA )(NA )
Estimates ( 8 )NANANANANANANA
(p-val)(NA )(NA )(NA )(NA )(NA )(NA )(NA )
Estimates ( 9 )NANANANANANANA
(p-val)(NA )(NA )(NA )(NA )(NA )(NA )(NA )
Estimates ( 10 )NANANANANANANA
(p-val)(NA )(NA )(NA )(NA )(NA )(NA )(NA )
Estimates ( 11 )NANANANANANANA
(p-val)(NA )(NA )(NA )(NA )(NA )(NA )(NA )
Estimates ( 12 )NANANANANANANA
(p-val)(NA )(NA )(NA )(NA )(NA )(NA )(NA )
Estimates ( 13 )NANANANANANANA
(p-val)(NA )(NA )(NA )(NA )(NA )(NA )(NA )


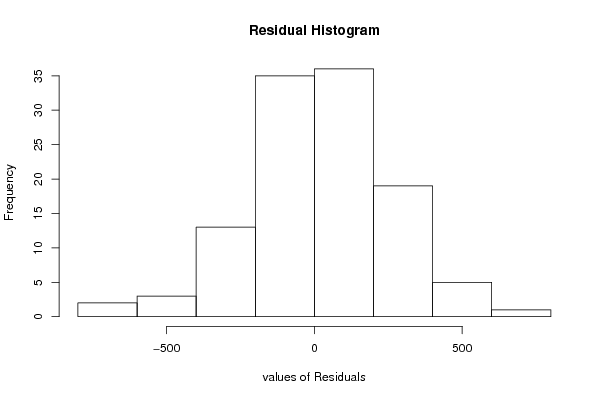
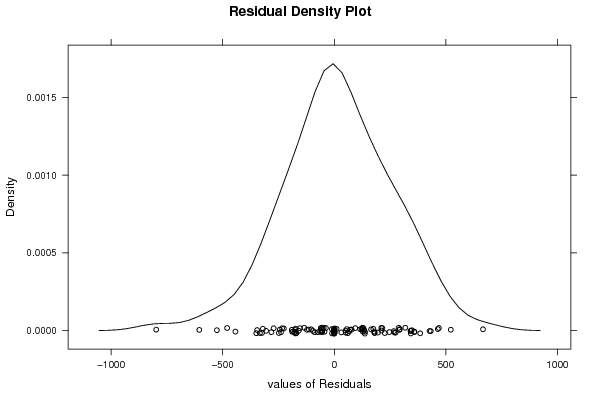
Estimated ARIMA Residuals
Value
-10.5998637483431
-178.230222064585
274.548660168324
-442.853655221557
-54.9350784915886
-190.24856038253
180.195342118384
210.847403655275
-56.2740026579381
-169.596235111357
-53.9094306068918
50.1639977314867
71.2007472135153
-349.381823826735
-323.778637109442
226.369437189163
-102.850884565533
-345.446826737545
175.041071456984
318.223332793203
-60.2679329092159
-58.2231496659149
10.3201328654867
-243.74696171572
-184.141318030605
-238.558418500308
291.685930490644
-174.484158234249
211.662127556905
358.830161794889
-73.3938003245156
123.028779278211
93.9246980597574
164.860925221715
137.517343091114
-172.980862319744
-134.367377395186
66.8106305203166
133.66155340591
-9.97451757552163
246.865291092819
358.905211538158
-271.587290683896
136.974122736279
347.118298194899
180.678413172445
128.533676955535
-122.328392385635
195.805115712352
215.513206268143
385.02923506421
666.378850798569
288.637917088556
432.298363164794
-233.500475359138
-47.1390100727836
-2.16969132832845
77.721447082923
129.423430012096
-113.628359660427
-319.550435382578
60.4582328715259
0.186752415123845
-281.783890365496
-52.7166342692918
-58.4068819980618
-248.146450641449
116.395570091173
266.868891392718
56.1088157599222
-95.6108426826729
-173.216675848904
-225.994037701932
522.089186509181
343.109661604384
-333.139274793154
-305.472408463979
180.030178979218
-480.107061873834
-188.803394288822
127.563284999749
269.672389086058
-37.3424187893643
-153.492401505724
293.673039155134
343.036711628481
-797.709494300611
341.921068240355
-87.7108351213564
-43.8137926055306
-604.755526575903
133.109248828258
31.5638976303017
-63.2043271171769
468.703449911253
51.550971203038
-173.331106380528
-525.702117638649
427.182830727157
-159.083151620278
463.986145313391
126.373553640241

\begin{tabular}{lllllllll}
\hline
Estimated ARIMA Residuals \tabularnewline
Value \tabularnewline
-10.5998637483431 \tabularnewline
-178.230222064585 \tabularnewline
274.548660168324 \tabularnewline
-442.853655221557 \tabularnewline
-54.9350784915886 \tabularnewline
-190.24856038253 \tabularnewline
180.195342118384 \tabularnewline
210.847403655275 \tabularnewline
-56.2740026579381 \tabularnewline
-169.596235111357 \tabularnewline
-53.9094306068918 \tabularnewline
50.1639977314867 \tabularnewline
71.2007472135153 \tabularnewline
-349.381823826735 \tabularnewline
-323.778637109442 \tabularnewline
226.369437189163 \tabularnewline
-102.850884565533 \tabularnewline
-345.446826737545 \tabularnewline
175.041071456984 \tabularnewline
318.223332793203 \tabularnewline
-60.2679329092159 \tabularnewline
-58.2231496659149 \tabularnewline
10.3201328654867 \tabularnewline
-243.74696171572 \tabularnewline
-184.141318030605 \tabularnewline
-238.558418500308 \tabularnewline
291.685930490644 \tabularnewline
-174.484158234249 \tabularnewline
211.662127556905 \tabularnewline
358.830161794889 \tabularnewline
-73.3938003245156 \tabularnewline
123.028779278211 \tabularnewline
93.9246980597574 \tabularnewline
164.860925221715 \tabularnewline
137.517343091114 \tabularnewline
-172.980862319744 \tabularnewline
-134.367377395186 \tabularnewline
66.8106305203166 \tabularnewline
133.66155340591 \tabularnewline
-9.97451757552163 \tabularnewline
246.865291092819 \tabularnewline
358.905211538158 \tabularnewline
-271.587290683896 \tabularnewline
136.974122736279 \tabularnewline
347.118298194899 \tabularnewline
180.678413172445 \tabularnewline
128.533676955535 \tabularnewline
-122.328392385635 \tabularnewline
195.805115712352 \tabularnewline
215.513206268143 \tabularnewline
385.02923506421 \tabularnewline
666.378850798569 \tabularnewline
288.637917088556 \tabularnewline
432.298363164794 \tabularnewline
-233.500475359138 \tabularnewline
-47.1390100727836 \tabularnewline
-2.16969132832845 \tabularnewline
77.721447082923 \tabularnewline
129.423430012096 \tabularnewline
-113.628359660427 \tabularnewline
-319.550435382578 \tabularnewline
60.4582328715259 \tabularnewline
0.186752415123845 \tabularnewline
-281.783890365496 \tabularnewline
-52.7166342692918 \tabularnewline
-58.4068819980618 \tabularnewline
-248.146450641449 \tabularnewline
116.395570091173 \tabularnewline
266.868891392718 \tabularnewline
56.1088157599222 \tabularnewline
-95.6108426826729 \tabularnewline
-173.216675848904 \tabularnewline
-225.994037701932 \tabularnewline
522.089186509181 \tabularnewline
343.109661604384 \tabularnewline
-333.139274793154 \tabularnewline
-305.472408463979 \tabularnewline
180.030178979218 \tabularnewline
-480.107061873834 \tabularnewline
-188.803394288822 \tabularnewline
127.563284999749 \tabularnewline
269.672389086058 \tabularnewline
-37.3424187893643 \tabularnewline
-153.492401505724 \tabularnewline
293.673039155134 \tabularnewline
343.036711628481 \tabularnewline
-797.709494300611 \tabularnewline
341.921068240355 \tabularnewline
-87.7108351213564 \tabularnewline
-43.8137926055306 \tabularnewline
-604.755526575903 \tabularnewline
133.109248828258 \tabularnewline
31.5638976303017 \tabularnewline
-63.2043271171769 \tabularnewline
468.703449911253 \tabularnewline
51.550971203038 \tabularnewline
-173.331106380528 \tabularnewline
-525.702117638649 \tabularnewline
427.182830727157 \tabularnewline
-159.083151620278 \tabularnewline
463.986145313391 \tabularnewline
126.373553640241 \tabularnewline
\hline
\end{tabular}
%Source: https://freestatistics.org/blog/index.php?pk=298452&T=2

[TABLE]
[ROW][C]Estimated ARIMA Residuals[/C][/ROW]
[ROW][C]Value[/C][/ROW]
[ROW][C]-10.5998637483431[/C][/ROW]
[ROW][C]-178.230222064585[/C][/ROW]
[ROW][C]274.548660168324[/C][/ROW]
[ROW][C]-442.853655221557[/C][/ROW]
[ROW][C]-54.9350784915886[/C][/ROW]
[ROW][C]-190.24856038253[/C][/ROW]
[ROW][C]180.195342118384[/C][/ROW]
[ROW][C]210.847403655275[/C][/ROW]
[ROW][C]-56.2740026579381[/C][/ROW]
[ROW][C]-169.596235111357[/C][/ROW]
[ROW][C]-53.9094306068918[/C][/ROW]
[ROW][C]50.1639977314867[/C][/ROW]
[ROW][C]71.2007472135153[/C][/ROW]
[ROW][C]-349.381823826735[/C][/ROW]
[ROW][C]-323.778637109442[/C][/ROW]
[ROW][C]226.369437189163[/C][/ROW]
[ROW][C]-102.850884565533[/C][/ROW]
[ROW][C]-345.446826737545[/C][/ROW]
[ROW][C]175.041071456984[/C][/ROW]
[ROW][C]318.223332793203[/C][/ROW]
[ROW][C]-60.2679329092159[/C][/ROW]
[ROW][C]-58.2231496659149[/C][/ROW]
[ROW][C]10.3201328654867[/C][/ROW]
[ROW][C]-243.74696171572[/C][/ROW]
[ROW][C]-184.141318030605[/C][/ROW]
[ROW][C]-238.558418500308[/C][/ROW]
[ROW][C]291.685930490644[/C][/ROW]
[ROW][C]-174.484158234249[/C][/ROW]
[ROW][C]211.662127556905[/C][/ROW]
[ROW][C]358.830161794889[/C][/ROW]
[ROW][C]-73.3938003245156[/C][/ROW]
[ROW][C]123.028779278211[/C][/ROW]
[ROW][C]93.9246980597574[/C][/ROW]
[ROW][C]164.860925221715[/C][/ROW]
[ROW][C]137.517343091114[/C][/ROW]
[ROW][C]-172.980862319744[/C][/ROW]
[ROW][C]-134.367377395186[/C][/ROW]
[ROW][C]66.8106305203166[/C][/ROW]
[ROW][C]133.66155340591[/C][/ROW]
[ROW][C]-9.97451757552163[/C][/ROW]
[ROW][C]246.865291092819[/C][/ROW]
[ROW][C]358.905211538158[/C][/ROW]
[ROW][C]-271.587290683896[/C][/ROW]
[ROW][C]136.974122736279[/C][/ROW]
[ROW][C]347.118298194899[/C][/ROW]
[ROW][C]180.678413172445[/C][/ROW]
[ROW][C]128.533676955535[/C][/ROW]
[ROW][C]-122.328392385635[/C][/ROW]
[ROW][C]195.805115712352[/C][/ROW]
[ROW][C]215.513206268143[/C][/ROW]
[ROW][C]385.02923506421[/C][/ROW]
[ROW][C]666.378850798569[/C][/ROW]
[ROW][C]288.637917088556[/C][/ROW]
[ROW][C]432.298363164794[/C][/ROW]
[ROW][C]-233.500475359138[/C][/ROW]
[ROW][C]-47.1390100727836[/C][/ROW]
[ROW][C]-2.16969132832845[/C][/ROW]
[ROW][C]77.721447082923[/C][/ROW]
[ROW][C]129.423430012096[/C][/ROW]
[ROW][C]-113.628359660427[/C][/ROW]
[ROW][C]-319.550435382578[/C][/ROW]
[ROW][C]60.4582328715259[/C][/ROW]
[ROW][C]0.186752415123845[/C][/ROW]
[ROW][C]-281.783890365496[/C][/ROW]
[ROW][C]-52.7166342692918[/C][/ROW]
[ROW][C]-58.4068819980618[/C][/ROW]
[ROW][C]-248.146450641449[/C][/ROW]
[ROW][C]116.395570091173[/C][/ROW]
[ROW][C]266.868891392718[/C][/ROW]
[ROW][C]56.1088157599222[/C][/ROW]
[ROW][C]-95.6108426826729[/C][/ROW]
[ROW][C]-173.216675848904[/C][/ROW]
[ROW][C]-225.994037701932[/C][/ROW]
[ROW][C]522.089186509181[/C][/ROW]
[ROW][C]343.109661604384[/C][/ROW]
[ROW][C]-333.139274793154[/C][/ROW]
[ROW][C]-305.472408463979[/C][/ROW]
[ROW][C]180.030178979218[/C][/ROW]
[ROW][C]-480.107061873834[/C][/ROW]
[ROW][C]-188.803394288822[/C][/ROW]
[ROW][C]127.563284999749[/C][/ROW]
[ROW][C]269.672389086058[/C][/ROW]
[ROW][C]-37.3424187893643[/C][/ROW]
[ROW][C]-153.492401505724[/C][/ROW]
[ROW][C]293.673039155134[/C][/ROW]
[ROW][C]343.036711628481[/C][/ROW]
[ROW][C]-797.709494300611[/C][/ROW]
[ROW][C]341.921068240355[/C][/ROW]
[ROW][C]-87.7108351213564[/C][/ROW]
[ROW][C]-43.8137926055306[/C][/ROW]
[ROW][C]-604.755526575903[/C][/ROW]
[ROW][C]133.109248828258[/C][/ROW]
[ROW][C]31.5638976303017[/C][/ROW]
[ROW][C]-63.2043271171769[/C][/ROW]
[ROW][C]468.703449911253[/C][/ROW]
[ROW][C]51.550971203038[/C][/ROW]
[ROW][C]-173.331106380528[/C][/ROW]
[ROW][C]-525.702117638649[/C][/ROW]
[ROW][C]427.182830727157[/C][/ROW]
[ROW][C]-159.083151620278[/C][/ROW]
[ROW][C]463.986145313391[/C][/ROW]
[ROW][C]126.373553640241[/C][/ROW]
[/TABLE]
Source: https://freestatistics.org/blog/index.php?pk=298452&T=2

Globally Unique Identifier (entire table): ba.freestatistics.org/blog/index.php?pk=298452&T=2

As an alternative you can also use a QR Code:  

The GUIDs for individual cells are displayed in the table below:

Estimated ARIMA Residuals
Value
-10.5998637483431
-178.230222064585
274.548660168324
-442.853655221557
-54.9350784915886
-190.24856038253
180.195342118384
210.847403655275
-56.2740026579381
-169.596235111357
-53.9094306068918
50.1639977314867
71.2007472135153
-349.381823826735
-323.778637109442
226.369437189163
-102.850884565533
-345.446826737545
175.041071456984
318.223332793203
-60.2679329092159
-58.2231496659149
10.3201328654867
-243.74696171572
-184.141318030605
-238.558418500308
291.685930490644
-174.484158234249
211.662127556905
358.830161794889
-73.3938003245156
123.028779278211
93.9246980597574
164.860925221715
137.517343091114
-172.980862319744
-134.367377395186
66.8106305203166
133.66155340591
-9.97451757552163
246.865291092819
358.905211538158
-271.587290683896
136.974122736279
347.118298194899
180.678413172445
128.533676955535
-122.328392385635
195.805115712352
215.513206268143
385.02923506421
666.378850798569
288.637917088556
432.298363164794
-233.500475359138
-47.1390100727836
-2.16969132832845
77.721447082923
129.423430012096
-113.628359660427
-319.550435382578
60.4582328715259
0.186752415123845
-281.783890365496
-52.7166342692918
-58.4068819980618
-248.146450641449
116.395570091173
266.868891392718
56.1088157599222
-95.6108426826729
-173.216675848904
-225.994037701932
522.089186509181
343.109661604384
-333.139274793154
-305.472408463979
180.030178979218
-480.107061873834
-188.803394288822
127.563284999749
269.672389086058
-37.3424187893643
-153.492401505724
293.673039155134
343.036711628481
-797.709494300611
341.921068240355
-87.7108351213564
-43.8137926055306
-604.755526575903
133.109248828258
31.5638976303017
-63.2043271171769
468.703449911253
51.550971203038
-173.331106380528
-525.702117638649
427.182830727157
-159.083151620278
463.986145313391
126.373553640241


Parameters (Session):
par1 = FALSE ; par2 = 1 ; par3 = 1 ; par4 = 1 ; par5 = 12 ; par6 = 3 ; par7 = 1 ; par8 = 2 ; par9 = 1 ;
Parameters (R input):
par1 = FALSE ; par2 = 1 ; par3 = 1 ; par4 = 1 ; par5 = 12 ; par6 = 3 ; par7 = 1 ; par8 = 2 ; par9 = 1 ;
R code (references can be found in the software module):
library(lattice)
if (par1 == 'TRUE') par1 <- TRUE
if (par1 == 'FALSE') par1 <- FALSE
par2 <- as.numeric(par2) #Box-Cox lambda transformation parameter
par3 <- as.numeric(par3) #degree of non-seasonal differencing
par4 <- as.numeric(par4) #degree of seasonal differencing
par5 <- as.numeric(par5) #seasonal period
par6 <- as.numeric(par6) #degree (p) of the non-seasonal AR(p) polynomial
par7 <- as.numeric(par7) #degree (q) of the non-seasonal MA(q) polynomial
par8 <- as.numeric(par8) #degree (P) of the seasonal AR(P) polynomial
par9 <- as.numeric(par9) #degree (Q) of the seasonal MA(Q) polynomial
armaGR <- function(arima.out, names, n){
try1 <- arima.out$coef
try2 <- sqrt(diag(arima.out$var.coef))
try.data.frame <- data.frame(matrix(NA,ncol=4,nrow=length(names)))
dimnames(try.data.frame) <- list(names,c('coef','std','tstat','pv'))
try.data.frame[,1] <- try1
for(i in 1:length(try2)) try.data.frame[which(rownames(try.data.frame)==names(try2)[i]),2] <- try2[i]
try.data.frame[,3] <- try.data.frame[,1] / try.data.frame[,2]
try.data.frame[,4] <- round((1-pt(abs(try.data.frame[,3]),df=n-(length(try2)+1)))*2,5)
vector <- rep(NA,length(names))
vector[is.na(try.data.frame[,4])] <- 0
maxi <- which.max(try.data.frame[,4])
continue <- max(try.data.frame[,4],na.rm=TRUE) > .05
vector[maxi] <- 0
list(summary=try.data.frame,next.vector=vector,continue=continue)
}
arimaSelect <- function(series, order=c(13,0,0), seasonal=list(order=c(2,0,0),period=12), include.mean=F){
nrc <- order[1]+order[3]+seasonal$order[1]+seasonal$order[3]
coeff <- matrix(NA, nrow=nrc*2, ncol=nrc)
pval <- matrix(NA, nrow=nrc*2, ncol=nrc)
mylist <- rep(list(NULL), nrc)
names <- NULL
if(order[1] > 0) names <- paste('ar',1:order[1],sep='')
if(order[3] > 0) names <- c( names , paste('ma',1:order[3],sep='') )
if(seasonal$order[1] > 0) names <- c(names, paste('sar',1:seasonal$order[1],sep=''))
if(seasonal$order[3] > 0) names <- c(names, paste('sma',1:seasonal$order[3],sep=''))
arima.out <- arima(series, order=order, seasonal=seasonal, include.mean=include.mean, method='ML')
mylist[[1]] <- arima.out
last.arma <- armaGR(arima.out, names, length(series))
mystop <- FALSE
i <- 1
coeff[i,] <- last.arma[[1]][,1]
pval [i,] <- last.arma[[1]][,4]
i <- 2
aic <- arima.out$aic
while(!mystop){
mylist[[i]] <- arima.out
arima.out <- arima(series, order=order, seasonal=seasonal, include.mean=include.mean, method='ML', fixed=last.arma$next.vector)
aic <- c(aic, arima.out$aic)
last.arma <- armaGR(arima.out, names, length(series))
mystop <- !last.arma$continue
coeff[i,] <- last.arma[[1]][,1]
pval [i,] <- last.arma[[1]][,4]
i <- i+1
}
list(coeff, pval, mylist, aic=aic)
}
arimaSelectplot <- function(arimaSelect.out,noms,choix){
noms <- names(arimaSelect.out[[3]][[1]]$coef)
coeff <- arimaSelect.out[[1]]
k <- min(which(is.na(coeff[,1])))-1
coeff <- coeff[1:k,]
pval <- arimaSelect.out[[2]][1:k,]
aic <- arimaSelect.out$aic[1:k]
coeff[coeff==0] <- NA
n <- ncol(coeff)
if(missing(choix)) choix <- k
layout(matrix(c(1,1,1,2,
3,3,3,2,
3,3,3,4,
5,6,7,7),nr=4),
widths=c(10,35,45,15),
heights=c(30,30,15,15))
couleurs <- rainbow(75)[1:50]#(50)
ticks <- pretty(coeff)
par(mar=c(1,1,3,1))
plot(aic,k:1-.5,type='o',pch=21,bg='blue',cex=2,axes=F,lty=2,xpd=NA)
points(aic[choix],k-choix+.5,pch=21,cex=4,bg=2,xpd=NA)
title('aic',line=2)
par(mar=c(3,0,0,0))
plot(0,axes=F,xlab='',ylab='',xlim=range(ticks),ylim=c(.1,1))
rect(xleft = min(ticks) + (0:49)/50*(max(ticks)-min(ticks)),
xright = min(ticks) + (1:50)/50*(max(ticks)-min(ticks)),
ytop = rep(1,50),
ybottom= rep(0,50),col=couleurs,border=NA)
axis(1,ticks)
rect(xleft=min(ticks),xright=max(ticks),ytop=1,ybottom=0)
text(mean(coeff,na.rm=T),.5,'coefficients',cex=2,font=2)
par(mar=c(1,1,3,1))
image(1:n,1:k,t(coeff[k:1,]),axes=F,col=couleurs,zlim=range(ticks))
for(i in 1:n) for(j in 1:k) if(!is.na(coeff[j,i])) {
if(pval[j,i]<.01) symb = 'green'
else if( (pval[j,i]<.05) & (pval[j,i]>=.01)) symb = 'orange'
else if( (pval[j,i]<.1) & (pval[j,i]>=.05)) symb = 'red'
else symb = 'black'
polygon(c(i+.5 ,i+.2 ,i+.5 ,i+.5),
c(k-j+0.5,k-j+0.5,k-j+0.8,k-j+0.5),
col=symb)
if(j==choix) {
rect(xleft=i-.5,
xright=i+.5,
ybottom=k-j+1.5,
ytop=k-j+.5,
lwd=4)
text(i,
k-j+1,
round(coeff[j,i],2),
cex=1.2,
font=2)
}
else{
rect(xleft=i-.5,xright=i+.5,ybottom=k-j+1.5,ytop=k-j+.5)
text(i,k-j+1,round(coeff[j,i],2),cex=1.2,font=1)
}
}
axis(3,1:n,noms)
par(mar=c(0.5,0,0,0.5))
plot(0,axes=F,xlab='',ylab='',type='n',xlim=c(0,8),ylim=c(-.2,.8))
cols <- c('green','orange','red','black')
niv <- c('0','0.01','0.05','0.1')
for(i in 0:3){
polygon(c(1+2*i ,1+2*i ,1+2*i-.5 ,1+2*i),
c(.4 ,.7 , .4 , .4),
col=cols[i+1])
text(2*i,0.5,niv[i+1],cex=1.5)
}
text(8,.5,1,cex=1.5)
text(4,0,'p-value',cex=2)
box()
residus <- arimaSelect.out[[3]][[choix]]$res
par(mar=c(1,2,4,1))
acf(residus,main='')
title('acf',line=.5)
par(mar=c(1,2,4,1))
pacf(residus,main='')
title('pacf',line=.5)
par(mar=c(2,2,4,1))
qqnorm(residus,main='')
title('qq-norm',line=.5)
qqline(residus)
residus
}
if (par2 == 0) x <- log(x)
if (par2 != 0) x <- x^par2
(selection <- arimaSelect(x, order=c(par6,par3,par7), seasonal=list(order=c(par8,par4,par9), period=par5)))
bitmap(file='test1.png')
resid <- arimaSelectplot(selection)
dev.off()
resid
bitmap(file='test2.png')
acf(resid,length(resid)/2, main='Residual Autocorrelation Function')
dev.off()
bitmap(file='test3.png')
pacf(resid,length(resid)/2, main='Residual Partial Autocorrelation Function')
dev.off()
bitmap(file='test4.png')
cpgram(resid, main='Residual Cumulative Periodogram')
dev.off()
bitmap(file='test5.png')
hist(resid, main='Residual Histogram', xlab='values of Residuals')
dev.off()
bitmap(file='test6.png')
densityplot(~resid,col='black',main='Residual Density Plot', xlab='values of Residuals')
dev.off()
bitmap(file='test7.png')
qqnorm(resid, main='Residual Normal Q-Q Plot')
qqline(resid)
dev.off()
ncols <- length(selection[[1]][1,])
nrows <- length(selection[[2]][,1])-1
load(file='createtable')
a<-table.start()
a<-table.row.start(a)
a<-table.element(a,'ARIMA Parameter Estimation and Backward Selection', ncols+1,TRUE)
a<-table.row.end(a)
a<-table.row.start(a)
a<-table.element(a,'Iteration', header=TRUE)
for (i in 1:ncols) {
a<-table.element(a,names(selection[[3]][[1]]$coef)[i],header=TRUE)
}
a<-table.row.end(a)
for (j in 1:nrows) {
a<-table.row.start(a)
mydum <- 'Estimates ('
mydum <- paste(mydum,j)
mydum <- paste(mydum,')')
a<-table.element(a,mydum, header=TRUE)
for (i in 1:ncols) {
a<-table.element(a,round(selection[[1]][j,i],4))
}
a<-table.row.end(a)
a<-table.row.start(a)
a<-table.element(a,'(p-val)', header=TRUE)
for (i in 1:ncols) {
mydum <- '('
mydum <- paste(mydum,round(selection[[2]][j,i],4),sep='')
mydum <- paste(mydum,')')
a<-table.element(a,mydum)
}
a<-table.row.end(a)
}
a<-table.end(a)
table.save(a,file='mytable.tab')
a<-table.start()
a<-table.row.start(a)
a<-table.element(a,'Estimated ARIMA Residuals', 1,TRUE)
a<-table.row.end(a)
a<-table.row.start(a)
a<-table.element(a,'Value', 1,TRUE)
a<-table.row.end(a)
for (i in (par4*par5+par3):length(resid)) {
a<-table.row.start(a)
a<-table.element(a,resid[i])
a<-table.row.end(a)
}
a<-table.end(a)
table.save(a,file='mytable1.tab')