Free Statistics

of Irreproducible Research!

Author's title

Author*The author of this computation has been verified*
R Software Modulerwasp_autocorrelation.wasp
Title produced by software(Partial) Autocorrelation Function
Date of computationFri, 09 Dec 2016 08:57:15 +0100
Cite this page as followsStatistical Computations at FreeStatistics.org, Office for Research Development and Education, URL https://freestatistics.org/blog/index.php?v=date/2016/Dec/09/t14812703383h6sd4w71a09hcw.htm/, Retrieved Fri, 17 May 2024 16:26:30 +0000
Statistical Computations at FreeStatistics.org, Office for Research Development and Education, URL https://freestatistics.org/blog/index.php?pk=298428, Retrieved Fri, 17 May 2024 16:26:30 +0000
QR Codes:

Original text written by user:
IsPrivate?No (this computation is public)
User-defined keywords
Estimated Impact101
Family? (F = Feedback message, R = changed R code, M = changed R Module, P = changed Parameters, D = changed Data)
-       [(Partial) Autocorrelation Function] [ACF voorbeeld] [2016-12-09 07:57:15] [fc6d28d208bad0c833791fcb11cb4db1] [Current]
Feedback Forum

Post a new message
Dataseries X:
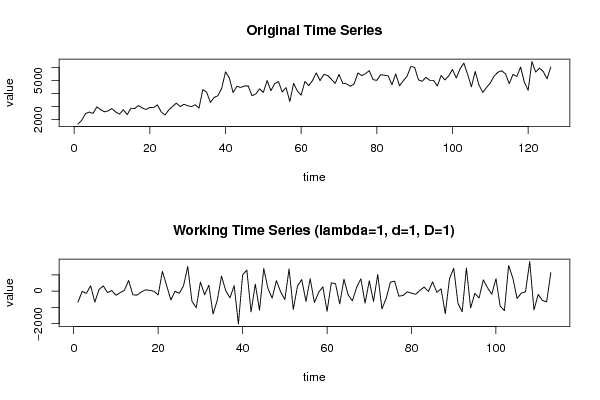
1660
1955
2460
2580
2480
2975
2755
2595
2670
2850
2575
2425
2760
2380
2865
2850
3075
2895
2775
2930
2915
3125
2595
2350
2735
3005
3260
3000
3170
3065
2990
3135
2880
4295
4110
3320
3695
3830
4405
5650
5195
4070
4545
4460
4565
4575
3830
3955
4360
4080
4985
4210
4745
4910
4110
4455
3380
4775
4185
3875
4920
4600
4985
5570
4985
5460
5370
5080
4765
5455
4780
4735
4545
4730
5565
5365
5505
5745
5060
4995
5435
5390
5345
4665
5495
4585
4975
5320
6065
5995
5040
4930
5240
5000
5000
4565
5375
5030
5345
5830
5185
5880
6320
5460
4505
5680
4645
4075
4460
4805
5325
5620
5730
5505
4750
5455
5300
6020
4860
4245
6440
5630
5945
5670
5120
6025


Summary of computational transaction
Raw Input view raw input (R code)
Raw Outputview raw output of R engine
Computing time2 seconds
R ServerBig Analytics Cloud Computing Center

\begin{tabular}{lllllllll}
\hline
Summary of computational transaction \tabularnewline
Raw Input view raw input (R code)  \tabularnewline
Raw Outputview raw output of R engine  \tabularnewline
Computing time2 seconds \tabularnewline
R ServerBig Analytics Cloud Computing Center \tabularnewline
\hline
\end{tabular}
%Source: https://freestatistics.org/blog/index.php?pk=298428&T=0

[TABLE]
[ROW]
Summary of computational transaction[/C][/ROW] [ROW]Raw Input[/C] view raw input (R code) [/C][/ROW] [ROW]Raw Output[/C]view raw output of R engine [/C][/ROW] [ROW]Computing time[/C]2 seconds[/C][/ROW] [ROW]R Server[/C]Big Analytics Cloud Computing Center[/C][/ROW] [/TABLE] Source: https://freestatistics.org/blog/index.php?pk=298428&T=0

Globally Unique Identifier (entire table): ba.freestatistics.org/blog/index.php?pk=298428&T=0

As an alternative you can also use a QR Code:  

The GUIDs for individual cells are displayed in the table below:

Summary of computational transaction
Raw Input view raw input (R code)
Raw Outputview raw output of R engine
Computing time2 seconds
R ServerBig Analytics Cloud Computing Center


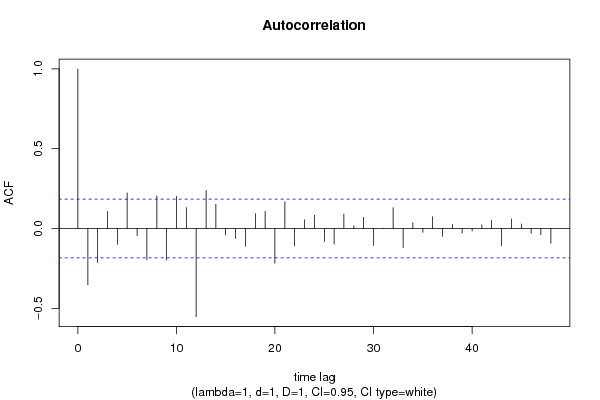
Autocorrelation Function
Time lag kACF(k)T-STATP-value
1-0.35205-3.74230.000144
2-0.212789-2.2620.012806
30.1068411.13570.129234
4-0.098376-1.04570.148955
50.222832.36870.009774
6-0.043986-0.46760.320492
7-0.196106-2.08460.019678
80.2035172.16340.016308
9-0.197198-2.09620.019146
100.2019682.1470.016967
110.1299131.3810.085003
12-0.55213-5.86920
130.2388092.53860.006246
140.1520461.61630.054412
15-0.040414-0.42960.334151
16-0.062199-0.66120.25492
17-0.111325-1.18340.119566
180.0933810.99270.161499
190.1076741.14460.127398
20-0.217478-2.31180.0113
210.1671151.77650.039174
22-0.109126-1.160.124241
230.0542950.57720.282489
240.0828770.8810.190096
25-0.081387-0.86520.194394
26-0.097147-1.03270.151978
270.0905160.96220.169001
280.0178350.18960.424987
290.07010.74520.228856
30-0.106597-1.13310.129776
310.0007280.00770.49692
320.1298851.38070.085048
33-0.118127-1.25570.105906
340.0358160.38070.35206
35-0.022981-0.24430.403725
360.0744460.79140.215193
37-0.048224-0.51260.304604
380.0248750.26440.395966
39-0.027446-0.29180.385504
40-0.015141-0.1610.436208
410.0236670.25160.400911
420.0502270.53390.297223
43-0.108272-1.15090.126092
440.0600080.63790.262417
450.0285310.30330.381115
46-0.029824-0.3170.375903
47-0.038224-0.40630.342637
48-0.09263-0.98470.163445

\begin{tabular}{lllllllll}
\hline
Autocorrelation Function \tabularnewline
Time lag k & ACF(k) & T-STAT & P-value \tabularnewline
1 & -0.35205 & -3.7423 & 0.000144 \tabularnewline
2 & -0.212789 & -2.262 & 0.012806 \tabularnewline
3 & 0.106841 & 1.1357 & 0.129234 \tabularnewline
4 & -0.098376 & -1.0457 & 0.148955 \tabularnewline
5 & 0.22283 & 2.3687 & 0.009774 \tabularnewline
6 & -0.043986 & -0.4676 & 0.320492 \tabularnewline
7 & -0.196106 & -2.0846 & 0.019678 \tabularnewline
8 & 0.203517 & 2.1634 & 0.016308 \tabularnewline
9 & -0.197198 & -2.0962 & 0.019146 \tabularnewline
10 & 0.201968 & 2.147 & 0.016967 \tabularnewline
11 & 0.129913 & 1.381 & 0.085003 \tabularnewline
12 & -0.55213 & -5.8692 & 0 \tabularnewline
13 & 0.238809 & 2.5386 & 0.006246 \tabularnewline
14 & 0.152046 & 1.6163 & 0.054412 \tabularnewline
15 & -0.040414 & -0.4296 & 0.334151 \tabularnewline
16 & -0.062199 & -0.6612 & 0.25492 \tabularnewline
17 & -0.111325 & -1.1834 & 0.119566 \tabularnewline
18 & 0.093381 & 0.9927 & 0.161499 \tabularnewline
19 & 0.107674 & 1.1446 & 0.127398 \tabularnewline
20 & -0.217478 & -2.3118 & 0.0113 \tabularnewline
21 & 0.167115 & 1.7765 & 0.039174 \tabularnewline
22 & -0.109126 & -1.16 & 0.124241 \tabularnewline
23 & 0.054295 & 0.5772 & 0.282489 \tabularnewline
24 & 0.082877 & 0.881 & 0.190096 \tabularnewline
25 & -0.081387 & -0.8652 & 0.194394 \tabularnewline
26 & -0.097147 & -1.0327 & 0.151978 \tabularnewline
27 & 0.090516 & 0.9622 & 0.169001 \tabularnewline
28 & 0.017835 & 0.1896 & 0.424987 \tabularnewline
29 & 0.0701 & 0.7452 & 0.228856 \tabularnewline
30 & -0.106597 & -1.1331 & 0.129776 \tabularnewline
31 & 0.000728 & 0.0077 & 0.49692 \tabularnewline
32 & 0.129885 & 1.3807 & 0.085048 \tabularnewline
33 & -0.118127 & -1.2557 & 0.105906 \tabularnewline
34 & 0.035816 & 0.3807 & 0.35206 \tabularnewline
35 & -0.022981 & -0.2443 & 0.403725 \tabularnewline
36 & 0.074446 & 0.7914 & 0.215193 \tabularnewline
37 & -0.048224 & -0.5126 & 0.304604 \tabularnewline
38 & 0.024875 & 0.2644 & 0.395966 \tabularnewline
39 & -0.027446 & -0.2918 & 0.385504 \tabularnewline
40 & -0.015141 & -0.161 & 0.436208 \tabularnewline
41 & 0.023667 & 0.2516 & 0.400911 \tabularnewline
42 & 0.050227 & 0.5339 & 0.297223 \tabularnewline
43 & -0.108272 & -1.1509 & 0.126092 \tabularnewline
44 & 0.060008 & 0.6379 & 0.262417 \tabularnewline
45 & 0.028531 & 0.3033 & 0.381115 \tabularnewline
46 & -0.029824 & -0.317 & 0.375903 \tabularnewline
47 & -0.038224 & -0.4063 & 0.342637 \tabularnewline
48 & -0.09263 & -0.9847 & 0.163445 \tabularnewline
\hline
\end{tabular}
%Source: https://freestatistics.org/blog/index.php?pk=298428&T=1

[TABLE]
[ROW][C]Autocorrelation Function[/C][/ROW]
[ROW][C]Time lag k[/C][C]ACF(k)[/C][C]T-STAT[/C][C]P-value[/C][/ROW]
[ROW][C]1[/C][C]-0.35205[/C][C]-3.7423[/C][C]0.000144[/C][/ROW]
[ROW][C]2[/C][C]-0.212789[/C][C]-2.262[/C][C]0.012806[/C][/ROW]
[ROW][C]3[/C][C]0.106841[/C][C]1.1357[/C][C]0.129234[/C][/ROW]
[ROW][C]4[/C][C]-0.098376[/C][C]-1.0457[/C][C]0.148955[/C][/ROW]
[ROW][C]5[/C][C]0.22283[/C][C]2.3687[/C][C]0.009774[/C][/ROW]
[ROW][C]6[/C][C]-0.043986[/C][C]-0.4676[/C][C]0.320492[/C][/ROW]
[ROW][C]7[/C][C]-0.196106[/C][C]-2.0846[/C][C]0.019678[/C][/ROW]
[ROW][C]8[/C][C]0.203517[/C][C]2.1634[/C][C]0.016308[/C][/ROW]
[ROW][C]9[/C][C]-0.197198[/C][C]-2.0962[/C][C]0.019146[/C][/ROW]
[ROW][C]10[/C][C]0.201968[/C][C]2.147[/C][C]0.016967[/C][/ROW]
[ROW][C]11[/C][C]0.129913[/C][C]1.381[/C][C]0.085003[/C][/ROW]
[ROW][C]12[/C][C]-0.55213[/C][C]-5.8692[/C][C]0[/C][/ROW]
[ROW][C]13[/C][C]0.238809[/C][C]2.5386[/C][C]0.006246[/C][/ROW]
[ROW][C]14[/C][C]0.152046[/C][C]1.6163[/C][C]0.054412[/C][/ROW]
[ROW][C]15[/C][C]-0.040414[/C][C]-0.4296[/C][C]0.334151[/C][/ROW]
[ROW][C]16[/C][C]-0.062199[/C][C]-0.6612[/C][C]0.25492[/C][/ROW]
[ROW][C]17[/C][C]-0.111325[/C][C]-1.1834[/C][C]0.119566[/C][/ROW]
[ROW][C]18[/C][C]0.093381[/C][C]0.9927[/C][C]0.161499[/C][/ROW]
[ROW][C]19[/C][C]0.107674[/C][C]1.1446[/C][C]0.127398[/C][/ROW]
[ROW][C]20[/C][C]-0.217478[/C][C]-2.3118[/C][C]0.0113[/C][/ROW]
[ROW][C]21[/C][C]0.167115[/C][C]1.7765[/C][C]0.039174[/C][/ROW]
[ROW][C]22[/C][C]-0.109126[/C][C]-1.16[/C][C]0.124241[/C][/ROW]
[ROW][C]23[/C][C]0.054295[/C][C]0.5772[/C][C]0.282489[/C][/ROW]
[ROW][C]24[/C][C]0.082877[/C][C]0.881[/C][C]0.190096[/C][/ROW]
[ROW][C]25[/C][C]-0.081387[/C][C]-0.8652[/C][C]0.194394[/C][/ROW]
[ROW][C]26[/C][C]-0.097147[/C][C]-1.0327[/C][C]0.151978[/C][/ROW]
[ROW][C]27[/C][C]0.090516[/C][C]0.9622[/C][C]0.169001[/C][/ROW]
[ROW][C]28[/C][C]0.017835[/C][C]0.1896[/C][C]0.424987[/C][/ROW]
[ROW][C]29[/C][C]0.0701[/C][C]0.7452[/C][C]0.228856[/C][/ROW]
[ROW][C]30[/C][C]-0.106597[/C][C]-1.1331[/C][C]0.129776[/C][/ROW]
[ROW][C]31[/C][C]0.000728[/C][C]0.0077[/C][C]0.49692[/C][/ROW]
[ROW][C]32[/C][C]0.129885[/C][C]1.3807[/C][C]0.085048[/C][/ROW]
[ROW][C]33[/C][C]-0.118127[/C][C]-1.2557[/C][C]0.105906[/C][/ROW]
[ROW][C]34[/C][C]0.035816[/C][C]0.3807[/C][C]0.35206[/C][/ROW]
[ROW][C]35[/C][C]-0.022981[/C][C]-0.2443[/C][C]0.403725[/C][/ROW]
[ROW][C]36[/C][C]0.074446[/C][C]0.7914[/C][C]0.215193[/C][/ROW]
[ROW][C]37[/C][C]-0.048224[/C][C]-0.5126[/C][C]0.304604[/C][/ROW]
[ROW][C]38[/C][C]0.024875[/C][C]0.2644[/C][C]0.395966[/C][/ROW]
[ROW][C]39[/C][C]-0.027446[/C][C]-0.2918[/C][C]0.385504[/C][/ROW]
[ROW][C]40[/C][C]-0.015141[/C][C]-0.161[/C][C]0.436208[/C][/ROW]
[ROW][C]41[/C][C]0.023667[/C][C]0.2516[/C][C]0.400911[/C][/ROW]
[ROW][C]42[/C][C]0.050227[/C][C]0.5339[/C][C]0.297223[/C][/ROW]
[ROW][C]43[/C][C]-0.108272[/C][C]-1.1509[/C][C]0.126092[/C][/ROW]
[ROW][C]44[/C][C]0.060008[/C][C]0.6379[/C][C]0.262417[/C][/ROW]
[ROW][C]45[/C][C]0.028531[/C][C]0.3033[/C][C]0.381115[/C][/ROW]
[ROW][C]46[/C][C]-0.029824[/C][C]-0.317[/C][C]0.375903[/C][/ROW]
[ROW][C]47[/C][C]-0.038224[/C][C]-0.4063[/C][C]0.342637[/C][/ROW]
[ROW][C]48[/C][C]-0.09263[/C][C]-0.9847[/C][C]0.163445[/C][/ROW]
[/TABLE]
Source: https://freestatistics.org/blog/index.php?pk=298428&T=1

Globally Unique Identifier (entire table): ba.freestatistics.org/blog/index.php?pk=298428&T=1

As an alternative you can also use a QR Code:  

The GUIDs for individual cells are displayed in the table below:

Autocorrelation Function
Time lag kACF(k)T-STATP-value
1-0.35205-3.74230.000144
2-0.212789-2.2620.012806
30.1068411.13570.129234
4-0.098376-1.04570.148955
50.222832.36870.009774
6-0.043986-0.46760.320492
7-0.196106-2.08460.019678
80.2035172.16340.016308
9-0.197198-2.09620.019146
100.2019682.1470.016967
110.1299131.3810.085003
12-0.55213-5.86920
130.2388092.53860.006246
140.1520461.61630.054412
15-0.040414-0.42960.334151
16-0.062199-0.66120.25492
17-0.111325-1.18340.119566
180.0933810.99270.161499
190.1076741.14460.127398
20-0.217478-2.31180.0113
210.1671151.77650.039174
22-0.109126-1.160.124241
230.0542950.57720.282489
240.0828770.8810.190096
25-0.081387-0.86520.194394
26-0.097147-1.03270.151978
270.0905160.96220.169001
280.0178350.18960.424987
290.07010.74520.228856
30-0.106597-1.13310.129776
310.0007280.00770.49692
320.1298851.38070.085048
33-0.118127-1.25570.105906
340.0358160.38070.35206
35-0.022981-0.24430.403725
360.0744460.79140.215193
37-0.048224-0.51260.304604
380.0248750.26440.395966
39-0.027446-0.29180.385504
40-0.015141-0.1610.436208
410.0236670.25160.400911
420.0502270.53390.297223
43-0.108272-1.15090.126092
440.0600080.63790.262417
450.0285310.30330.381115
46-0.029824-0.3170.375903
47-0.038224-0.40630.342637
48-0.09263-0.98470.163445


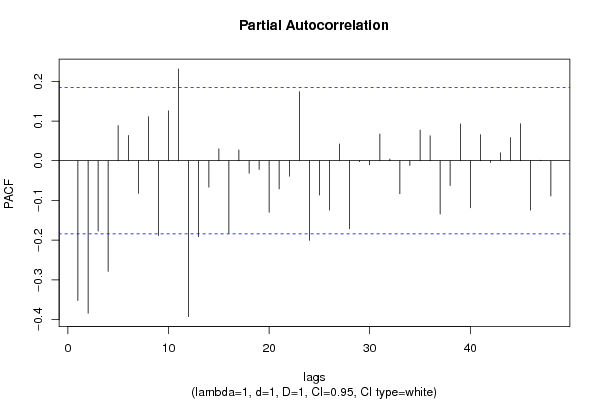
Partial Autocorrelation Function
Time lag kPACF(k)T-STATP-value
1-0.35205-3.74230.000144
2-0.384366-4.08594.1e-05
3-0.177036-1.88190.03121
4-0.278622-2.96180.001864
50.0883610.93930.174793
60.0633390.67330.251065
7-0.081996-0.87160.19263
80.1105671.17530.121163
9-0.18817-2.00030.023934
100.1256071.33520.092243
110.2311442.45710.007763
12-0.392721-4.17472.9e-05
13-0.191278-2.03330.022182
14-0.066514-0.7070.240496
150.0302040.32110.374375
16-0.182677-1.94190.02732
170.0268530.28550.387909
18-0.031579-0.33570.368864
19-0.021903-0.23280.408157
20-0.129895-1.38080.085033
21-0.070877-0.75340.22638
22-0.038875-0.41320.340104
230.1741331.85110.033386
24-0.200626-2.13270.017558
25-0.086145-0.91570.18088
26-0.12425-1.32080.094619
270.0420090.44660.328023
28-0.171548-1.82360.03543
29-0.002359-0.02510.490021
30-0.010308-0.10960.456469
310.0673410.71580.237783
320.004170.04430.482359
33-0.08328-0.88530.188944
34-0.011716-0.12450.450553
350.0771480.82010.206944
360.0625360.66480.253777
37-0.13429-1.42750.078094
38-0.062427-0.66360.254146
390.092330.98150.164226
40-0.118522-1.25990.105149
410.0656360.69770.243391
42-0.004515-0.0480.480902
430.0198120.21060.416787
440.0582290.6190.268587
450.0933380.99220.161612
46-0.124248-1.32080.094622
470.0012460.01320.494727
48-0.089085-0.9470.172832

\begin{tabular}{lllllllll}
\hline
Partial Autocorrelation Function \tabularnewline
Time lag k & PACF(k) & T-STAT & P-value \tabularnewline
1 & -0.35205 & -3.7423 & 0.000144 \tabularnewline
2 & -0.384366 & -4.0859 & 4.1e-05 \tabularnewline
3 & -0.177036 & -1.8819 & 0.03121 \tabularnewline
4 & -0.278622 & -2.9618 & 0.001864 \tabularnewline
5 & 0.088361 & 0.9393 & 0.174793 \tabularnewline
6 & 0.063339 & 0.6733 & 0.251065 \tabularnewline
7 & -0.081996 & -0.8716 & 0.19263 \tabularnewline
8 & 0.110567 & 1.1753 & 0.121163 \tabularnewline
9 & -0.18817 & -2.0003 & 0.023934 \tabularnewline
10 & 0.125607 & 1.3352 & 0.092243 \tabularnewline
11 & 0.231144 & 2.4571 & 0.007763 \tabularnewline
12 & -0.392721 & -4.1747 & 2.9e-05 \tabularnewline
13 & -0.191278 & -2.0333 & 0.022182 \tabularnewline
14 & -0.066514 & -0.707 & 0.240496 \tabularnewline
15 & 0.030204 & 0.3211 & 0.374375 \tabularnewline
16 & -0.182677 & -1.9419 & 0.02732 \tabularnewline
17 & 0.026853 & 0.2855 & 0.387909 \tabularnewline
18 & -0.031579 & -0.3357 & 0.368864 \tabularnewline
19 & -0.021903 & -0.2328 & 0.408157 \tabularnewline
20 & -0.129895 & -1.3808 & 0.085033 \tabularnewline
21 & -0.070877 & -0.7534 & 0.22638 \tabularnewline
22 & -0.038875 & -0.4132 & 0.340104 \tabularnewline
23 & 0.174133 & 1.8511 & 0.033386 \tabularnewline
24 & -0.200626 & -2.1327 & 0.017558 \tabularnewline
25 & -0.086145 & -0.9157 & 0.18088 \tabularnewline
26 & -0.12425 & -1.3208 & 0.094619 \tabularnewline
27 & 0.042009 & 0.4466 & 0.328023 \tabularnewline
28 & -0.171548 & -1.8236 & 0.03543 \tabularnewline
29 & -0.002359 & -0.0251 & 0.490021 \tabularnewline
30 & -0.010308 & -0.1096 & 0.456469 \tabularnewline
31 & 0.067341 & 0.7158 & 0.237783 \tabularnewline
32 & 0.00417 & 0.0443 & 0.482359 \tabularnewline
33 & -0.08328 & -0.8853 & 0.188944 \tabularnewline
34 & -0.011716 & -0.1245 & 0.450553 \tabularnewline
35 & 0.077148 & 0.8201 & 0.206944 \tabularnewline
36 & 0.062536 & 0.6648 & 0.253777 \tabularnewline
37 & -0.13429 & -1.4275 & 0.078094 \tabularnewline
38 & -0.062427 & -0.6636 & 0.254146 \tabularnewline
39 & 0.09233 & 0.9815 & 0.164226 \tabularnewline
40 & -0.118522 & -1.2599 & 0.105149 \tabularnewline
41 & 0.065636 & 0.6977 & 0.243391 \tabularnewline
42 & -0.004515 & -0.048 & 0.480902 \tabularnewline
43 & 0.019812 & 0.2106 & 0.416787 \tabularnewline
44 & 0.058229 & 0.619 & 0.268587 \tabularnewline
45 & 0.093338 & 0.9922 & 0.161612 \tabularnewline
46 & -0.124248 & -1.3208 & 0.094622 \tabularnewline
47 & 0.001246 & 0.0132 & 0.494727 \tabularnewline
48 & -0.089085 & -0.947 & 0.172832 \tabularnewline
\hline
\end{tabular}
%Source: https://freestatistics.org/blog/index.php?pk=298428&T=2

[TABLE]
[ROW][C]Partial Autocorrelation Function[/C][/ROW]
[ROW][C]Time lag k[/C][C]PACF(k)[/C][C]T-STAT[/C][C]P-value[/C][/ROW]
[ROW][C]1[/C][C]-0.35205[/C][C]-3.7423[/C][C]0.000144[/C][/ROW]
[ROW][C]2[/C][C]-0.384366[/C][C]-4.0859[/C][C]4.1e-05[/C][/ROW]
[ROW][C]3[/C][C]-0.177036[/C][C]-1.8819[/C][C]0.03121[/C][/ROW]
[ROW][C]4[/C][C]-0.278622[/C][C]-2.9618[/C][C]0.001864[/C][/ROW]
[ROW][C]5[/C][C]0.088361[/C][C]0.9393[/C][C]0.174793[/C][/ROW]
[ROW][C]6[/C][C]0.063339[/C][C]0.6733[/C][C]0.251065[/C][/ROW]
[ROW][C]7[/C][C]-0.081996[/C][C]-0.8716[/C][C]0.19263[/C][/ROW]
[ROW][C]8[/C][C]0.110567[/C][C]1.1753[/C][C]0.121163[/C][/ROW]
[ROW][C]9[/C][C]-0.18817[/C][C]-2.0003[/C][C]0.023934[/C][/ROW]
[ROW][C]10[/C][C]0.125607[/C][C]1.3352[/C][C]0.092243[/C][/ROW]
[ROW][C]11[/C][C]0.231144[/C][C]2.4571[/C][C]0.007763[/C][/ROW]
[ROW][C]12[/C][C]-0.392721[/C][C]-4.1747[/C][C]2.9e-05[/C][/ROW]
[ROW][C]13[/C][C]-0.191278[/C][C]-2.0333[/C][C]0.022182[/C][/ROW]
[ROW][C]14[/C][C]-0.066514[/C][C]-0.707[/C][C]0.240496[/C][/ROW]
[ROW][C]15[/C][C]0.030204[/C][C]0.3211[/C][C]0.374375[/C][/ROW]
[ROW][C]16[/C][C]-0.182677[/C][C]-1.9419[/C][C]0.02732[/C][/ROW]
[ROW][C]17[/C][C]0.026853[/C][C]0.2855[/C][C]0.387909[/C][/ROW]
[ROW][C]18[/C][C]-0.031579[/C][C]-0.3357[/C][C]0.368864[/C][/ROW]
[ROW][C]19[/C][C]-0.021903[/C][C]-0.2328[/C][C]0.408157[/C][/ROW]
[ROW][C]20[/C][C]-0.129895[/C][C]-1.3808[/C][C]0.085033[/C][/ROW]
[ROW][C]21[/C][C]-0.070877[/C][C]-0.7534[/C][C]0.22638[/C][/ROW]
[ROW][C]22[/C][C]-0.038875[/C][C]-0.4132[/C][C]0.340104[/C][/ROW]
[ROW][C]23[/C][C]0.174133[/C][C]1.8511[/C][C]0.033386[/C][/ROW]
[ROW][C]24[/C][C]-0.200626[/C][C]-2.1327[/C][C]0.017558[/C][/ROW]
[ROW][C]25[/C][C]-0.086145[/C][C]-0.9157[/C][C]0.18088[/C][/ROW]
[ROW][C]26[/C][C]-0.12425[/C][C]-1.3208[/C][C]0.094619[/C][/ROW]
[ROW][C]27[/C][C]0.042009[/C][C]0.4466[/C][C]0.328023[/C][/ROW]
[ROW][C]28[/C][C]-0.171548[/C][C]-1.8236[/C][C]0.03543[/C][/ROW]
[ROW][C]29[/C][C]-0.002359[/C][C]-0.0251[/C][C]0.490021[/C][/ROW]
[ROW][C]30[/C][C]-0.010308[/C][C]-0.1096[/C][C]0.456469[/C][/ROW]
[ROW][C]31[/C][C]0.067341[/C][C]0.7158[/C][C]0.237783[/C][/ROW]
[ROW][C]32[/C][C]0.00417[/C][C]0.0443[/C][C]0.482359[/C][/ROW]
[ROW][C]33[/C][C]-0.08328[/C][C]-0.8853[/C][C]0.188944[/C][/ROW]
[ROW][C]34[/C][C]-0.011716[/C][C]-0.1245[/C][C]0.450553[/C][/ROW]
[ROW][C]35[/C][C]0.077148[/C][C]0.8201[/C][C]0.206944[/C][/ROW]
[ROW][C]36[/C][C]0.062536[/C][C]0.6648[/C][C]0.253777[/C][/ROW]
[ROW][C]37[/C][C]-0.13429[/C][C]-1.4275[/C][C]0.078094[/C][/ROW]
[ROW][C]38[/C][C]-0.062427[/C][C]-0.6636[/C][C]0.254146[/C][/ROW]
[ROW][C]39[/C][C]0.09233[/C][C]0.9815[/C][C]0.164226[/C][/ROW]
[ROW][C]40[/C][C]-0.118522[/C][C]-1.2599[/C][C]0.105149[/C][/ROW]
[ROW][C]41[/C][C]0.065636[/C][C]0.6977[/C][C]0.243391[/C][/ROW]
[ROW][C]42[/C][C]-0.004515[/C][C]-0.048[/C][C]0.480902[/C][/ROW]
[ROW][C]43[/C][C]0.019812[/C][C]0.2106[/C][C]0.416787[/C][/ROW]
[ROW][C]44[/C][C]0.058229[/C][C]0.619[/C][C]0.268587[/C][/ROW]
[ROW][C]45[/C][C]0.093338[/C][C]0.9922[/C][C]0.161612[/C][/ROW]
[ROW][C]46[/C][C]-0.124248[/C][C]-1.3208[/C][C]0.094622[/C][/ROW]
[ROW][C]47[/C][C]0.001246[/C][C]0.0132[/C][C]0.494727[/C][/ROW]
[ROW][C]48[/C][C]-0.089085[/C][C]-0.947[/C][C]0.172832[/C][/ROW]
[/TABLE]
Source: https://freestatistics.org/blog/index.php?pk=298428&T=2

Globally Unique Identifier (entire table): ba.freestatistics.org/blog/index.php?pk=298428&T=2

As an alternative you can also use a QR Code:  

The GUIDs for individual cells are displayed in the table below:

Partial Autocorrelation Function
Time lag kPACF(k)T-STATP-value
1-0.35205-3.74230.000144
2-0.384366-4.08594.1e-05
3-0.177036-1.88190.03121
4-0.278622-2.96180.001864
50.0883610.93930.174793
60.0633390.67330.251065
7-0.081996-0.87160.19263
80.1105671.17530.121163
9-0.18817-2.00030.023934
100.1256071.33520.092243
110.2311442.45710.007763
12-0.392721-4.17472.9e-05
13-0.191278-2.03330.022182
14-0.066514-0.7070.240496
150.0302040.32110.374375
16-0.182677-1.94190.02732
170.0268530.28550.387909
18-0.031579-0.33570.368864
19-0.021903-0.23280.408157
20-0.129895-1.38080.085033
21-0.070877-0.75340.22638
22-0.038875-0.41320.340104
230.1741331.85110.033386
24-0.200626-2.13270.017558
25-0.086145-0.91570.18088
26-0.12425-1.32080.094619
270.0420090.44660.328023
28-0.171548-1.82360.03543
29-0.002359-0.02510.490021
30-0.010308-0.10960.456469
310.0673410.71580.237783
320.004170.04430.482359
33-0.08328-0.88530.188944
34-0.011716-0.12450.450553
350.0771480.82010.206944
360.0625360.66480.253777
37-0.13429-1.42750.078094
38-0.062427-0.66360.254146
390.092330.98150.164226
40-0.118522-1.25990.105149
410.0656360.69770.243391
42-0.004515-0.0480.480902
430.0198120.21060.416787
440.0582290.6190.268587
450.0933380.99220.161612
46-0.124248-1.32080.094622
470.0012460.01320.494727
48-0.089085-0.9470.172832


Parameters (Session):
par1 = 48 ; par2 = 1 ; par3 = 1 ; par4 = 1 ; par5 = 12 ; par6 = White Noise ; par7 = 0.95 ;
Parameters (R input):
par1 = 48 ; par2 = 1 ; par3 = 1 ; par4 = 1 ; par5 = 12 ; par6 = White Noise ; par7 = 0.95 ; par8 = ;
R code (references can be found in the software module):
par8 <- ''
par7 <- '0.95'
par6 <- 'White Noise'
par5 <- '1'
par4 <- '0'
par3 <- '1'
par2 <- '1'
par1 <- '48'
if (par1 == 'Default') {
par1 = 10*log10(length(x))
} else {
par1 <- as.numeric(par1)
}
par2 <- as.numeric(par2)
par3 <- as.numeric(par3)
par4 <- as.numeric(par4)
par5 <- as.numeric(par5)
if (par6 == 'White Noise') par6 <- 'white' else par6 <- 'ma'
par7 <- as.numeric(par7)
if (par8 != '') par8 <- as.numeric(par8)
x <- na.omit(x)
ox <- x
if (par8 == '') {
if (par2 == 0) {
x <- log(x)
} else {
x <- (x ^ par2 - 1) / par2
}
} else {
x <- log(x,base=par8)
}
if (par3 > 0) x <- diff(x,lag=1,difference=par3)
if (par4 > 0) x <- diff(x,lag=par5,difference=par4)
bitmap(file='picts.png')
op <- par(mfrow=c(2,1))
plot(ox,type='l',main='Original Time Series',xlab='time',ylab='value')
if (par8=='') {
mytitle <- paste('Working Time Series (lambda=',par2,', d=',par3,', D=',par4,')',sep='')
mysub <- paste('(lambda=',par2,', d=',par3,', D=',par4,', CI=', par7, ', CI type=',par6,')',sep='')
} else {
mytitle <- paste('Working Time Series (base=',par8,', d=',par3,', D=',par4,')',sep='')
mysub <- paste('(base=',par8,', d=',par3,', D=',par4,', CI=', par7, ', CI type=',par6,')',sep='')
}
plot(x,type='l', main=mytitle,xlab='time',ylab='value')
par(op)
dev.off()
bitmap(file='pic1.png')
racf <- acf(x, par1, main='Autocorrelation', xlab='time lag', ylab='ACF', ci.type=par6, ci=par7, sub=mysub)
dev.off()
bitmap(file='pic2.png')
rpacf <- pacf(x,par1,main='Partial Autocorrelation',xlab='lags',ylab='PACF',sub=mysub)
dev.off()
(myacf <- c(racf$acf))
(mypacf <- c(rpacf$acf))
lengthx <- length(x)
sqrtn <- sqrt(lengthx)
load(file='createtable')
a<-table.start()
a<-table.row.start(a)
a<-table.element(a,'Autocorrelation Function',4,TRUE)
a<-table.row.end(a)
a<-table.row.start(a)
a<-table.element(a,'Time lag k',header=TRUE)
a<-table.element(a,'ACF(k)',header=TRUE)
a<-table.element(a,'T-STAT',header=TRUE)
a<-table.element(a,'P-value',header=TRUE)
a<-table.row.end(a)
for (i in 2:(par1+1)) {
a<-table.row.start(a)
a<-table.element(a,i-1,header=TRUE)
a<-table.element(a,round(myacf[i],6))
mytstat <- myacf[i]*sqrtn
a<-table.element(a,round(mytstat,4))
a<-table.element(a,round(1-pt(abs(mytstat),lengthx),6))
a<-table.row.end(a)
}
a<-table.end(a)
table.save(a,file='mytable.tab')
a<-table.start()
a<-table.row.start(a)
a<-table.element(a,'Partial Autocorrelation Function',4,TRUE)
a<-table.row.end(a)
a<-table.row.start(a)
a<-table.element(a,'Time lag k',header=TRUE)
a<-table.element(a,'PACF(k)',header=TRUE)
a<-table.element(a,'T-STAT',header=TRUE)
a<-table.element(a,'P-value',header=TRUE)
a<-table.row.end(a)
for (i in 1:par1) {
a<-table.row.start(a)
a<-table.element(a,i,header=TRUE)
a<-table.element(a,round(mypacf[i],6))
mytstat <- mypacf[i]*sqrtn
a<-table.element(a,round(mytstat,4))
a<-table.element(a,round(1-pt(abs(mytstat),lengthx),6))
a<-table.row.end(a)
}
a<-table.end(a)
table.save(a,file='mytable1.tab')