Free Statistics

of Irreproducible Research!

Author's title

Author*The author of this computation has been verified*
R Software Modulerwasp_autocorrelation.wasp
Title produced by software(Partial) Autocorrelation Function
Date of computationFri, 09 Dec 2016 08:55:35 +0100
Cite this page as followsStatistical Computations at FreeStatistics.org, Office for Research Development and Education, URL https://freestatistics.org/blog/index.php?v=date/2016/Dec/09/t1481270158lfm4piw55ndewqe.htm/, Retrieved Fri, 17 May 2024 14:45:39 +0000
Statistical Computations at FreeStatistics.org, Office for Research Development and Education, URL https://freestatistics.org/blog/index.php?pk=298424, Retrieved Fri, 17 May 2024 14:45:39 +0000
QR Codes:

Original text written by user:
IsPrivate?No (this computation is public)
User-defined keywords
Estimated Impact88
Family? (F = Feedback message, R = changed R code, M = changed R Module, P = changed Parameters, D = changed Data)
-       [(Partial) Autocorrelation Function] [] [2016-12-09 07:55:35] [94ac3c9a028ddd47e8862e80eac9f626] [Current]
Feedback Forum

Post a new message
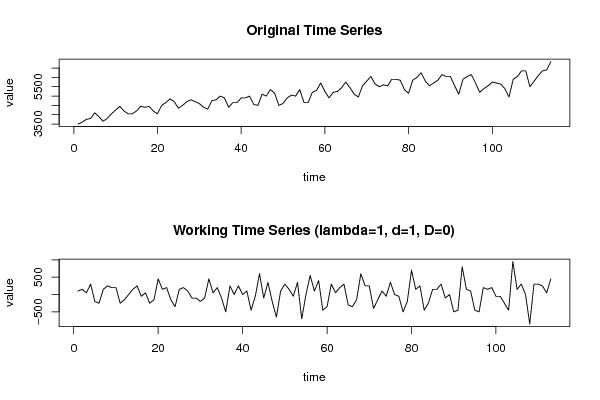
Dataseries X:
3500
3600
3750
3800
4100
3900
3650
3800
4050
4250
4450
4200
4050
4050
4200
4450
4400
4450
4200
4050
4500
4650
4850
4700
4350
4500
4700
4800
4700
4600
4400
4300
4750
4800
5000
4900
4400
4650
4650
4900
4900
5000
4550
4500
5100
5000
5350
5150
4500
4600
4900
5050
5000
5350
4650
4650
5200
5300
5700
5250
4900
5200
5250
5450
5750
5450
5100
4950
5550
5800
6050
5650
5500
5600
5550
5900
5900
5850
5350
5150
5850
6000
6250
5800
5550
5700
5850
6150
6050
6050
5550
5100
5900
6050
6150
5700
5200
5400
5550
5750
5700
5650
5400
4950
5900
6050
6350
6350
5500
5800
6100
6350
6400
6850


Summary of computational transaction
Raw Input view raw input (R code)
Raw Outputview raw output of R engine
Computing time2 seconds
R ServerBig Analytics Cloud Computing Center

\begin{tabular}{lllllllll}
\hline
Summary of computational transaction \tabularnewline
Raw Input view raw input (R code)  \tabularnewline
Raw Outputview raw output of R engine  \tabularnewline
Computing time2 seconds \tabularnewline
R ServerBig Analytics Cloud Computing Center \tabularnewline
\hline
\end{tabular}
%Source: https://freestatistics.org/blog/index.php?pk=298424&T=0

[TABLE]
[ROW]
Summary of computational transaction[/C][/ROW] [ROW]Raw Input[/C] view raw input (R code) [/C][/ROW] [ROW]Raw Output[/C]view raw output of R engine [/C][/ROW] [ROW]Computing time[/C]2 seconds[/C][/ROW] [ROW]R Server[/C]Big Analytics Cloud Computing Center[/C][/ROW] [/TABLE] Source: https://freestatistics.org/blog/index.php?pk=298424&T=0

Globally Unique Identifier (entire table): ba.freestatistics.org/blog/index.php?pk=298424&T=0

As an alternative you can also use a QR Code:  

The GUIDs for individual cells are displayed in the table below:

Summary of computational transaction
Raw Input view raw input (R code)
Raw Outputview raw output of R engine
Computing time2 seconds
R ServerBig Analytics Cloud Computing Center


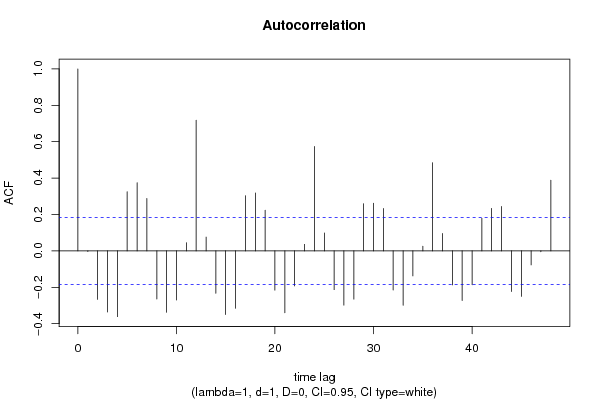
Autocorrelation Function
Time lag kACF(k)T-STATP-value
1-0.003724-0.03960.484245
2-0.266696-2.8350.002715
3-0.336161-3.57340.00026
4-0.36141-3.84180.000101
50.3251253.45610.000386
60.3747513.98376e-05
70.2880143.06160.001376
8-0.264895-2.81590.002871
9-0.337151-3.5840.00025
10-0.269825-2.86830.002463
110.044970.4780.316774
120.7184737.63750
130.075780.80560.211096
14-0.232675-2.47340.007436
15-0.349881-3.71930.000156
16-0.3155-3.35380.000543
170.3034983.22620.000821
180.3185153.38590.000488
190.2234772.37560.009602
20-0.215602-2.29190.011882
21-0.340183-3.61620.000224
22-0.192496-2.04630.021526
230.0359560.38220.351509
240.5737346.09890
250.0987181.04940.148119
26-0.212886-2.2630.012773
27-0.298282-3.17080.000979
28-0.265158-2.81870.002848
290.2592732.75610.003411
300.2618182.78320.003156
310.2326022.47260.007452
32-0.214626-2.28150.012196
33-0.298981-3.17820.000956
34-0.137389-1.46050.073469
350.0252760.26870.39433
360.4845935.15131e-06
370.0960951.02150.154598
38-0.186756-1.98520.02477
39-0.272518-2.89690.002263
40-0.186122-1.97850.025153
410.1792141.90510.029656
420.2335492.48270.007255
430.2444172.59820.00531
44-0.223331-2.3740.00964
45-0.25023-2.660.004475
46-0.077032-0.81890.207295
47-0.005158-0.05480.478184
480.3886964.13193.5e-05

\begin{tabular}{lllllllll}
\hline
Autocorrelation Function \tabularnewline
Time lag k & ACF(k) & T-STAT & P-value \tabularnewline
1 & -0.003724 & -0.0396 & 0.484245 \tabularnewline
2 & -0.266696 & -2.835 & 0.002715 \tabularnewline
3 & -0.336161 & -3.5734 & 0.00026 \tabularnewline
4 & -0.36141 & -3.8418 & 0.000101 \tabularnewline
5 & 0.325125 & 3.4561 & 0.000386 \tabularnewline
6 & 0.374751 & 3.9837 & 6e-05 \tabularnewline
7 & 0.288014 & 3.0616 & 0.001376 \tabularnewline
8 & -0.264895 & -2.8159 & 0.002871 \tabularnewline
9 & -0.337151 & -3.584 & 0.00025 \tabularnewline
10 & -0.269825 & -2.8683 & 0.002463 \tabularnewline
11 & 0.04497 & 0.478 & 0.316774 \tabularnewline
12 & 0.718473 & 7.6375 & 0 \tabularnewline
13 & 0.07578 & 0.8056 & 0.211096 \tabularnewline
14 & -0.232675 & -2.4734 & 0.007436 \tabularnewline
15 & -0.349881 & -3.7193 & 0.000156 \tabularnewline
16 & -0.3155 & -3.3538 & 0.000543 \tabularnewline
17 & 0.303498 & 3.2262 & 0.000821 \tabularnewline
18 & 0.318515 & 3.3859 & 0.000488 \tabularnewline
19 & 0.223477 & 2.3756 & 0.009602 \tabularnewline
20 & -0.215602 & -2.2919 & 0.011882 \tabularnewline
21 & -0.340183 & -3.6162 & 0.000224 \tabularnewline
22 & -0.192496 & -2.0463 & 0.021526 \tabularnewline
23 & 0.035956 & 0.3822 & 0.351509 \tabularnewline
24 & 0.573734 & 6.0989 & 0 \tabularnewline
25 & 0.098718 & 1.0494 & 0.148119 \tabularnewline
26 & -0.212886 & -2.263 & 0.012773 \tabularnewline
27 & -0.298282 & -3.1708 & 0.000979 \tabularnewline
28 & -0.265158 & -2.8187 & 0.002848 \tabularnewline
29 & 0.259273 & 2.7561 & 0.003411 \tabularnewline
30 & 0.261818 & 2.7832 & 0.003156 \tabularnewline
31 & 0.232602 & 2.4726 & 0.007452 \tabularnewline
32 & -0.214626 & -2.2815 & 0.012196 \tabularnewline
33 & -0.298981 & -3.1782 & 0.000956 \tabularnewline
34 & -0.137389 & -1.4605 & 0.073469 \tabularnewline
35 & 0.025276 & 0.2687 & 0.39433 \tabularnewline
36 & 0.484593 & 5.1513 & 1e-06 \tabularnewline
37 & 0.096095 & 1.0215 & 0.154598 \tabularnewline
38 & -0.186756 & -1.9852 & 0.02477 \tabularnewline
39 & -0.272518 & -2.8969 & 0.002263 \tabularnewline
40 & -0.186122 & -1.9785 & 0.025153 \tabularnewline
41 & 0.179214 & 1.9051 & 0.029656 \tabularnewline
42 & 0.233549 & 2.4827 & 0.007255 \tabularnewline
43 & 0.244417 & 2.5982 & 0.00531 \tabularnewline
44 & -0.223331 & -2.374 & 0.00964 \tabularnewline
45 & -0.25023 & -2.66 & 0.004475 \tabularnewline
46 & -0.077032 & -0.8189 & 0.207295 \tabularnewline
47 & -0.005158 & -0.0548 & 0.478184 \tabularnewline
48 & 0.388696 & 4.1319 & 3.5e-05 \tabularnewline
\hline
\end{tabular}
%Source: https://freestatistics.org/blog/index.php?pk=298424&T=1

[TABLE]
[ROW][C]Autocorrelation Function[/C][/ROW]
[ROW][C]Time lag k[/C][C]ACF(k)[/C][C]T-STAT[/C][C]P-value[/C][/ROW]
[ROW][C]1[/C][C]-0.003724[/C][C]-0.0396[/C][C]0.484245[/C][/ROW]
[ROW][C]2[/C][C]-0.266696[/C][C]-2.835[/C][C]0.002715[/C][/ROW]
[ROW][C]3[/C][C]-0.336161[/C][C]-3.5734[/C][C]0.00026[/C][/ROW]
[ROW][C]4[/C][C]-0.36141[/C][C]-3.8418[/C][C]0.000101[/C][/ROW]
[ROW][C]5[/C][C]0.325125[/C][C]3.4561[/C][C]0.000386[/C][/ROW]
[ROW][C]6[/C][C]0.374751[/C][C]3.9837[/C][C]6e-05[/C][/ROW]
[ROW][C]7[/C][C]0.288014[/C][C]3.0616[/C][C]0.001376[/C][/ROW]
[ROW][C]8[/C][C]-0.264895[/C][C]-2.8159[/C][C]0.002871[/C][/ROW]
[ROW][C]9[/C][C]-0.337151[/C][C]-3.584[/C][C]0.00025[/C][/ROW]
[ROW][C]10[/C][C]-0.269825[/C][C]-2.8683[/C][C]0.002463[/C][/ROW]
[ROW][C]11[/C][C]0.04497[/C][C]0.478[/C][C]0.316774[/C][/ROW]
[ROW][C]12[/C][C]0.718473[/C][C]7.6375[/C][C]0[/C][/ROW]
[ROW][C]13[/C][C]0.07578[/C][C]0.8056[/C][C]0.211096[/C][/ROW]
[ROW][C]14[/C][C]-0.232675[/C][C]-2.4734[/C][C]0.007436[/C][/ROW]
[ROW][C]15[/C][C]-0.349881[/C][C]-3.7193[/C][C]0.000156[/C][/ROW]
[ROW][C]16[/C][C]-0.3155[/C][C]-3.3538[/C][C]0.000543[/C][/ROW]
[ROW][C]17[/C][C]0.303498[/C][C]3.2262[/C][C]0.000821[/C][/ROW]
[ROW][C]18[/C][C]0.318515[/C][C]3.3859[/C][C]0.000488[/C][/ROW]
[ROW][C]19[/C][C]0.223477[/C][C]2.3756[/C][C]0.009602[/C][/ROW]
[ROW][C]20[/C][C]-0.215602[/C][C]-2.2919[/C][C]0.011882[/C][/ROW]
[ROW][C]21[/C][C]-0.340183[/C][C]-3.6162[/C][C]0.000224[/C][/ROW]
[ROW][C]22[/C][C]-0.192496[/C][C]-2.0463[/C][C]0.021526[/C][/ROW]
[ROW][C]23[/C][C]0.035956[/C][C]0.3822[/C][C]0.351509[/C][/ROW]
[ROW][C]24[/C][C]0.573734[/C][C]6.0989[/C][C]0[/C][/ROW]
[ROW][C]25[/C][C]0.098718[/C][C]1.0494[/C][C]0.148119[/C][/ROW]
[ROW][C]26[/C][C]-0.212886[/C][C]-2.263[/C][C]0.012773[/C][/ROW]
[ROW][C]27[/C][C]-0.298282[/C][C]-3.1708[/C][C]0.000979[/C][/ROW]
[ROW][C]28[/C][C]-0.265158[/C][C]-2.8187[/C][C]0.002848[/C][/ROW]
[ROW][C]29[/C][C]0.259273[/C][C]2.7561[/C][C]0.003411[/C][/ROW]
[ROW][C]30[/C][C]0.261818[/C][C]2.7832[/C][C]0.003156[/C][/ROW]
[ROW][C]31[/C][C]0.232602[/C][C]2.4726[/C][C]0.007452[/C][/ROW]
[ROW][C]32[/C][C]-0.214626[/C][C]-2.2815[/C][C]0.012196[/C][/ROW]
[ROW][C]33[/C][C]-0.298981[/C][C]-3.1782[/C][C]0.000956[/C][/ROW]
[ROW][C]34[/C][C]-0.137389[/C][C]-1.4605[/C][C]0.073469[/C][/ROW]
[ROW][C]35[/C][C]0.025276[/C][C]0.2687[/C][C]0.39433[/C][/ROW]
[ROW][C]36[/C][C]0.484593[/C][C]5.1513[/C][C]1e-06[/C][/ROW]
[ROW][C]37[/C][C]0.096095[/C][C]1.0215[/C][C]0.154598[/C][/ROW]
[ROW][C]38[/C][C]-0.186756[/C][C]-1.9852[/C][C]0.02477[/C][/ROW]
[ROW][C]39[/C][C]-0.272518[/C][C]-2.8969[/C][C]0.002263[/C][/ROW]
[ROW][C]40[/C][C]-0.186122[/C][C]-1.9785[/C][C]0.025153[/C][/ROW]
[ROW][C]41[/C][C]0.179214[/C][C]1.9051[/C][C]0.029656[/C][/ROW]
[ROW][C]42[/C][C]0.233549[/C][C]2.4827[/C][C]0.007255[/C][/ROW]
[ROW][C]43[/C][C]0.244417[/C][C]2.5982[/C][C]0.00531[/C][/ROW]
[ROW][C]44[/C][C]-0.223331[/C][C]-2.374[/C][C]0.00964[/C][/ROW]
[ROW][C]45[/C][C]-0.25023[/C][C]-2.66[/C][C]0.004475[/C][/ROW]
[ROW][C]46[/C][C]-0.077032[/C][C]-0.8189[/C][C]0.207295[/C][/ROW]
[ROW][C]47[/C][C]-0.005158[/C][C]-0.0548[/C][C]0.478184[/C][/ROW]
[ROW][C]48[/C][C]0.388696[/C][C]4.1319[/C][C]3.5e-05[/C][/ROW]
[/TABLE]
Source: https://freestatistics.org/blog/index.php?pk=298424&T=1

Globally Unique Identifier (entire table): ba.freestatistics.org/blog/index.php?pk=298424&T=1

As an alternative you can also use a QR Code:  

The GUIDs for individual cells are displayed in the table below:

Autocorrelation Function
Time lag kACF(k)T-STATP-value
1-0.003724-0.03960.484245
2-0.266696-2.8350.002715
3-0.336161-3.57340.00026
4-0.36141-3.84180.000101
50.3251253.45610.000386
60.3747513.98376e-05
70.2880143.06160.001376
8-0.264895-2.81590.002871
9-0.337151-3.5840.00025
10-0.269825-2.86830.002463
110.044970.4780.316774
120.7184737.63750
130.075780.80560.211096
14-0.232675-2.47340.007436
15-0.349881-3.71930.000156
16-0.3155-3.35380.000543
170.3034983.22620.000821
180.3185153.38590.000488
190.2234772.37560.009602
20-0.215602-2.29190.011882
21-0.340183-3.61620.000224
22-0.192496-2.04630.021526
230.0359560.38220.351509
240.5737346.09890
250.0987181.04940.148119
26-0.212886-2.2630.012773
27-0.298282-3.17080.000979
28-0.265158-2.81870.002848
290.2592732.75610.003411
300.2618182.78320.003156
310.2326022.47260.007452
32-0.214626-2.28150.012196
33-0.298981-3.17820.000956
34-0.137389-1.46050.073469
350.0252760.26870.39433
360.4845935.15131e-06
370.0960951.02150.154598
38-0.186756-1.98520.02477
39-0.272518-2.89690.002263
40-0.186122-1.97850.025153
410.1792141.90510.029656
420.2335492.48270.007255
430.2444172.59820.00531
44-0.223331-2.3740.00964
45-0.25023-2.660.004475
46-0.077032-0.81890.207295
47-0.005158-0.05480.478184
480.3886964.13193.5e-05


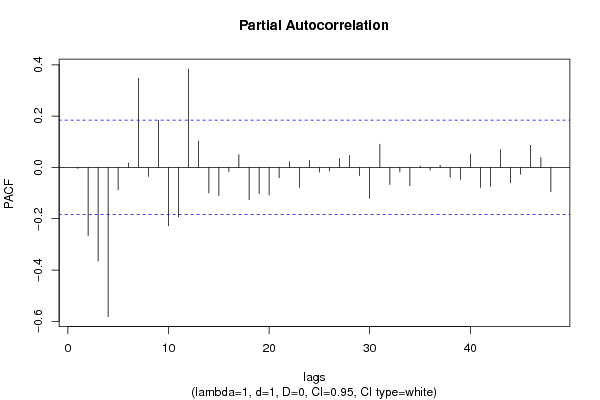
Partial Autocorrelation Function
Time lag kPACF(k)T-STATP-value
1-0.003724-0.03960.484245
2-0.266713-2.83520.002714
3-0.364335-3.87299e-05
4-0.58172-6.18380
5-0.086622-0.92080.179557
60.0169770.18050.428554
70.3471163.68990.000173
8-0.035187-0.3740.354536
90.1831351.94680.027023
10-0.227135-2.41450.008682
11-0.192805-2.04950.021362
120.383924.08114.2e-05
130.10311.0960.137712
14-0.099673-1.05950.145806
15-0.109417-1.16310.123617
16-0.016163-0.17180.431944
170.0500940.53250.29771
18-0.125425-1.33330.09256
19-0.101421-1.07810.141637
20-0.10696-1.1370.128971
21-0.040353-0.4290.334384
220.0217980.23170.408589
23-0.078535-0.83480.202784
240.0275530.29290.385071
25-0.018115-0.19260.423822
26-0.014285-0.15180.439788
270.0346950.36880.356479
280.046420.49340.311327
29-0.031824-0.33830.367886
30-0.120077-1.27640.102209
310.0903890.96080.16934
32-0.066109-0.70270.241829
33-0.017376-0.18470.426894
34-0.071157-0.75640.225488
350.0048090.05110.479661
36-0.010371-0.11020.456203
370.0081390.08650.465605
38-0.038092-0.40490.34315
39-0.047319-0.5030.307969
400.0512350.54460.293538
41-0.078337-0.83270.203377
42-0.073551-0.78190.217966
430.0693370.73710.231307
44-0.060322-0.64120.261336
45-0.026388-0.28050.389801
460.0861230.91550.180938
470.0389340.41390.339874
48-0.094972-1.00960.157429

\begin{tabular}{lllllllll}
\hline
Partial Autocorrelation Function \tabularnewline
Time lag k & PACF(k) & T-STAT & P-value \tabularnewline
1 & -0.003724 & -0.0396 & 0.484245 \tabularnewline
2 & -0.266713 & -2.8352 & 0.002714 \tabularnewline
3 & -0.364335 & -3.8729 & 9e-05 \tabularnewline
4 & -0.58172 & -6.1838 & 0 \tabularnewline
5 & -0.086622 & -0.9208 & 0.179557 \tabularnewline
6 & 0.016977 & 0.1805 & 0.428554 \tabularnewline
7 & 0.347116 & 3.6899 & 0.000173 \tabularnewline
8 & -0.035187 & -0.374 & 0.354536 \tabularnewline
9 & 0.183135 & 1.9468 & 0.027023 \tabularnewline
10 & -0.227135 & -2.4145 & 0.008682 \tabularnewline
11 & -0.192805 & -2.0495 & 0.021362 \tabularnewline
12 & 0.38392 & 4.0811 & 4.2e-05 \tabularnewline
13 & 0.1031 & 1.096 & 0.137712 \tabularnewline
14 & -0.099673 & -1.0595 & 0.145806 \tabularnewline
15 & -0.109417 & -1.1631 & 0.123617 \tabularnewline
16 & -0.016163 & -0.1718 & 0.431944 \tabularnewline
17 & 0.050094 & 0.5325 & 0.29771 \tabularnewline
18 & -0.125425 & -1.3333 & 0.09256 \tabularnewline
19 & -0.101421 & -1.0781 & 0.141637 \tabularnewline
20 & -0.10696 & -1.137 & 0.128971 \tabularnewline
21 & -0.040353 & -0.429 & 0.334384 \tabularnewline
22 & 0.021798 & 0.2317 & 0.408589 \tabularnewline
23 & -0.078535 & -0.8348 & 0.202784 \tabularnewline
24 & 0.027553 & 0.2929 & 0.385071 \tabularnewline
25 & -0.018115 & -0.1926 & 0.423822 \tabularnewline
26 & -0.014285 & -0.1518 & 0.439788 \tabularnewline
27 & 0.034695 & 0.3688 & 0.356479 \tabularnewline
28 & 0.04642 & 0.4934 & 0.311327 \tabularnewline
29 & -0.031824 & -0.3383 & 0.367886 \tabularnewline
30 & -0.120077 & -1.2764 & 0.102209 \tabularnewline
31 & 0.090389 & 0.9608 & 0.16934 \tabularnewline
32 & -0.066109 & -0.7027 & 0.241829 \tabularnewline
33 & -0.017376 & -0.1847 & 0.426894 \tabularnewline
34 & -0.071157 & -0.7564 & 0.225488 \tabularnewline
35 & 0.004809 & 0.0511 & 0.479661 \tabularnewline
36 & -0.010371 & -0.1102 & 0.456203 \tabularnewline
37 & 0.008139 & 0.0865 & 0.465605 \tabularnewline
38 & -0.038092 & -0.4049 & 0.34315 \tabularnewline
39 & -0.047319 & -0.503 & 0.307969 \tabularnewline
40 & 0.051235 & 0.5446 & 0.293538 \tabularnewline
41 & -0.078337 & -0.8327 & 0.203377 \tabularnewline
42 & -0.073551 & -0.7819 & 0.217966 \tabularnewline
43 & 0.069337 & 0.7371 & 0.231307 \tabularnewline
44 & -0.060322 & -0.6412 & 0.261336 \tabularnewline
45 & -0.026388 & -0.2805 & 0.389801 \tabularnewline
46 & 0.086123 & 0.9155 & 0.180938 \tabularnewline
47 & 0.038934 & 0.4139 & 0.339874 \tabularnewline
48 & -0.094972 & -1.0096 & 0.157429 \tabularnewline
\hline
\end{tabular}
%Source: https://freestatistics.org/blog/index.php?pk=298424&T=2

[TABLE]
[ROW][C]Partial Autocorrelation Function[/C][/ROW]
[ROW][C]Time lag k[/C][C]PACF(k)[/C][C]T-STAT[/C][C]P-value[/C][/ROW]
[ROW][C]1[/C][C]-0.003724[/C][C]-0.0396[/C][C]0.484245[/C][/ROW]
[ROW][C]2[/C][C]-0.266713[/C][C]-2.8352[/C][C]0.002714[/C][/ROW]
[ROW][C]3[/C][C]-0.364335[/C][C]-3.8729[/C][C]9e-05[/C][/ROW]
[ROW][C]4[/C][C]-0.58172[/C][C]-6.1838[/C][C]0[/C][/ROW]
[ROW][C]5[/C][C]-0.086622[/C][C]-0.9208[/C][C]0.179557[/C][/ROW]
[ROW][C]6[/C][C]0.016977[/C][C]0.1805[/C][C]0.428554[/C][/ROW]
[ROW][C]7[/C][C]0.347116[/C][C]3.6899[/C][C]0.000173[/C][/ROW]
[ROW][C]8[/C][C]-0.035187[/C][C]-0.374[/C][C]0.354536[/C][/ROW]
[ROW][C]9[/C][C]0.183135[/C][C]1.9468[/C][C]0.027023[/C][/ROW]
[ROW][C]10[/C][C]-0.227135[/C][C]-2.4145[/C][C]0.008682[/C][/ROW]
[ROW][C]11[/C][C]-0.192805[/C][C]-2.0495[/C][C]0.021362[/C][/ROW]
[ROW][C]12[/C][C]0.38392[/C][C]4.0811[/C][C]4.2e-05[/C][/ROW]
[ROW][C]13[/C][C]0.1031[/C][C]1.096[/C][C]0.137712[/C][/ROW]
[ROW][C]14[/C][C]-0.099673[/C][C]-1.0595[/C][C]0.145806[/C][/ROW]
[ROW][C]15[/C][C]-0.109417[/C][C]-1.1631[/C][C]0.123617[/C][/ROW]
[ROW][C]16[/C][C]-0.016163[/C][C]-0.1718[/C][C]0.431944[/C][/ROW]
[ROW][C]17[/C][C]0.050094[/C][C]0.5325[/C][C]0.29771[/C][/ROW]
[ROW][C]18[/C][C]-0.125425[/C][C]-1.3333[/C][C]0.09256[/C][/ROW]
[ROW][C]19[/C][C]-0.101421[/C][C]-1.0781[/C][C]0.141637[/C][/ROW]
[ROW][C]20[/C][C]-0.10696[/C][C]-1.137[/C][C]0.128971[/C][/ROW]
[ROW][C]21[/C][C]-0.040353[/C][C]-0.429[/C][C]0.334384[/C][/ROW]
[ROW][C]22[/C][C]0.021798[/C][C]0.2317[/C][C]0.408589[/C][/ROW]
[ROW][C]23[/C][C]-0.078535[/C][C]-0.8348[/C][C]0.202784[/C][/ROW]
[ROW][C]24[/C][C]0.027553[/C][C]0.2929[/C][C]0.385071[/C][/ROW]
[ROW][C]25[/C][C]-0.018115[/C][C]-0.1926[/C][C]0.423822[/C][/ROW]
[ROW][C]26[/C][C]-0.014285[/C][C]-0.1518[/C][C]0.439788[/C][/ROW]
[ROW][C]27[/C][C]0.034695[/C][C]0.3688[/C][C]0.356479[/C][/ROW]
[ROW][C]28[/C][C]0.04642[/C][C]0.4934[/C][C]0.311327[/C][/ROW]
[ROW][C]29[/C][C]-0.031824[/C][C]-0.3383[/C][C]0.367886[/C][/ROW]
[ROW][C]30[/C][C]-0.120077[/C][C]-1.2764[/C][C]0.102209[/C][/ROW]
[ROW][C]31[/C][C]0.090389[/C][C]0.9608[/C][C]0.16934[/C][/ROW]
[ROW][C]32[/C][C]-0.066109[/C][C]-0.7027[/C][C]0.241829[/C][/ROW]
[ROW][C]33[/C][C]-0.017376[/C][C]-0.1847[/C][C]0.426894[/C][/ROW]
[ROW][C]34[/C][C]-0.071157[/C][C]-0.7564[/C][C]0.225488[/C][/ROW]
[ROW][C]35[/C][C]0.004809[/C][C]0.0511[/C][C]0.479661[/C][/ROW]
[ROW][C]36[/C][C]-0.010371[/C][C]-0.1102[/C][C]0.456203[/C][/ROW]
[ROW][C]37[/C][C]0.008139[/C][C]0.0865[/C][C]0.465605[/C][/ROW]
[ROW][C]38[/C][C]-0.038092[/C][C]-0.4049[/C][C]0.34315[/C][/ROW]
[ROW][C]39[/C][C]-0.047319[/C][C]-0.503[/C][C]0.307969[/C][/ROW]
[ROW][C]40[/C][C]0.051235[/C][C]0.5446[/C][C]0.293538[/C][/ROW]
[ROW][C]41[/C][C]-0.078337[/C][C]-0.8327[/C][C]0.203377[/C][/ROW]
[ROW][C]42[/C][C]-0.073551[/C][C]-0.7819[/C][C]0.217966[/C][/ROW]
[ROW][C]43[/C][C]0.069337[/C][C]0.7371[/C][C]0.231307[/C][/ROW]
[ROW][C]44[/C][C]-0.060322[/C][C]-0.6412[/C][C]0.261336[/C][/ROW]
[ROW][C]45[/C][C]-0.026388[/C][C]-0.2805[/C][C]0.389801[/C][/ROW]
[ROW][C]46[/C][C]0.086123[/C][C]0.9155[/C][C]0.180938[/C][/ROW]
[ROW][C]47[/C][C]0.038934[/C][C]0.4139[/C][C]0.339874[/C][/ROW]
[ROW][C]48[/C][C]-0.094972[/C][C]-1.0096[/C][C]0.157429[/C][/ROW]
[/TABLE]
Source: https://freestatistics.org/blog/index.php?pk=298424&T=2

Globally Unique Identifier (entire table): ba.freestatistics.org/blog/index.php?pk=298424&T=2

As an alternative you can also use a QR Code:  

The GUIDs for individual cells are displayed in the table below:

Partial Autocorrelation Function
Time lag kPACF(k)T-STATP-value
1-0.003724-0.03960.484245
2-0.266713-2.83520.002714
3-0.364335-3.87299e-05
4-0.58172-6.18380
5-0.086622-0.92080.179557
60.0169770.18050.428554
70.3471163.68990.000173
8-0.035187-0.3740.354536
90.1831351.94680.027023
10-0.227135-2.41450.008682
11-0.192805-2.04950.021362
120.383924.08114.2e-05
130.10311.0960.137712
14-0.099673-1.05950.145806
15-0.109417-1.16310.123617
16-0.016163-0.17180.431944
170.0500940.53250.29771
18-0.125425-1.33330.09256
19-0.101421-1.07810.141637
20-0.10696-1.1370.128971
21-0.040353-0.4290.334384
220.0217980.23170.408589
23-0.078535-0.83480.202784
240.0275530.29290.385071
25-0.018115-0.19260.423822
26-0.014285-0.15180.439788
270.0346950.36880.356479
280.046420.49340.311327
29-0.031824-0.33830.367886
30-0.120077-1.27640.102209
310.0903890.96080.16934
32-0.066109-0.70270.241829
33-0.017376-0.18470.426894
34-0.071157-0.75640.225488
350.0048090.05110.479661
36-0.010371-0.11020.456203
370.0081390.08650.465605
38-0.038092-0.40490.34315
39-0.047319-0.5030.307969
400.0512350.54460.293538
41-0.078337-0.83270.203377
42-0.073551-0.78190.217966
430.0693370.73710.231307
44-0.060322-0.64120.261336
45-0.026388-0.28050.389801
460.0861230.91550.180938
470.0389340.41390.339874
48-0.094972-1.00960.157429


Parameters (Session):
par1 = 48 ; par2 = 1 ; par3 = 1 ; par4 = 0 ; par5 = 1 ; par6 = White Noise ; par7 = 0.95 ;
Parameters (R input):
par1 = 48 ; par2 = 1 ; par3 = 1 ; par4 = 0 ; par5 = 1 ; par6 = White Noise ; par7 = 0.95 ; par8 = ;
R code (references can be found in the software module):
par8 <- ''
par7 <- '0.95'
par6 <- 'White Noise'
par5 <- '1'
par4 <- '0'
par3 <- '0'
par2 <- '1'
par1 <- '48'
if (par1 == 'Default') {
par1 = 10*log10(length(x))
} else {
par1 <- as.numeric(par1)
}
par2 <- as.numeric(par2)
par3 <- as.numeric(par3)
par4 <- as.numeric(par4)
par5 <- as.numeric(par5)
if (par6 == 'White Noise') par6 <- 'white' else par6 <- 'ma'
par7 <- as.numeric(par7)
if (par8 != '') par8 <- as.numeric(par8)
x <- na.omit(x)
ox <- x
if (par8 == '') {
if (par2 == 0) {
x <- log(x)
} else {
x <- (x ^ par2 - 1) / par2
}
} else {
x <- log(x,base=par8)
}
if (par3 > 0) x <- diff(x,lag=1,difference=par3)
if (par4 > 0) x <- diff(x,lag=par5,difference=par4)
bitmap(file='picts.png')
op <- par(mfrow=c(2,1))
plot(ox,type='l',main='Original Time Series',xlab='time',ylab='value')
if (par8=='') {
mytitle <- paste('Working Time Series (lambda=',par2,', d=',par3,', D=',par4,')',sep='')
mysub <- paste('(lambda=',par2,', d=',par3,', D=',par4,', CI=', par7, ', CI type=',par6,')',sep='')
} else {
mytitle <- paste('Working Time Series (base=',par8,', d=',par3,', D=',par4,')',sep='')
mysub <- paste('(base=',par8,', d=',par3,', D=',par4,', CI=', par7, ', CI type=',par6,')',sep='')
}
plot(x,type='l', main=mytitle,xlab='time',ylab='value')
par(op)
dev.off()
bitmap(file='pic1.png')
racf <- acf(x, par1, main='Autocorrelation', xlab='time lag', ylab='ACF', ci.type=par6, ci=par7, sub=mysub)
dev.off()
bitmap(file='pic2.png')
rpacf <- pacf(x,par1,main='Partial Autocorrelation',xlab='lags',ylab='PACF',sub=mysub)
dev.off()
(myacf <- c(racf$acf))
(mypacf <- c(rpacf$acf))
lengthx <- length(x)
sqrtn <- sqrt(lengthx)
load(file='createtable')
a<-table.start()
a<-table.row.start(a)
a<-table.element(a,'Autocorrelation Function',4,TRUE)
a<-table.row.end(a)
a<-table.row.start(a)
a<-table.element(a,'Time lag k',header=TRUE)
a<-table.element(a,'ACF(k)',header=TRUE)
a<-table.element(a,'T-STAT',header=TRUE)
a<-table.element(a,'P-value',header=TRUE)
a<-table.row.end(a)
for (i in 2:(par1+1)) {
a<-table.row.start(a)
a<-table.element(a,i-1,header=TRUE)
a<-table.element(a,round(myacf[i],6))
mytstat <- myacf[i]*sqrtn
a<-table.element(a,round(mytstat,4))
a<-table.element(a,round(1-pt(abs(mytstat),lengthx),6))
a<-table.row.end(a)
}
a<-table.end(a)
table.save(a,file='mytable.tab')
a<-table.start()
a<-table.row.start(a)
a<-table.element(a,'Partial Autocorrelation Function',4,TRUE)
a<-table.row.end(a)
a<-table.row.start(a)
a<-table.element(a,'Time lag k',header=TRUE)
a<-table.element(a,'PACF(k)',header=TRUE)
a<-table.element(a,'T-STAT',header=TRUE)
a<-table.element(a,'P-value',header=TRUE)
a<-table.row.end(a)
for (i in 1:par1) {
a<-table.row.start(a)
a<-table.element(a,i,header=TRUE)
a<-table.element(a,round(mypacf[i],6))
mytstat <- mypacf[i]*sqrtn
a<-table.element(a,round(mytstat,4))
a<-table.element(a,round(1-pt(abs(mytstat),lengthx),6))
a<-table.row.end(a)
}
a<-table.end(a)
table.save(a,file='mytable1.tab')