Free Statistics

of Irreproducible Research!

Author's title

Author*The author of this computation has been verified*
R Software Modulerwasp_decompose.wasp
Title produced by softwareClassical Decomposition
Date of computationWed, 07 Dec 2016 19:21:30 +0100
Cite this page as followsStatistical Computations at FreeStatistics.org, Office for Research Development and Education, URL https://freestatistics.org/blog/index.php?v=date/2016/Dec/07/t1481135378iij8oyhmojow7oc.htm/, Retrieved Fri, 17 May 2024 19:18:31 +0000
Statistical Computations at FreeStatistics.org, Office for Research Development and Education, URL https://freestatistics.org/blog/index.php?pk=298284, Retrieved Fri, 17 May 2024 19:18:31 +0000
QR Codes:

Original text written by user:
IsPrivate?No (this computation is public)
User-defined keywords
Estimated Impact82
Family? (F = Feedback message, R = changed R code, M = changed R Module, P = changed Parameters, D = changed Data)
-       [Classical Decomposition] [Classical Decompo...] [2016-12-07 18:21:30] [153c3207812fd13fe5ceee3276565119] [Current]
Feedback Forum

Post a new message
Dataseries X:
2707
3064
3484
3895
3916
4108
4316
4537
4641
5026
5043
5558
6114
6445
6770
6957
7058
7112
7156


Summary of computational transaction
Raw Input view raw input (R code)
Raw Outputview raw output of R engine
Computing time2 seconds
R ServerBig Analytics Cloud Computing Center

\begin{tabular}{lllllllll}
\hline
Summary of computational transaction \tabularnewline
Raw Input view raw input (R code)  \tabularnewline
Raw Outputview raw output of R engine  \tabularnewline
Computing time2 seconds \tabularnewline
R ServerBig Analytics Cloud Computing Center \tabularnewline
\hline
\end{tabular}
%Source: https://freestatistics.org/blog/index.php?pk=298284&T=0

[TABLE]
[ROW]
Summary of computational transaction[/C][/ROW] [ROW]Raw Input[/C] view raw input (R code) [/C][/ROW] [ROW]Raw Output[/C]view raw output of R engine [/C][/ROW] [ROW]Computing time[/C]2 seconds[/C][/ROW] [ROW]R Server[/C]Big Analytics Cloud Computing Center[/C][/ROW] [/TABLE] Source: https://freestatistics.org/blog/index.php?pk=298284&T=0

Globally Unique Identifier (entire table): ba.freestatistics.org/blog/index.php?pk=298284&T=0

As an alternative you can also use a QR Code:  

The GUIDs for individual cells are displayed in the table below:

Summary of computational transaction
Raw Input view raw input (R code)
Raw Outputview raw output of R engine
Computing time2 seconds
R ServerBig Analytics Cloud Computing Center


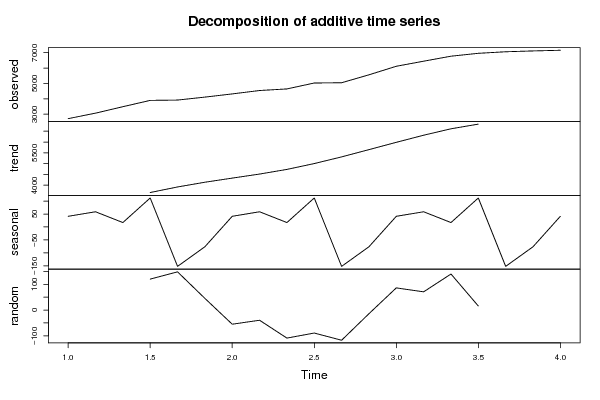
Classical Decomposition by Moving Averages
tObservationsFitTrendSeasonalRandom
12707NANA41.0995NA
23064NANA58.5995NA
33484NANA17.0162NA
438953774.883663.08111.794120.123
539163767.813919.92-152.109148.192
641084062.684139.08-76.400545.3171
743164370.854329.7541.0995-54.8495
845374576.524517.9258.5995-39.5162
946414749.684732.6717.0162-108.683
1050265115.135003.33111.794-89.1273
1150435160.065312.17-152.109-117.058
1255585572.185648.58-76.4005-14.1829
1361146028.025986.9241.099585.9838
1464456374.356315.7558.599570.6505
1567706630.186613.1717.0162139.817
1669576941.296829.5111.79415.706
177058NANA-152.109NA
187112NANA-76.4005NA
197156NANA41.0995NA

\begin{tabular}{lllllllll}
\hline
Classical Decomposition by Moving Averages \tabularnewline
t & Observations & Fit & Trend & Seasonal & Random \tabularnewline
1 & 2707 & NA & NA & 41.0995 & NA \tabularnewline
2 & 3064 & NA & NA & 58.5995 & NA \tabularnewline
3 & 3484 & NA & NA & 17.0162 & NA \tabularnewline
4 & 3895 & 3774.88 & 3663.08 & 111.794 & 120.123 \tabularnewline
5 & 3916 & 3767.81 & 3919.92 & -152.109 & 148.192 \tabularnewline
6 & 4108 & 4062.68 & 4139.08 & -76.4005 & 45.3171 \tabularnewline
7 & 4316 & 4370.85 & 4329.75 & 41.0995 & -54.8495 \tabularnewline
8 & 4537 & 4576.52 & 4517.92 & 58.5995 & -39.5162 \tabularnewline
9 & 4641 & 4749.68 & 4732.67 & 17.0162 & -108.683 \tabularnewline
10 & 5026 & 5115.13 & 5003.33 & 111.794 & -89.1273 \tabularnewline
11 & 5043 & 5160.06 & 5312.17 & -152.109 & -117.058 \tabularnewline
12 & 5558 & 5572.18 & 5648.58 & -76.4005 & -14.1829 \tabularnewline
13 & 6114 & 6028.02 & 5986.92 & 41.0995 & 85.9838 \tabularnewline
14 & 6445 & 6374.35 & 6315.75 & 58.5995 & 70.6505 \tabularnewline
15 & 6770 & 6630.18 & 6613.17 & 17.0162 & 139.817 \tabularnewline
16 & 6957 & 6941.29 & 6829.5 & 111.794 & 15.706 \tabularnewline
17 & 7058 & NA & NA & -152.109 & NA \tabularnewline
18 & 7112 & NA & NA & -76.4005 & NA \tabularnewline
19 & 7156 & NA & NA & 41.0995 & NA \tabularnewline
\hline
\end{tabular}
%Source: https://freestatistics.org/blog/index.php?pk=298284&T=1

[TABLE]
[ROW][C]Classical Decomposition by Moving Averages[/C][/ROW]
[ROW][C]t[/C][C]Observations[/C][C]Fit[/C][C]Trend[/C][C]Seasonal[/C][C]Random[/C][/ROW]
[ROW][C]1[/C][C]2707[/C][C]NA[/C][C]NA[/C][C]41.0995[/C][C]NA[/C][/ROW]
[ROW][C]2[/C][C]3064[/C][C]NA[/C][C]NA[/C][C]58.5995[/C][C]NA[/C][/ROW]
[ROW][C]3[/C][C]3484[/C][C]NA[/C][C]NA[/C][C]17.0162[/C][C]NA[/C][/ROW]
[ROW][C]4[/C][C]3895[/C][C]3774.88[/C][C]3663.08[/C][C]111.794[/C][C]120.123[/C][/ROW]
[ROW][C]5[/C][C]3916[/C][C]3767.81[/C][C]3919.92[/C][C]-152.109[/C][C]148.192[/C][/ROW]
[ROW][C]6[/C][C]4108[/C][C]4062.68[/C][C]4139.08[/C][C]-76.4005[/C][C]45.3171[/C][/ROW]
[ROW][C]7[/C][C]4316[/C][C]4370.85[/C][C]4329.75[/C][C]41.0995[/C][C]-54.8495[/C][/ROW]
[ROW][C]8[/C][C]4537[/C][C]4576.52[/C][C]4517.92[/C][C]58.5995[/C][C]-39.5162[/C][/ROW]
[ROW][C]9[/C][C]4641[/C][C]4749.68[/C][C]4732.67[/C][C]17.0162[/C][C]-108.683[/C][/ROW]
[ROW][C]10[/C][C]5026[/C][C]5115.13[/C][C]5003.33[/C][C]111.794[/C][C]-89.1273[/C][/ROW]
[ROW][C]11[/C][C]5043[/C][C]5160.06[/C][C]5312.17[/C][C]-152.109[/C][C]-117.058[/C][/ROW]
[ROW][C]12[/C][C]5558[/C][C]5572.18[/C][C]5648.58[/C][C]-76.4005[/C][C]-14.1829[/C][/ROW]
[ROW][C]13[/C][C]6114[/C][C]6028.02[/C][C]5986.92[/C][C]41.0995[/C][C]85.9838[/C][/ROW]
[ROW][C]14[/C][C]6445[/C][C]6374.35[/C][C]6315.75[/C][C]58.5995[/C][C]70.6505[/C][/ROW]
[ROW][C]15[/C][C]6770[/C][C]6630.18[/C][C]6613.17[/C][C]17.0162[/C][C]139.817[/C][/ROW]
[ROW][C]16[/C][C]6957[/C][C]6941.29[/C][C]6829.5[/C][C]111.794[/C][C]15.706[/C][/ROW]
[ROW][C]17[/C][C]7058[/C][C]NA[/C][C]NA[/C][C]-152.109[/C][C]NA[/C][/ROW]
[ROW][C]18[/C][C]7112[/C][C]NA[/C][C]NA[/C][C]-76.4005[/C][C]NA[/C][/ROW]
[ROW][C]19[/C][C]7156[/C][C]NA[/C][C]NA[/C][C]41.0995[/C][C]NA[/C][/ROW]
[/TABLE]
Source: https://freestatistics.org/blog/index.php?pk=298284&T=1

Globally Unique Identifier (entire table): ba.freestatistics.org/blog/index.php?pk=298284&T=1

As an alternative you can also use a QR Code:  

The GUIDs for individual cells are displayed in the table below:

Classical Decomposition by Moving Averages
tObservationsFitTrendSeasonalRandom
12707NANA41.0995NA
23064NANA58.5995NA
33484NANA17.0162NA
438953774.883663.08111.794120.123
539163767.813919.92-152.109148.192
641084062.684139.08-76.400545.3171
743164370.854329.7541.0995-54.8495
845374576.524517.9258.5995-39.5162
946414749.684732.6717.0162-108.683
1050265115.135003.33111.794-89.1273
1150435160.065312.17-152.109-117.058
1255585572.185648.58-76.4005-14.1829
1361146028.025986.9241.099585.9838
1464456374.356315.7558.599570.6505
1567706630.186613.1717.0162139.817
1669576941.296829.5111.79415.706
177058NANA-152.109NA
187112NANA-76.4005NA
197156NANA41.0995NA


Parameters (Session):
par1 = 121212additiveadditiveadditiveadditive ; par2 = periodic18Double126126 ; par3 = 0BFGSadditive ; par4 = 1212 ; par5 = 1 ; par7 = 1 ; par8 = FALSE ;
Parameters (R input):
par1 = additive ; par2 = 6 ;
R code (references can be found in the software module):
par2 <- '12'
par1 <- 'additive'
par2 <- as.numeric(par2)
x <- ts(x,freq=par2)
m <- decompose(x,type=par1)
m$figure
bitmap(file='test1.png')
plot(m)
dev.off()
mylagmax <- length(x)/2
bitmap(file='test2.png')
op <- par(mfrow = c(2,2))
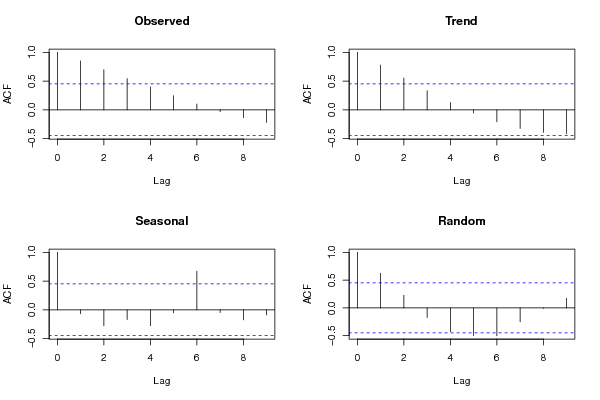
acf(as.numeric(x),lag.max = mylagmax,main='Observed')
acf(as.numeric(m$trend),na.action=na.pass,lag.max = mylagmax,main='Trend')
acf(as.numeric(m$seasonal),na.action=na.pass,lag.max = mylagmax,main='Seasonal')
acf(as.numeric(m$random),na.action=na.pass,lag.max = mylagmax,main='Random')
par(op)
dev.off()
bitmap(file='test3.png')
op <- par(mfrow = c(2,2))
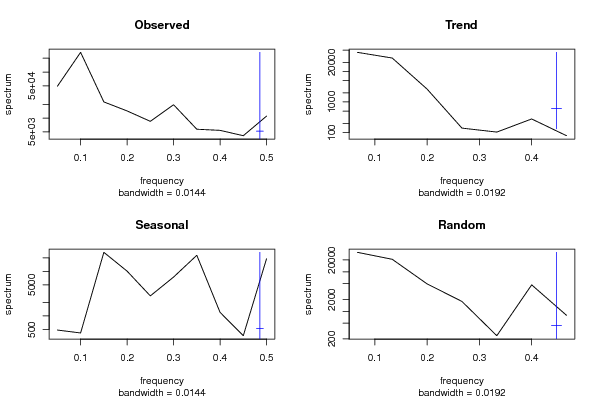
spectrum(as.numeric(x),main='Observed')
spectrum(as.numeric(m$trend[!is.na(m$trend)]),main='Trend')
spectrum(as.numeric(m$seasonal[!is.na(m$seasonal)]),main='Seasonal')
spectrum(as.numeric(m$random[!is.na(m$random)]),main='Random')
par(op)
dev.off()
bitmap(file='test4.png')
op <- par(mfrow = c(2,2))
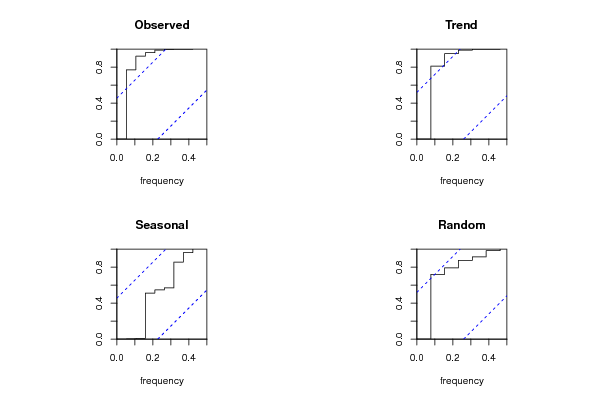
cpgram(as.numeric(x),main='Observed')
cpgram(as.numeric(m$trend[!is.na(m$trend)]),main='Trend')
cpgram(as.numeric(m$seasonal[!is.na(m$seasonal)]),main='Seasonal')
cpgram(as.numeric(m$random[!is.na(m$random)]),main='Random')
par(op)
dev.off()
load(file='createtable')
a<-table.start()
a<-table.row.start(a)
a<-table.element(a,'Classical Decomposition by Moving Averages',6,TRUE)
a<-table.row.end(a)
a<-table.row.start(a)
a<-table.element(a,'t',header=TRUE)
a<-table.element(a,'Observations',header=TRUE)
a<-table.element(a,'Fit',header=TRUE)
a<-table.element(a,'Trend',header=TRUE)
a<-table.element(a,'Seasonal',header=TRUE)
a<-table.element(a,'Random',header=TRUE)
a<-table.row.end(a)
for (i in 1:length(m$trend)) {
a<-table.row.start(a)
a<-table.element(a,i,header=TRUE)
a<-table.element(a,x[i])
if (par1 == 'additive') a<-table.element(a,signif(m$trend[i]+m$seasonal[i],6)) else a<-table.element(a,signif(m$trend[i]*m$seasonal[i],6))
a<-table.element(a,signif(m$trend[i],6))
a<-table.element(a,signif(m$seasonal[i],6))
a<-table.element(a,signif(m$random[i],6))
a<-table.row.end(a)
}
a<-table.end(a)
table.save(a,file='mytable.tab')