Free Statistics

of Irreproducible Research!

Author's title

Author*The author of this computation has been verified*
R Software Modulerwasp_exponentialsmoothing.wasp
Title produced by softwareExponential Smoothing
Date of computationWed, 07 Dec 2016 16:40:56 +0100
Cite this page as followsStatistical Computations at FreeStatistics.org, Office for Research Development and Education, URL https://freestatistics.org/blog/index.php?v=date/2016/Dec/07/t1481125359mr5xi9shemwb8vv.htm/, Retrieved Fri, 17 May 2024 12:50:56 +0000
Statistical Computations at FreeStatistics.org, Office for Research Development and Education, URL https://freestatistics.org/blog/index.php?pk=298208, Retrieved Fri, 17 May 2024 12:50:56 +0000
QR Codes:

Original text written by user:
IsPrivate?No (this computation is public)
User-defined keywords
Estimated Impact61
Family? (F = Feedback message, R = changed R code, M = changed R Module, P = changed Parameters, D = changed Data)
-       [Exponential Smoothing] [Exponential Smoot...] [2016-12-07 15:40:56] [3b055ff671ad33431c4331443bac114d] [Current]
Feedback Forum

Post a new message
Dataseries X:
9137.8
9009.4
8926.6
9145
9186.2
9152.2
9093.6
9199.2
9310.6
9282
9248.4
9341.6
9478.8
9438
9374.6
9488.8
9631.8
9588.4
9514.6
9623.2
9744.6
9685.8
9598
9703.4
9817.8
9762.6
9669.6
9789.2
9917.4
9864.4
9779.2
9898.8
10048.8
9983.4
9913.4
10031.6
10184.6
10125
10065.4
10188.6
10350.4
10320.6
10232.6
10357.2
10520.2
10473.8
10407
10536
10700.2
10664.2
10606
10716.6
10882.8
10849.4
10794
10907.8


Summary of computational transaction
Raw Input view raw input (R code)
Raw Outputview raw output of R engine
Computing time1 seconds
R ServerBig Analytics Cloud Computing Center

\begin{tabular}{lllllllll}
\hline
Summary of computational transaction \tabularnewline
Raw Input view raw input (R code)  \tabularnewline
Raw Outputview raw output of R engine  \tabularnewline
Computing time1 seconds \tabularnewline
R ServerBig Analytics Cloud Computing Center \tabularnewline
\hline
\end{tabular}
%Source: https://freestatistics.org/blog/index.php?pk=298208&T=0

[TABLE]
[ROW]
Summary of computational transaction[/C][/ROW] [ROW]Raw Input[/C] view raw input (R code) [/C][/ROW] [ROW]Raw Output[/C]view raw output of R engine [/C][/ROW] [ROW]Computing time[/C]1 seconds[/C][/ROW] [ROW]R Server[/C]Big Analytics Cloud Computing Center[/C][/ROW] [/TABLE] Source: https://freestatistics.org/blog/index.php?pk=298208&T=0

Globally Unique Identifier (entire table): ba.freestatistics.org/blog/index.php?pk=298208&T=0

As an alternative you can also use a QR Code:  

The GUIDs for individual cells are displayed in the table below:

Summary of computational transaction
Raw Input view raw input (R code)
Raw Outputview raw output of R engine
Computing time1 seconds
R ServerBig Analytics Cloud Computing Center


Estimated Parameters of Exponential Smoothing
ParameterValue
alpha1
beta0
gamma0

\begin{tabular}{lllllllll}
\hline
Estimated Parameters of Exponential Smoothing \tabularnewline
Parameter & Value \tabularnewline
alpha & 1 \tabularnewline
beta & 0 \tabularnewline
gamma & 0 \tabularnewline
\hline
\end{tabular}
%Source: https://freestatistics.org/blog/index.php?pk=298208&T=1

[TABLE]
[ROW][C]Estimated Parameters of Exponential Smoothing[/C][/ROW]
[ROW][C]Parameter[/C][C]Value[/C][/ROW]
[ROW][C]alpha[/C][C]1[/C][/ROW]
[ROW][C]beta[/C][C]0[/C][/ROW]
[ROW][C]gamma[/C][C]0[/C][/ROW]
[/TABLE]
Source: https://freestatistics.org/blog/index.php?pk=298208&T=1

Globally Unique Identifier (entire table): ba.freestatistics.org/blog/index.php?pk=298208&T=1

As an alternative you can also use a QR Code:  

The GUIDs for individual cells are displayed in the table below:

Estimated Parameters of Exponential Smoothing
ParameterValue
alpha1
beta0
gamma0


Interpolation Forecasts of Exponential Smoothing
tObservedFittedResiduals
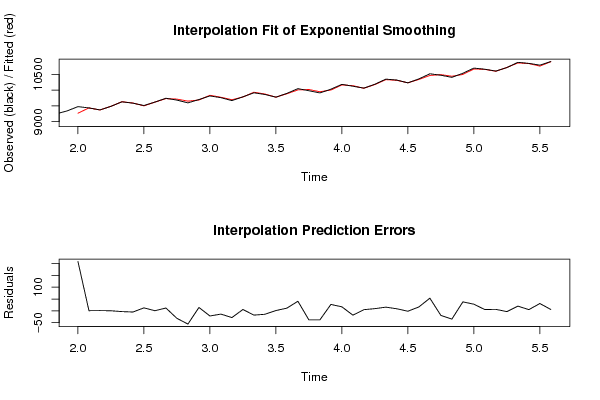
139478.89270.26875208.531249999996
1494389437.305681818180.694318181816925
159374.69373.364015151511.23598484848844
169488.89488.405681818180.394318181817653
179631.89634.92234848485-3.12234848484877
189588.49593.27234848485-4.87234848485059
199514.69501.9473484848512.6526515151509
209623.29622.647348484850.55265151515232
219744.69732.5890151515112.0109848484863
229685.89717.52234848485-31.722348484851
2395989653.82234848485-55.8223484848459
249703.49688.9723484848514.4276515151487
259817.89839.39734848485-21.5973484848473
269762.69776.30568181818-13.7056818181827
279669.69697.96401515151-28.3640151515119
289789.29783.405681818185.79431818181911
299917.49935.32234848485-17.9223484848499
309864.49878.87234848485-14.472348484851
319779.29777.947348484851.25265151515123
329898.89887.2473484848511.5526515151505
3310048.810008.189015151540.6109848484866
349983.410021.7223484848-38.3223484848495
359913.49951.42234848485-38.0223484848466
3610031.610004.372348484927.2276515151498
3710184.610167.597348484817.002651515153
381012510143.1056818182-18.1056818181842
3910065.410060.36401515155.03598484848771
4010188.610179.20568181829.39431818181947
4110350.410334.722348484815.6776515151505
4210320.610311.87234848498.72765151514977
4310232.610234.1473484849-1.54734848484986
4410357.210340.647348484816.5526515151523
4510520.210466.589015151553.6109848484866
4610473.810493.1223484849-19.3223484848513
471040710441.8223484848-34.8223484848459
481053610497.972348484938.027651515149
4910700.210671.997348484828.2026515151538
5010664.210658.70568181825.4943181818162
511060610599.56401515156.43598484848735
5210716.610719.8056818182-3.20568181818089
5310882.810862.722348484820.0776515151501
5410849.410844.27234848495.12765151514941
551079410762.947348484831.0526515151505
5610907.810902.04734848485.75265151515123

\begin{tabular}{lllllllll}
\hline
Interpolation Forecasts of Exponential Smoothing \tabularnewline
t & Observed & Fitted & Residuals \tabularnewline
13 & 9478.8 & 9270.26875 & 208.531249999996 \tabularnewline
14 & 9438 & 9437.30568181818 & 0.694318181816925 \tabularnewline
15 & 9374.6 & 9373.36401515151 & 1.23598484848844 \tabularnewline
16 & 9488.8 & 9488.40568181818 & 0.394318181817653 \tabularnewline
17 & 9631.8 & 9634.92234848485 & -3.12234848484877 \tabularnewline
18 & 9588.4 & 9593.27234848485 & -4.87234848485059 \tabularnewline
19 & 9514.6 & 9501.94734848485 & 12.6526515151509 \tabularnewline
20 & 9623.2 & 9622.64734848485 & 0.55265151515232 \tabularnewline
21 & 9744.6 & 9732.58901515151 & 12.0109848484863 \tabularnewline
22 & 9685.8 & 9717.52234848485 & -31.722348484851 \tabularnewline
23 & 9598 & 9653.82234848485 & -55.8223484848459 \tabularnewline
24 & 9703.4 & 9688.97234848485 & 14.4276515151487 \tabularnewline
25 & 9817.8 & 9839.39734848485 & -21.5973484848473 \tabularnewline
26 & 9762.6 & 9776.30568181818 & -13.7056818181827 \tabularnewline
27 & 9669.6 & 9697.96401515151 & -28.3640151515119 \tabularnewline
28 & 9789.2 & 9783.40568181818 & 5.79431818181911 \tabularnewline
29 & 9917.4 & 9935.32234848485 & -17.9223484848499 \tabularnewline
30 & 9864.4 & 9878.87234848485 & -14.472348484851 \tabularnewline
31 & 9779.2 & 9777.94734848485 & 1.25265151515123 \tabularnewline
32 & 9898.8 & 9887.24734848485 & 11.5526515151505 \tabularnewline
33 & 10048.8 & 10008.1890151515 & 40.6109848484866 \tabularnewline
34 & 9983.4 & 10021.7223484848 & -38.3223484848495 \tabularnewline
35 & 9913.4 & 9951.42234848485 & -38.0223484848466 \tabularnewline
36 & 10031.6 & 10004.3723484849 & 27.2276515151498 \tabularnewline
37 & 10184.6 & 10167.5973484848 & 17.002651515153 \tabularnewline
38 & 10125 & 10143.1056818182 & -18.1056818181842 \tabularnewline
39 & 10065.4 & 10060.3640151515 & 5.03598484848771 \tabularnewline
40 & 10188.6 & 10179.2056818182 & 9.39431818181947 \tabularnewline
41 & 10350.4 & 10334.7223484848 & 15.6776515151505 \tabularnewline
42 & 10320.6 & 10311.8723484849 & 8.72765151514977 \tabularnewline
43 & 10232.6 & 10234.1473484849 & -1.54734848484986 \tabularnewline
44 & 10357.2 & 10340.6473484848 & 16.5526515151523 \tabularnewline
45 & 10520.2 & 10466.5890151515 & 53.6109848484866 \tabularnewline
46 & 10473.8 & 10493.1223484849 & -19.3223484848513 \tabularnewline
47 & 10407 & 10441.8223484848 & -34.8223484848459 \tabularnewline
48 & 10536 & 10497.9723484849 & 38.027651515149 \tabularnewline
49 & 10700.2 & 10671.9973484848 & 28.2026515151538 \tabularnewline
50 & 10664.2 & 10658.7056818182 & 5.4943181818162 \tabularnewline
51 & 10606 & 10599.5640151515 & 6.43598484848735 \tabularnewline
52 & 10716.6 & 10719.8056818182 & -3.20568181818089 \tabularnewline
53 & 10882.8 & 10862.7223484848 & 20.0776515151501 \tabularnewline
54 & 10849.4 & 10844.2723484849 & 5.12765151514941 \tabularnewline
55 & 10794 & 10762.9473484848 & 31.0526515151505 \tabularnewline
56 & 10907.8 & 10902.0473484848 & 5.75265151515123 \tabularnewline
\hline
\end{tabular}
%Source: https://freestatistics.org/blog/index.php?pk=298208&T=2

[TABLE]
[ROW][C]Interpolation Forecasts of Exponential Smoothing[/C][/ROW]
[ROW][C]t[/C][C]Observed[/C][C]Fitted[/C][C]Residuals[/C][/ROW]
[ROW][C]13[/C][C]9478.8[/C][C]9270.26875[/C][C]208.531249999996[/C][/ROW]
[ROW][C]14[/C][C]9438[/C][C]9437.30568181818[/C][C]0.694318181816925[/C][/ROW]
[ROW][C]15[/C][C]9374.6[/C][C]9373.36401515151[/C][C]1.23598484848844[/C][/ROW]
[ROW][C]16[/C][C]9488.8[/C][C]9488.40568181818[/C][C]0.394318181817653[/C][/ROW]
[ROW][C]17[/C][C]9631.8[/C][C]9634.92234848485[/C][C]-3.12234848484877[/C][/ROW]
[ROW][C]18[/C][C]9588.4[/C][C]9593.27234848485[/C][C]-4.87234848485059[/C][/ROW]
[ROW][C]19[/C][C]9514.6[/C][C]9501.94734848485[/C][C]12.6526515151509[/C][/ROW]
[ROW][C]20[/C][C]9623.2[/C][C]9622.64734848485[/C][C]0.55265151515232[/C][/ROW]
[ROW][C]21[/C][C]9744.6[/C][C]9732.58901515151[/C][C]12.0109848484863[/C][/ROW]
[ROW][C]22[/C][C]9685.8[/C][C]9717.52234848485[/C][C]-31.722348484851[/C][/ROW]
[ROW][C]23[/C][C]9598[/C][C]9653.82234848485[/C][C]-55.8223484848459[/C][/ROW]
[ROW][C]24[/C][C]9703.4[/C][C]9688.97234848485[/C][C]14.4276515151487[/C][/ROW]
[ROW][C]25[/C][C]9817.8[/C][C]9839.39734848485[/C][C]-21.5973484848473[/C][/ROW]
[ROW][C]26[/C][C]9762.6[/C][C]9776.30568181818[/C][C]-13.7056818181827[/C][/ROW]
[ROW][C]27[/C][C]9669.6[/C][C]9697.96401515151[/C][C]-28.3640151515119[/C][/ROW]
[ROW][C]28[/C][C]9789.2[/C][C]9783.40568181818[/C][C]5.79431818181911[/C][/ROW]
[ROW][C]29[/C][C]9917.4[/C][C]9935.32234848485[/C][C]-17.9223484848499[/C][/ROW]
[ROW][C]30[/C][C]9864.4[/C][C]9878.87234848485[/C][C]-14.472348484851[/C][/ROW]
[ROW][C]31[/C][C]9779.2[/C][C]9777.94734848485[/C][C]1.25265151515123[/C][/ROW]
[ROW][C]32[/C][C]9898.8[/C][C]9887.24734848485[/C][C]11.5526515151505[/C][/ROW]
[ROW][C]33[/C][C]10048.8[/C][C]10008.1890151515[/C][C]40.6109848484866[/C][/ROW]
[ROW][C]34[/C][C]9983.4[/C][C]10021.7223484848[/C][C]-38.3223484848495[/C][/ROW]
[ROW][C]35[/C][C]9913.4[/C][C]9951.42234848485[/C][C]-38.0223484848466[/C][/ROW]
[ROW][C]36[/C][C]10031.6[/C][C]10004.3723484849[/C][C]27.2276515151498[/C][/ROW]
[ROW][C]37[/C][C]10184.6[/C][C]10167.5973484848[/C][C]17.002651515153[/C][/ROW]
[ROW][C]38[/C][C]10125[/C][C]10143.1056818182[/C][C]-18.1056818181842[/C][/ROW]
[ROW][C]39[/C][C]10065.4[/C][C]10060.3640151515[/C][C]5.03598484848771[/C][/ROW]
[ROW][C]40[/C][C]10188.6[/C][C]10179.2056818182[/C][C]9.39431818181947[/C][/ROW]
[ROW][C]41[/C][C]10350.4[/C][C]10334.7223484848[/C][C]15.6776515151505[/C][/ROW]
[ROW][C]42[/C][C]10320.6[/C][C]10311.8723484849[/C][C]8.72765151514977[/C][/ROW]
[ROW][C]43[/C][C]10232.6[/C][C]10234.1473484849[/C][C]-1.54734848484986[/C][/ROW]
[ROW][C]44[/C][C]10357.2[/C][C]10340.6473484848[/C][C]16.5526515151523[/C][/ROW]
[ROW][C]45[/C][C]10520.2[/C][C]10466.5890151515[/C][C]53.6109848484866[/C][/ROW]
[ROW][C]46[/C][C]10473.8[/C][C]10493.1223484849[/C][C]-19.3223484848513[/C][/ROW]
[ROW][C]47[/C][C]10407[/C][C]10441.8223484848[/C][C]-34.8223484848459[/C][/ROW]
[ROW][C]48[/C][C]10536[/C][C]10497.9723484849[/C][C]38.027651515149[/C][/ROW]
[ROW][C]49[/C][C]10700.2[/C][C]10671.9973484848[/C][C]28.2026515151538[/C][/ROW]
[ROW][C]50[/C][C]10664.2[/C][C]10658.7056818182[/C][C]5.4943181818162[/C][/ROW]
[ROW][C]51[/C][C]10606[/C][C]10599.5640151515[/C][C]6.43598484848735[/C][/ROW]
[ROW][C]52[/C][C]10716.6[/C][C]10719.8056818182[/C][C]-3.20568181818089[/C][/ROW]
[ROW][C]53[/C][C]10882.8[/C][C]10862.7223484848[/C][C]20.0776515151501[/C][/ROW]
[ROW][C]54[/C][C]10849.4[/C][C]10844.2723484849[/C][C]5.12765151514941[/C][/ROW]
[ROW][C]55[/C][C]10794[/C][C]10762.9473484848[/C][C]31.0526515151505[/C][/ROW]
[ROW][C]56[/C][C]10907.8[/C][C]10902.0473484848[/C][C]5.75265151515123[/C][/ROW]
[/TABLE]
Source: https://freestatistics.org/blog/index.php?pk=298208&T=2

Globally Unique Identifier (entire table): ba.freestatistics.org/blog/index.php?pk=298208&T=2

As an alternative you can also use a QR Code:  

The GUIDs for individual cells are displayed in the table below:

Interpolation Forecasts of Exponential Smoothing
tObservedFittedResiduals
139478.89270.26875208.531249999996
1494389437.305681818180.694318181816925
159374.69373.364015151511.23598484848844
169488.89488.405681818180.394318181817653
179631.89634.92234848485-3.12234848484877
189588.49593.27234848485-4.87234848485059
199514.69501.9473484848512.6526515151509
209623.29622.647348484850.55265151515232
219744.69732.5890151515112.0109848484863
229685.89717.52234848485-31.722348484851
2395989653.82234848485-55.8223484848459
249703.49688.9723484848514.4276515151487
259817.89839.39734848485-21.5973484848473
269762.69776.30568181818-13.7056818181827
279669.69697.96401515151-28.3640151515119
289789.29783.405681818185.79431818181911
299917.49935.32234848485-17.9223484848499
309864.49878.87234848485-14.472348484851
319779.29777.947348484851.25265151515123
329898.89887.2473484848511.5526515151505
3310048.810008.189015151540.6109848484866
349983.410021.7223484848-38.3223484848495
359913.49951.42234848485-38.0223484848466
3610031.610004.372348484927.2276515151498
3710184.610167.597348484817.002651515153
381012510143.1056818182-18.1056818181842
3910065.410060.36401515155.03598484848771
4010188.610179.20568181829.39431818181947
4110350.410334.722348484815.6776515151505
4210320.610311.87234848498.72765151514977
4310232.610234.1473484849-1.54734848484986
4410357.210340.647348484816.5526515151523
4510520.210466.589015151553.6109848484866
4610473.810493.1223484849-19.3223484848513
471040710441.8223484848-34.8223484848459
481053610497.972348484938.027651515149
4910700.210671.997348484828.2026515151538
5010664.210658.70568181825.4943181818162
511060610599.56401515156.43598484848735
5210716.610719.8056818182-3.20568181818089
5310882.810862.722348484820.0776515151501
5410849.410844.27234848495.12765151514941
551079410762.947348484831.0526515151505
5610907.810902.04734848485.75265151515123


Extrapolation Forecasts of Exponential Smoothing
tForecast95% Lower Bound95% Upper Bound
5711017.189015151510941.785595231511092.5924350716
5810990.111363636410883.474824536111096.7479027366
5910958.133712121210827.531157755211088.7362664872
6011049.106060606110898.29922076611199.9129004461
6111185.103409090911016.496236413711353.7105817681
6211143.609090909110958.909187244211328.308994574
6311078.973106060610879.474408948411278.4718031728
6411192.778787878810979.505709678311406.0518660793
6511338.901136363611112.690876603511565.1113961238
6611300.373484848511061.92693453511538.8200351619
6711213.920833333310963.835981548911464.0056851177
6811321.968181818211060.763073086211583.1732905501

\begin{tabular}{lllllllll}
\hline
Extrapolation Forecasts of Exponential Smoothing \tabularnewline
t & Forecast & 95% Lower Bound & 95% Upper Bound \tabularnewline
57 & 11017.1890151515 & 10941.7855952315 & 11092.5924350716 \tabularnewline
58 & 10990.1113636364 & 10883.4748245361 & 11096.7479027366 \tabularnewline
59 & 10958.1337121212 & 10827.5311577552 & 11088.7362664872 \tabularnewline
60 & 11049.1060606061 & 10898.299220766 & 11199.9129004461 \tabularnewline
61 & 11185.1034090909 & 11016.4962364137 & 11353.7105817681 \tabularnewline
62 & 11143.6090909091 & 10958.9091872442 & 11328.308994574 \tabularnewline
63 & 11078.9731060606 & 10879.4744089484 & 11278.4718031728 \tabularnewline
64 & 11192.7787878788 & 10979.5057096783 & 11406.0518660793 \tabularnewline
65 & 11338.9011363636 & 11112.6908766035 & 11565.1113961238 \tabularnewline
66 & 11300.3734848485 & 11061.926934535 & 11538.8200351619 \tabularnewline
67 & 11213.9208333333 & 10963.8359815489 & 11464.0056851177 \tabularnewline
68 & 11321.9681818182 & 11060.7630730862 & 11583.1732905501 \tabularnewline
\hline
\end{tabular}
%Source: https://freestatistics.org/blog/index.php?pk=298208&T=3

[TABLE]
[ROW][C]Extrapolation Forecasts of Exponential Smoothing[/C][/ROW]
[ROW][C]t[/C][C]Forecast[/C][C]95% Lower Bound[/C][C]95% Upper Bound[/C][/ROW]
[ROW][C]57[/C][C]11017.1890151515[/C][C]10941.7855952315[/C][C]11092.5924350716[/C][/ROW]
[ROW][C]58[/C][C]10990.1113636364[/C][C]10883.4748245361[/C][C]11096.7479027366[/C][/ROW]
[ROW][C]59[/C][C]10958.1337121212[/C][C]10827.5311577552[/C][C]11088.7362664872[/C][/ROW]
[ROW][C]60[/C][C]11049.1060606061[/C][C]10898.299220766[/C][C]11199.9129004461[/C][/ROW]
[ROW][C]61[/C][C]11185.1034090909[/C][C]11016.4962364137[/C][C]11353.7105817681[/C][/ROW]
[ROW][C]62[/C][C]11143.6090909091[/C][C]10958.9091872442[/C][C]11328.308994574[/C][/ROW]
[ROW][C]63[/C][C]11078.9731060606[/C][C]10879.4744089484[/C][C]11278.4718031728[/C][/ROW]
[ROW][C]64[/C][C]11192.7787878788[/C][C]10979.5057096783[/C][C]11406.0518660793[/C][/ROW]
[ROW][C]65[/C][C]11338.9011363636[/C][C]11112.6908766035[/C][C]11565.1113961238[/C][/ROW]
[ROW][C]66[/C][C]11300.3734848485[/C][C]11061.926934535[/C][C]11538.8200351619[/C][/ROW]
[ROW][C]67[/C][C]11213.9208333333[/C][C]10963.8359815489[/C][C]11464.0056851177[/C][/ROW]
[ROW][C]68[/C][C]11321.9681818182[/C][C]11060.7630730862[/C][C]11583.1732905501[/C][/ROW]
[/TABLE]
Source: https://freestatistics.org/blog/index.php?pk=298208&T=3

Globally Unique Identifier (entire table): ba.freestatistics.org/blog/index.php?pk=298208&T=3

As an alternative you can also use a QR Code:  

The GUIDs for individual cells are displayed in the table below:

Extrapolation Forecasts of Exponential Smoothing
tForecast95% Lower Bound95% Upper Bound
5711017.189015151510941.785595231511092.5924350716
5810990.111363636410883.474824536111096.7479027366
5910958.133712121210827.531157755211088.7362664872
6011049.106060606110898.29922076611199.9129004461
6111185.103409090911016.496236413711353.7105817681
6211143.609090909110958.909187244211328.308994574
6311078.973106060610879.474408948411278.4718031728
6411192.778787878810979.505709678311406.0518660793
6511338.901136363611112.690876603511565.1113961238
6611300.373484848511061.92693453511538.8200351619
6711213.920833333310963.835981548911464.0056851177
6811321.968181818211060.763073086211583.1732905501


Parameters (Session):
Parameters (R input):
par1 = 12 ; par2 = Triple ; par3 = additive ; par4 = 12 ;
R code (references can be found in the software module):
par1 <- as.numeric(par1)
par4 <- as.numeric(par4)
if (par2 == 'Single') K <- 1
if (par2 == 'Double') K <- 2
if (par2 == 'Triple') K <- par1
nx <- length(x)
nxmK <- nx - K
x <- ts(x, frequency = par1)
if (par2 == 'Single') fit <- HoltWinters(x, gamma=F, beta=F)
if (par2 == 'Double') fit <- HoltWinters(x, gamma=F)
if (par2 == 'Triple') fit <- HoltWinters(x, seasonal=par3)
fit
myresid <- x - fit$fitted[,'xhat']
bitmap(file='test1.png')
op <- par(mfrow=c(2,1))
plot(fit,ylab='Observed (black) / Fitted (red)',main='Interpolation Fit of Exponential Smoothing')
plot(myresid,ylab='Residuals',main='Interpolation Prediction Errors')
par(op)
dev.off()
bitmap(file='test2.png')
p <- predict(fit, par4, prediction.interval=TRUE)
np <- length(p[,1])
plot(fit,p,ylab='Observed (black) / Fitted (red)',main='Extrapolation Fit of Exponential Smoothing')
dev.off()
bitmap(file='test3.png')
op <- par(mfrow = c(2,2))
acf(as.numeric(myresid),lag.max = nx/2,main='Residual ACF')
spectrum(myresid,main='Residals Periodogram')
cpgram(myresid,main='Residal Cumulative Periodogram')
qqnorm(myresid,main='Residual Normal QQ Plot')
qqline(myresid)
par(op)
dev.off()
load(file='createtable')
a<-table.start()
a<-table.row.start(a)
a<-table.element(a,'Estimated Parameters of Exponential Smoothing',2,TRUE)
a<-table.row.end(a)
a<-table.row.start(a)
a<-table.element(a,'Parameter',header=TRUE)
a<-table.element(a,'Value',header=TRUE)
a<-table.row.end(a)
a<-table.row.start(a)
a<-table.element(a,'alpha',header=TRUE)
a<-table.element(a,fit$alpha)
a<-table.row.end(a)
a<-table.row.start(a)
a<-table.element(a,'beta',header=TRUE)
a<-table.element(a,fit$beta)
a<-table.row.end(a)
a<-table.row.start(a)
a<-table.element(a,'gamma',header=TRUE)
a<-table.element(a,fit$gamma)
a<-table.row.end(a)
a<-table.end(a)
table.save(a,file='mytable.tab')
a<-table.start()
a<-table.row.start(a)
a<-table.element(a,'Interpolation Forecasts of Exponential Smoothing',4,TRUE)
a<-table.row.end(a)
a<-table.row.start(a)
a<-table.element(a,'t',header=TRUE)
a<-table.element(a,'Observed',header=TRUE)
a<-table.element(a,'Fitted',header=TRUE)
a<-table.element(a,'Residuals',header=TRUE)
a<-table.row.end(a)
for (i in 1:nxmK) {
a<-table.row.start(a)
a<-table.element(a,i+K,header=TRUE)
a<-table.element(a,x[i+K])
a<-table.element(a,fit$fitted[i,'xhat'])
a<-table.element(a,myresid[i])
a<-table.row.end(a)
}
a<-table.end(a)
table.save(a,file='mytable1.tab')
a<-table.start()
a<-table.row.start(a)
a<-table.element(a,'Extrapolation Forecasts of Exponential Smoothing',4,TRUE)
a<-table.row.end(a)
a<-table.row.start(a)
a<-table.element(a,'t',header=TRUE)
a<-table.element(a,'Forecast',header=TRUE)
a<-table.element(a,'95% Lower Bound',header=TRUE)
a<-table.element(a,'95% Upper Bound',header=TRUE)
a<-table.row.end(a)
for (i in 1:np) {
a<-table.row.start(a)
a<-table.element(a,nx+i,header=TRUE)
a<-table.element(a,p[i,'fit'])
a<-table.element(a,p[i,'lwr'])
a<-table.element(a,p[i,'upr'])
a<-table.row.end(a)
}
a<-table.end(a)
table.save(a,file='mytable2.tab')