Free Statistics

of Irreproducible Research!

Author's title

Author*The author of this computation has been verified*
R Software Modulerwasp_structuraltimeseries.wasp
Title produced by softwareStructural Time Series Models
Date of computationWed, 07 Dec 2016 11:47:20 +0100
Cite this page as followsStatistical Computations at FreeStatistics.org, Office for Research Development and Education, URL https://freestatistics.org/blog/index.php?v=date/2016/Dec/07/t148110770227d8efi2axob4ak.htm/, Retrieved Fri, 17 May 2024 19:39:17 +0000
Statistical Computations at FreeStatistics.org, Office for Research Development and Education, URL https://freestatistics.org/blog/index.php?pk=297999, Retrieved Fri, 17 May 2024 19:39:17 +0000
QR Codes:

Original text written by user:
IsPrivate?No (this computation is public)
User-defined keywords
Estimated Impact55
Family? (F = Feedback message, R = changed R code, M = changed R Module, P = changed Parameters, D = changed Data)
-       [Structural Time Series Models] [] [2016-12-07 10:47:20] [94ac3c9a028ddd47e8862e80eac9f626] [Current]
Feedback Forum

Post a new message
Dataseries X:
2090
2181
2552
2501.5
2664.5
2941.5
3066.5
3605.5
3800
3667.5
4137
4418
4969
5204.5
5267
5447
5550
5880
6046


Summary of computational transaction
Raw Input view raw input (R code)
Raw Outputview raw output of R engine
Computing time3 seconds
R ServerBig Analytics Cloud Computing Center

\begin{tabular}{lllllllll}
\hline
Summary of computational transaction \tabularnewline
Raw Input view raw input (R code)  \tabularnewline
Raw Outputview raw output of R engine  \tabularnewline
Computing time3 seconds \tabularnewline
R ServerBig Analytics Cloud Computing Center \tabularnewline
\hline
\end{tabular}
%Source: https://freestatistics.org/blog/index.php?pk=297999&T=0

[TABLE]
[ROW]
Summary of computational transaction[/C][/ROW] [ROW]Raw Input[/C] view raw input (R code) [/C][/ROW] [ROW]Raw Output[/C]view raw output of R engine [/C][/ROW] [ROW]Computing time[/C]3 seconds[/C][/ROW] [ROW]R Server[/C]Big Analytics Cloud Computing Center[/C][/ROW] [/TABLE] Source: https://freestatistics.org/blog/index.php?pk=297999&T=0

Globally Unique Identifier (entire table): ba.freestatistics.org/blog/index.php?pk=297999&T=0

As an alternative you can also use a QR Code:  

The GUIDs for individual cells are displayed in the table below:

Summary of computational transaction
Raw Input view raw input (R code)
Raw Outputview raw output of R engine
Computing time3 seconds
R ServerBig Analytics Cloud Computing Center


Structural Time Series Model -- Interpolation
tObservedLevelSlopeSeasonalStand. Residuals
120902090000
221812142.9668340542215.96990903742193.648079745861010.483545753487208
325522412.61323886814124.1488357303988.639736857021631.95053686419586
42501.52505.9551547606110.2960517409258.63578656435804-0.20723279146989
52664.52644.65942822307123.0088859266478.493703087189510.183268885286991
62941.52886.50698267448175.9447592181237.920357340003930.762610018192348
73066.53059.67351427565174.7072260232947.92935821308878-0.0178635475281681
83605.53494.53623977428290.7469707255017.472989441821371.67590544416999
938003790.4667531667293.061529811497.468999580067110.0334268847301587
103667.53780.63680513272157.7363340151877.54255294747608-1.95422078660916
1141374075.00943562944218.7969993508877.540504578426010.881746026275099
1244184377.21449841353256.0733990929217.545070586054050.538286156035275
1349694846.12657132766346.05000408561442.54923195050991.58529678821059
145204.55204.61431872139351.179838990875-3.529545041320190.0642814438929396
1552675351.86158013393261.982693413384-5.1352237366879-1.30363715250396
1654475498.14337669962210.233091269532-5.06892329813073-0.746155040759776
1755505598.34268375803161.013375345865-4.76311563257128-0.70656975590224
1858805849.32558073178201.178208256277-4.989548493937290.578106210984496
1960466050.85181791781201.333531444615-4.990119189123210.0022405547409506

\begin{tabular}{lllllllll}
\hline
Structural Time Series Model -- Interpolation \tabularnewline
t & Observed & Level & Slope & Seasonal & Stand. Residuals \tabularnewline
1 & 2090 & 2090 & 0 & 0 & 0 \tabularnewline
2 & 2181 & 2142.96683405422 & 15.9699090374219 & 3.64807974586101 & 0.483545753487208 \tabularnewline
3 & 2552 & 2412.61323886814 & 124.148835730398 & 8.63973685702163 & 1.95053686419586 \tabularnewline
4 & 2501.5 & 2505.9551547606 & 110.296051740925 & 8.63578656435804 & -0.20723279146989 \tabularnewline
5 & 2664.5 & 2644.65942822307 & 123.008885926647 & 8.49370308718951 & 0.183268885286991 \tabularnewline
6 & 2941.5 & 2886.50698267448 & 175.944759218123 & 7.92035734000393 & 0.762610018192348 \tabularnewline
7 & 3066.5 & 3059.67351427565 & 174.707226023294 & 7.92935821308878 & -0.0178635475281681 \tabularnewline
8 & 3605.5 & 3494.53623977428 & 290.746970725501 & 7.47298944182137 & 1.67590544416999 \tabularnewline
9 & 3800 & 3790.4667531667 & 293.06152981149 & 7.46899958006711 & 0.0334268847301587 \tabularnewline
10 & 3667.5 & 3780.63680513272 & 157.736334015187 & 7.54255294747608 & -1.95422078660916 \tabularnewline
11 & 4137 & 4075.00943562944 & 218.796999350887 & 7.54050457842601 & 0.881746026275099 \tabularnewline
12 & 4418 & 4377.21449841353 & 256.073399092921 & 7.54507058605405 & 0.538286156035275 \tabularnewline
13 & 4969 & 4846.12657132766 & 346.050004085614 & 42.5492319505099 & 1.58529678821059 \tabularnewline
14 & 5204.5 & 5204.61431872139 & 351.179838990875 & -3.52954504132019 & 0.0642814438929396 \tabularnewline
15 & 5267 & 5351.86158013393 & 261.982693413384 & -5.1352237366879 & -1.30363715250396 \tabularnewline
16 & 5447 & 5498.14337669962 & 210.233091269532 & -5.06892329813073 & -0.746155040759776 \tabularnewline
17 & 5550 & 5598.34268375803 & 161.013375345865 & -4.76311563257128 & -0.70656975590224 \tabularnewline
18 & 5880 & 5849.32558073178 & 201.178208256277 & -4.98954849393729 & 0.578106210984496 \tabularnewline
19 & 6046 & 6050.85181791781 & 201.333531444615 & -4.99011918912321 & 0.0022405547409506 \tabularnewline
\hline
\end{tabular}
%Source: https://freestatistics.org/blog/index.php?pk=297999&T=1

[TABLE]
[ROW][C]Structural Time Series Model -- Interpolation[/C][/ROW]
[ROW][C]t[/C][C]Observed[/C][C]Level[/C][C]Slope[/C][C]Seasonal[/C][C]Stand. Residuals[/C][/ROW]
[ROW][C]1[/C][C]2090[/C][C]2090[/C][C]0[/C][C]0[/C][C]0[/C][/ROW]
[ROW][C]2[/C][C]2181[/C][C]2142.96683405422[/C][C]15.9699090374219[/C][C]3.64807974586101[/C][C]0.483545753487208[/C][/ROW]
[ROW][C]3[/C][C]2552[/C][C]2412.61323886814[/C][C]124.148835730398[/C][C]8.63973685702163[/C][C]1.95053686419586[/C][/ROW]
[ROW][C]4[/C][C]2501.5[/C][C]2505.9551547606[/C][C]110.296051740925[/C][C]8.63578656435804[/C][C]-0.20723279146989[/C][/ROW]
[ROW][C]5[/C][C]2664.5[/C][C]2644.65942822307[/C][C]123.008885926647[/C][C]8.49370308718951[/C][C]0.183268885286991[/C][/ROW]
[ROW][C]6[/C][C]2941.5[/C][C]2886.50698267448[/C][C]175.944759218123[/C][C]7.92035734000393[/C][C]0.762610018192348[/C][/ROW]
[ROW][C]7[/C][C]3066.5[/C][C]3059.67351427565[/C][C]174.707226023294[/C][C]7.92935821308878[/C][C]-0.0178635475281681[/C][/ROW]
[ROW][C]8[/C][C]3605.5[/C][C]3494.53623977428[/C][C]290.746970725501[/C][C]7.47298944182137[/C][C]1.67590544416999[/C][/ROW]
[ROW][C]9[/C][C]3800[/C][C]3790.4667531667[/C][C]293.06152981149[/C][C]7.46899958006711[/C][C]0.0334268847301587[/C][/ROW]
[ROW][C]10[/C][C]3667.5[/C][C]3780.63680513272[/C][C]157.736334015187[/C][C]7.54255294747608[/C][C]-1.95422078660916[/C][/ROW]
[ROW][C]11[/C][C]4137[/C][C]4075.00943562944[/C][C]218.796999350887[/C][C]7.54050457842601[/C][C]0.881746026275099[/C][/ROW]
[ROW][C]12[/C][C]4418[/C][C]4377.21449841353[/C][C]256.073399092921[/C][C]7.54507058605405[/C][C]0.538286156035275[/C][/ROW]
[ROW][C]13[/C][C]4969[/C][C]4846.12657132766[/C][C]346.050004085614[/C][C]42.5492319505099[/C][C]1.58529678821059[/C][/ROW]
[ROW][C]14[/C][C]5204.5[/C][C]5204.61431872139[/C][C]351.179838990875[/C][C]-3.52954504132019[/C][C]0.0642814438929396[/C][/ROW]
[ROW][C]15[/C][C]5267[/C][C]5351.86158013393[/C][C]261.982693413384[/C][C]-5.1352237366879[/C][C]-1.30363715250396[/C][/ROW]
[ROW][C]16[/C][C]5447[/C][C]5498.14337669962[/C][C]210.233091269532[/C][C]-5.06892329813073[/C][C]-0.746155040759776[/C][/ROW]
[ROW][C]17[/C][C]5550[/C][C]5598.34268375803[/C][C]161.013375345865[/C][C]-4.76311563257128[/C][C]-0.70656975590224[/C][/ROW]
[ROW][C]18[/C][C]5880[/C][C]5849.32558073178[/C][C]201.178208256277[/C][C]-4.98954849393729[/C][C]0.578106210984496[/C][/ROW]
[ROW][C]19[/C][C]6046[/C][C]6050.85181791781[/C][C]201.333531444615[/C][C]-4.99011918912321[/C][C]0.0022405547409506[/C][/ROW]
[/TABLE]
Source: https://freestatistics.org/blog/index.php?pk=297999&T=1

Globally Unique Identifier (entire table): ba.freestatistics.org/blog/index.php?pk=297999&T=1

As an alternative you can also use a QR Code:  

The GUIDs for individual cells are displayed in the table below:

Structural Time Series Model -- Interpolation
tObservedLevelSlopeSeasonalStand. Residuals
120902090000
221812142.9668340542215.96990903742193.648079745861010.483545753487208
325522412.61323886814124.1488357303988.639736857021631.95053686419586
42501.52505.9551547606110.2960517409258.63578656435804-0.20723279146989
52664.52644.65942822307123.0088859266478.493703087189510.183268885286991
62941.52886.50698267448175.9447592181237.920357340003930.762610018192348
73066.53059.67351427565174.7072260232947.92935821308878-0.0178635475281681
83605.53494.53623977428290.7469707255017.472989441821371.67590544416999
938003790.4667531667293.061529811497.468999580067110.0334268847301587
103667.53780.63680513272157.7363340151877.54255294747608-1.95422078660916
1141374075.00943562944218.7969993508877.540504578426010.881746026275099
1244184377.21449841353256.0733990929217.545070586054050.538286156035275
1349694846.12657132766346.05000408561442.54923195050991.58529678821059
145204.55204.61431872139351.179838990875-3.529545041320190.0642814438929396
1552675351.86158013393261.982693413384-5.1352237366879-1.30363715250396
1654475498.14337669962210.233091269532-5.06892329813073-0.746155040759776
1755505598.34268375803161.013375345865-4.76311563257128-0.70656975590224
1858805849.32558073178201.178208256277-4.989548493937290.578106210984496
1960466050.85181791781201.333531444615-4.990119189123210.0022405547409506


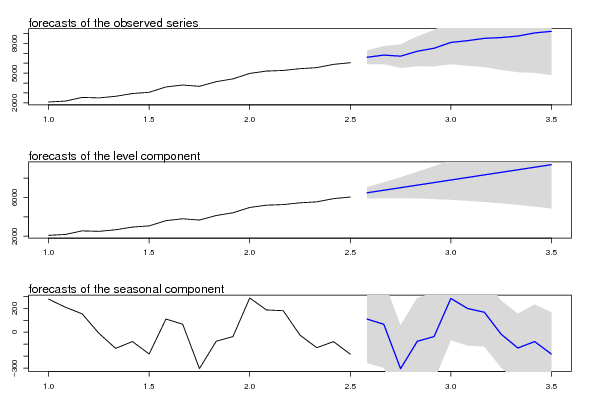
Structural Time Series Model -- Extrapolation
tObservedLevelSeasonal
16594.282311429376483.95755607062110.324755358755
26814.785592818366748.1158094228166.6697833955459
36707.207665542247012.27406277501-305.066397232766
47200.547343311997276.43231612721-75.8849728152142
57504.305751856687540.5905694794-36.2848176227253
68087.635847352237804.7488228316282.887024520628
78267.67296858788068.9070761838198.765892404
88500.669513853528333.06532953599167.604184317527
98581.125409082058597.22358288819-16.0981738061376
108729.290466502318861.38183624039-132.091369738074
119047.414580060649125.54008959258-78.1255095319373
129206.997943695179389.69834294478-182.700399249602

\begin{tabular}{lllllllll}
\hline
Structural Time Series Model -- Extrapolation \tabularnewline
t & Observed & Level & Seasonal \tabularnewline
1 & 6594.28231142937 & 6483.95755607062 & 110.324755358755 \tabularnewline
2 & 6814.78559281836 & 6748.11580942281 & 66.6697833955459 \tabularnewline
3 & 6707.20766554224 & 7012.27406277501 & -305.066397232766 \tabularnewline
4 & 7200.54734331199 & 7276.43231612721 & -75.8849728152142 \tabularnewline
5 & 7504.30575185668 & 7540.5905694794 & -36.2848176227253 \tabularnewline
6 & 8087.63584735223 & 7804.7488228316 & 282.887024520628 \tabularnewline
7 & 8267.6729685878 & 8068.9070761838 & 198.765892404 \tabularnewline
8 & 8500.66951385352 & 8333.06532953599 & 167.604184317527 \tabularnewline
9 & 8581.12540908205 & 8597.22358288819 & -16.0981738061376 \tabularnewline
10 & 8729.29046650231 & 8861.38183624039 & -132.091369738074 \tabularnewline
11 & 9047.41458006064 & 9125.54008959258 & -78.1255095319373 \tabularnewline
12 & 9206.99794369517 & 9389.69834294478 & -182.700399249602 \tabularnewline
\hline
\end{tabular}
%Source: https://freestatistics.org/blog/index.php?pk=297999&T=2

[TABLE]
[ROW][C]Structural Time Series Model -- Extrapolation[/C][/ROW]
[ROW][C]t[/C][C]Observed[/C][C]Level[/C][C]Seasonal[/C][/ROW]
[ROW][C]1[/C][C]6594.28231142937[/C][C]6483.95755607062[/C][C]110.324755358755[/C][/ROW]
[ROW][C]2[/C][C]6814.78559281836[/C][C]6748.11580942281[/C][C]66.6697833955459[/C][/ROW]
[ROW][C]3[/C][C]6707.20766554224[/C][C]7012.27406277501[/C][C]-305.066397232766[/C][/ROW]
[ROW][C]4[/C][C]7200.54734331199[/C][C]7276.43231612721[/C][C]-75.8849728152142[/C][/ROW]
[ROW][C]5[/C][C]7504.30575185668[/C][C]7540.5905694794[/C][C]-36.2848176227253[/C][/ROW]
[ROW][C]6[/C][C]8087.63584735223[/C][C]7804.7488228316[/C][C]282.887024520628[/C][/ROW]
[ROW][C]7[/C][C]8267.6729685878[/C][C]8068.9070761838[/C][C]198.765892404[/C][/ROW]
[ROW][C]8[/C][C]8500.66951385352[/C][C]8333.06532953599[/C][C]167.604184317527[/C][/ROW]
[ROW][C]9[/C][C]8581.12540908205[/C][C]8597.22358288819[/C][C]-16.0981738061376[/C][/ROW]
[ROW][C]10[/C][C]8729.29046650231[/C][C]8861.38183624039[/C][C]-132.091369738074[/C][/ROW]
[ROW][C]11[/C][C]9047.41458006064[/C][C]9125.54008959258[/C][C]-78.1255095319373[/C][/ROW]
[ROW][C]12[/C][C]9206.99794369517[/C][C]9389.69834294478[/C][C]-182.700399249602[/C][/ROW]
[/TABLE]
Source: https://freestatistics.org/blog/index.php?pk=297999&T=2

Globally Unique Identifier (entire table): ba.freestatistics.org/blog/index.php?pk=297999&T=2

As an alternative you can also use a QR Code:  

The GUIDs for individual cells are displayed in the table below:

Structural Time Series Model -- Extrapolation
tObservedLevelSeasonal
16594.282311429376483.95755607062110.324755358755
26814.785592818366748.1158094228166.6697833955459
36707.207665542247012.27406277501-305.066397232766
47200.547343311997276.43231612721-75.8849728152142
57504.305751856687540.5905694794-36.2848176227253
68087.635847352237804.7488228316282.887024520628
78267.67296858788068.9070761838198.765892404
88500.669513853528333.06532953599167.604184317527
98581.125409082058597.22358288819-16.0981738061376
108729.290466502318861.38183624039-132.091369738074
119047.414580060649125.54008959258-78.1255095319373
129206.997943695179389.69834294478-182.700399249602


Parameters (Session):
par1 = 12 ; par2 = 12 ; par3 = BFGS ;
Parameters (R input):
par1 = 12 ; par2 = 12 ; par3 = BFGS ;
R code (references can be found in the software module):
require('stsm')
require('stsm.class')
require('KFKSDS')
par1 <- as.numeric(par1)
par2 <- as.numeric(par2)
nx <- length(x)
x <- ts(x,frequency=par1)
m <- StructTS(x,type='BSM')
print(m$coef)
print(m$fitted)
print(m$resid)
mylevel <- as.numeric(m$fitted[,'level'])
myslope <- as.numeric(m$fitted[,'slope'])
myseas <- as.numeric(m$fitted[,'sea'])
myresid <- as.numeric(m$resid)
myfit <- mylevel+myseas
mm <- stsm.model(model = 'BSM', y = x, transPars = 'StructTS')
fit2 <- stsmFit(mm, stsm.method = 'maxlik.td.optim', method = par3, KF.args = list(P0cov = TRUE))
(fit2.comps <- tsSmooth(fit2, P0cov = FALSE)$states)
m2 <- set.pars(mm, pmax(fit2$par, .Machine$double.eps))
(ss <- char2numeric(m2))
(pred <- predict(ss, x, n.ahead = par2))
mylagmax <- nx/2
bitmap(file='test2.png')
op <- par(mfrow = c(2,2))
acf(as.numeric(x),lag.max = mylagmax,main='Observed')
acf(mylevel,na.action=na.pass,lag.max = mylagmax,main='Level')
acf(myseas,na.action=na.pass,lag.max = mylagmax,main='Seasonal')
acf(myresid,na.action=na.pass,lag.max = mylagmax,main='Standardized Residals')
par(op)
dev.off()
bitmap(file='test3.png')
op <- par(mfrow = c(2,2))
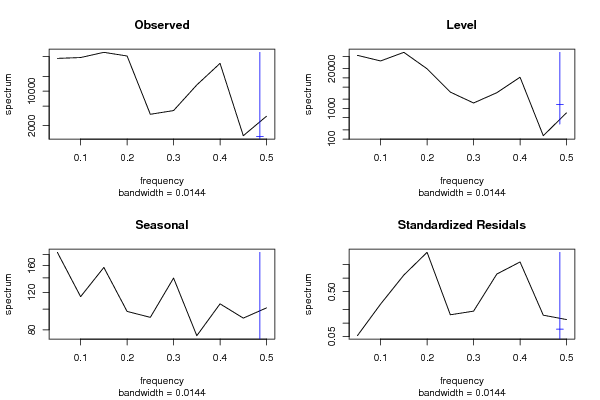
spectrum(as.numeric(x),main='Observed')
spectrum(mylevel,main='Level')
spectrum(myseas,main='Seasonal')
spectrum(myresid,main='Standardized Residals')
par(op)
dev.off()
bitmap(file='test4.png')
op <- par(mfrow = c(2,2))
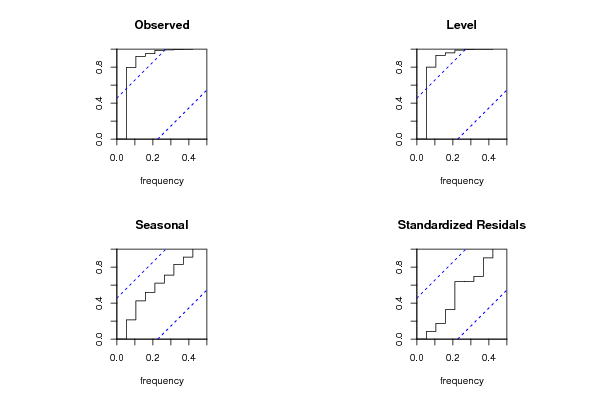
cpgram(as.numeric(x),main='Observed')
cpgram(mylevel,main='Level')
cpgram(myseas,main='Seasonal')
cpgram(myresid,main='Standardized Residals')
par(op)
dev.off()
bitmap(file='test1.png')
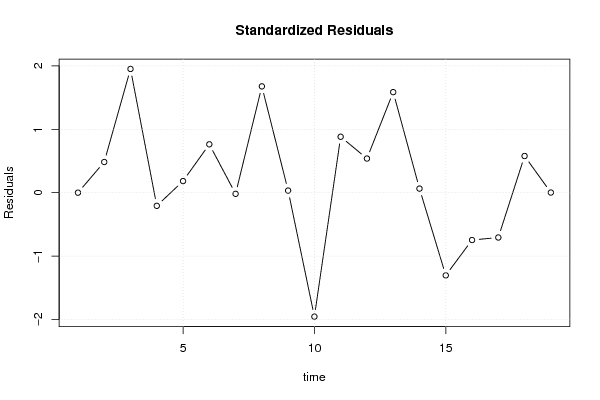
plot(as.numeric(m$resid),main='Standardized Residuals',ylab='Residuals',xlab='time',type='b')
grid()
dev.off()
bitmap(file='test5.png')
op <- par(mfrow = c(2,2))
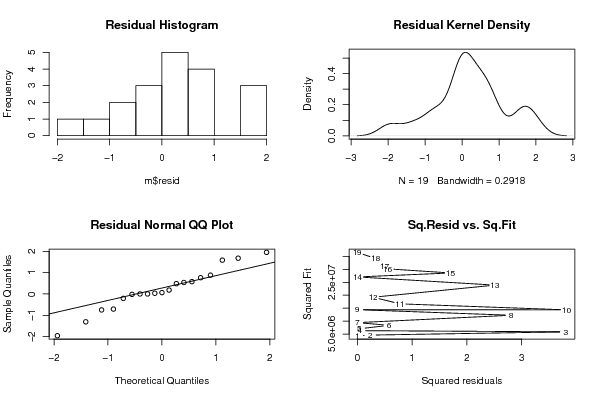
hist(m$resid,main='Residual Histogram')
plot(density(m$resid),main='Residual Kernel Density')
qqnorm(m$resid,main='Residual Normal QQ Plot')
qqline(m$resid)
plot(m$resid^2, myfit^2,main='Sq.Resid vs. Sq.Fit',xlab='Squared residuals',ylab='Squared Fit')
par(op)
dev.off()
bitmap(file='test6.png')
par(mfrow = c(3,1), mar = c(3,3,3,3))
plot(cbind(x, pred$pred), type = 'n', plot.type = 'single', ylab = '')
lines(x)
polygon(c(time(pred$pred), rev(time(pred$pred))), c(pred$pred + 2 * pred$se, rev(pred$pred)), col = 'gray85', border = NA)
polygon(c(time(pred$pred), rev(time(pred$pred))), c(pred$pred - 2 * pred$se, rev(pred$pred)), col = ' gray85', border = NA)
lines(pred$pred, col = 'blue', lwd = 1.5)
mtext(text = 'forecasts of the observed series', side = 3, adj = 0)
plot(cbind(x, pred$a[,1]), type = 'n', plot.type = 'single', ylab = '')
lines(x)
polygon(c(time(pred$a[,1]), rev(time(pred$a[,1]))), c(pred$a[,1] + 2 * sqrt(pred$P[,1]), rev(pred$a[,1])), col = 'gray85', border = NA)
polygon(c(time(pred$a[,1]), rev(time(pred$a[,1]))), c(pred$a[,1] - 2 * sqrt(pred$P[,1]), rev(pred$a[,1])), col = ' gray85', border = NA)
lines(pred$a[,1], col = 'blue', lwd = 1.5)
mtext(text = 'forecasts of the level component', side = 3, adj = 0)
plot(cbind(fit2.comps[,3], pred$a[,3]), type = 'n', plot.type = 'single', ylab = '')
lines(fit2.comps[,3])
polygon(c(time(pred$a[,3]), rev(time(pred$a[,3]))), c(pred$a[,3] + 2 * sqrt(pred$P[,3]), rev(pred$a[,3])), col = 'gray85', border = NA)
polygon(c(time(pred$a[,3]), rev(time(pred$a[,3]))), c(pred$a[,3] - 2 * sqrt(pred$P[,3]), rev(pred$a[,3])), col = ' gray85', border = NA)
lines(pred$a[,3], col = 'blue', lwd = 1.5)
mtext(text = 'forecasts of the seasonal component', side = 3, adj = 0)
dev.off()
load(file='createtable')
a<-table.start()
a<-table.row.start(a)
a<-table.element(a,'Structural Time Series Model -- Interpolation',6,TRUE)
a<-table.row.end(a)
a<-table.row.start(a)
a<-table.element(a,'t',header=TRUE)
a<-table.element(a,'Observed',header=TRUE)
a<-table.element(a,'Level',header=TRUE)
a<-table.element(a,'Slope',header=TRUE)
a<-table.element(a,'Seasonal',header=TRUE)
a<-table.element(a,'Stand. Residuals',header=TRUE)
a<-table.row.end(a)
for (i in 1:nx) {
a<-table.row.start(a)
a<-table.element(a,i,header=TRUE)
a<-table.element(a,x[i])
a<-table.element(a,mylevel[i])
a<-table.element(a,myslope[i])
a<-table.element(a,myseas[i])
a<-table.element(a,myresid[i])
a<-table.row.end(a)
}
a<-table.end(a)
table.save(a,file='mytable.tab')
a<-table.start()
a<-table.row.start(a)
a<-table.element(a,'Structural Time Series Model -- Extrapolation',4,TRUE)
a<-table.row.end(a)
a<-table.row.start(a)
a<-table.element(a,'t',header=TRUE)
a<-table.element(a,'Observed',header=TRUE)
a<-table.element(a,'Level',header=TRUE)
a<-table.element(a,'Seasonal',header=TRUE)
a<-table.row.end(a)
for (i in 1:par2) {
a<-table.row.start(a)
a<-table.element(a,i,header=TRUE)
a<-table.element(a,pred$pred[i])
a<-table.element(a,pred$a[i,1])
a<-table.element(a,pred$a[i,3])
a<-table.row.end(a)
}
a<-table.end(a)
table.save(a,file='mytable1.tab')